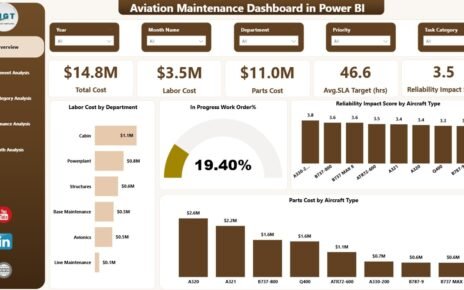
The aviation industry operates in one of the most complex and safety-critical environments in the world. Airlines, aircraft operators, and
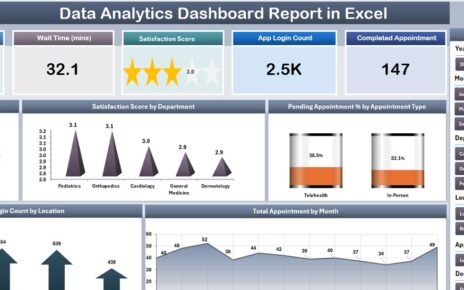
The Data Analytics Dashboard Report in Excel is a 4-worksheet appointment-analytics report that tracks 5 headline KPIs across Summary, Report,
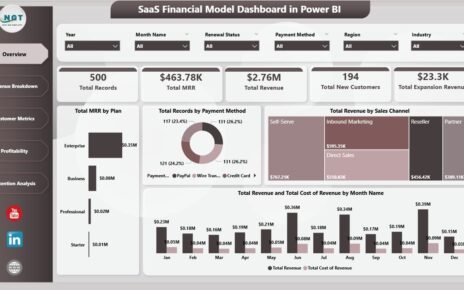
SaaS Financial Model Dashboard in Power BI is a comprehensive, ready-to-use Power BI template built for SaaS founders, finance leaders,