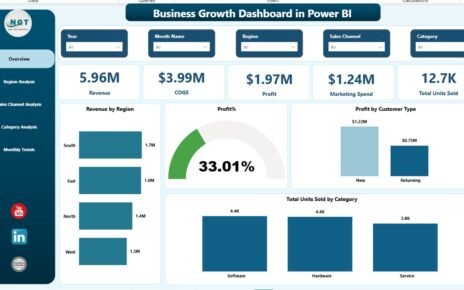
In today’s competitive market, businesses must move fast. Markets change quickly. Customer preferences shift constantly. Costs rise unexpectedly. Therefore, companies
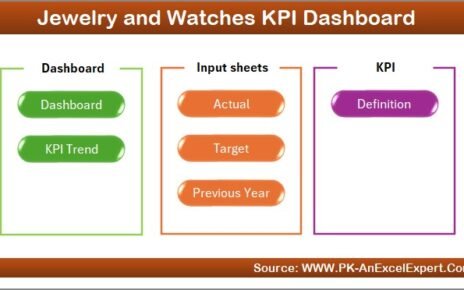
In the luxury retail world, precision and presentation matter as much as performance. The jewellery and watches industry thrives on
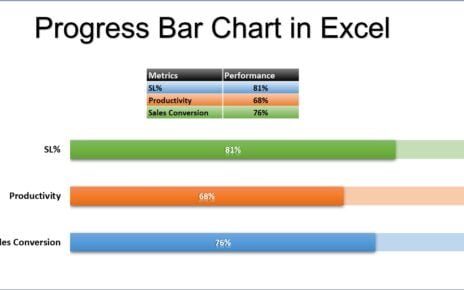
Progress Bar Chart in Excel Progress Bar Chart in Excel is very useful chart to show the completion% or other