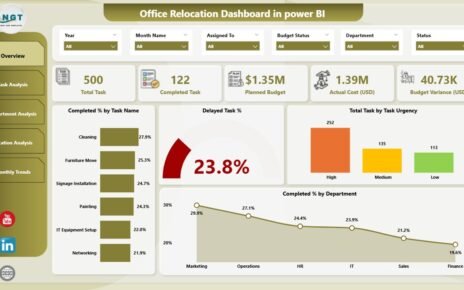
Relocating an office is one of the most challenging projects for any organization. From managing budgets and coordinating departments to
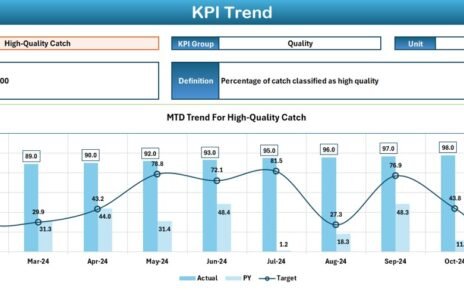
In the competitive realm of the fishing industry, tracking key performance indicators (KPIs) is crucial for maintaining a competitive edge.
In today's fast-paced business environment, effective project management is crucial for success. One of the most popular tools for managing