Water management plays a crucial role in modern agriculture. Farmers, agribusiness companies, irrigation managers, and policy-makers constantly monitor water usage, irrigation costs, energy consumption, and crop coverage. However, raw irrigation data often remains scattered across spreadsheets, sensor systems, and manual logs. As a result, decision-making becomes slow, stressful, and error-prone.
That is exactly where an Irrigation Systems Dashboard in Power BI becomes a powerful solution.
In this detailed and SEO-friendly guide, you will learn what an Irrigation Systems Dashboard in Power BI is, why it matters, how it works, and how each dashboard page drives better irrigation decisions. Additionally, you will explore its advantages, best practices, improvement opportunities, and frequently asked questions. Most importantly, this article explains everything in simple, clear, and practical language, so anyone can understand and use it.
Click to Purchases Irrigation Systems Dashboard in Power BI
What Is an Irrigation Systems Dashboard in Power BI?
An Irrigation Systems Dashboard in Power BI is a visual and interactive analytics tool designed to track, analyze, and optimize irrigation operations. It transforms raw data related to water usage, irrigation types, soil conditions, energy consumption, costs, and regions into meaningful insights using dynamic charts, KPIs, and slicers.
Instead of reviewing multiple reports and spreadsheets, users can:
-
Monitor water usage by soil type, crop, and region
-
Analyze irrigation cost and energy consumption
-
Compare different irrigation methods
-
Track irrigation hours monthly
-
Identify inefficiencies and reduce waste
Because Power BI updates visuals dynamically, decision-makers always stay informed with the latest data.
Why Do Organizations Need an Irrigation Systems Dashboard in Power BI?
Irrigation directly impacts crop yield, sustainability, and profitability. However, without clear insights, organizations struggle to balance water availability, energy consumption, and operating costs.
An Irrigation Systems Dashboard in Power BI helps organizations because it:
-
Centralizes irrigation data in one place
-
Improves water efficiency
-
Reduces operational costs
-
Supports sustainable agriculture practices
-
Enables faster and better decisions
Moreover, it helps both small farms and large agricultural enterprises manage irrigation intelligently.
How Does an Irrigation Systems Dashboard in Power BI Work?
The dashboard works by connecting Power BI to structured data sources such as:
-
Excel files
-
IoT irrigation sensors
-
Farm management systems
-
Weather data sources
-
Manual irrigation logs
Once the data loads, Power BI applies calculations, filters, and visual logic. As a result, users can explore irrigation performance through slicers such as Region, Soil Type, Crop Type, Irrigation Type, and Month.
Because Power BI responds instantly, users can drill down into details without technical expertise.
Key Pages of the Irrigation Systems Dashboard in Power BI
This dashboard includes five well-structured pages, each designed to answer specific irrigation-related questions clearly and visually.
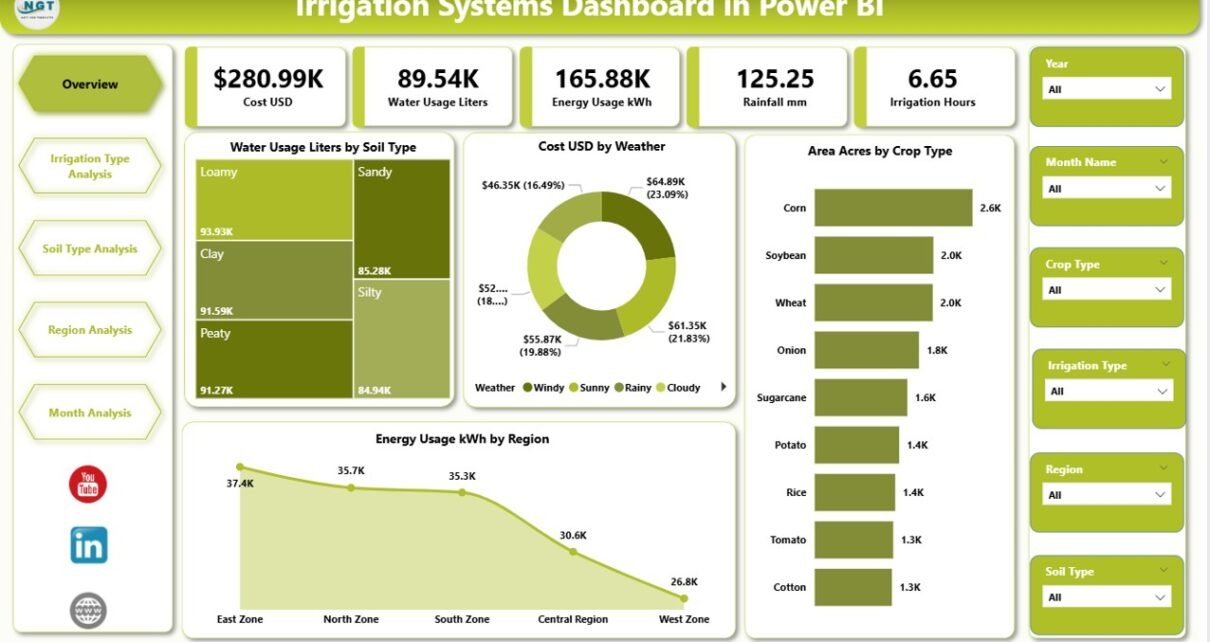
Overview Page: How Can You Get a Quick Snapshot of Irrigation Performance?

The Overview Page serves as the central control panel of the dashboard. It provides a high-level summary of irrigation operations using clean visuals and slicers.
Key Elements of the Overview Page
Slicers
-
Region
-
Crop Type
-
Soil Type
-
Weather Condition
These slicers allow users to filter all visuals instantly.
KPI Cards
-
Total Water Usage (Liters)
-
Total Irrigation Cost (USD)
-
Total Area Covered (Acres)
-
Total Energy Usage (kWh)
Charts on the Overview Page
-
Water Usage (Liters) by Soil Type
-
Cost (USD) by Weather
-
Area (Acres) by Crop Type
-
Energy Usage (kWh) by Region
Why Is the Overview Page Important?
Because this page shows the complete picture in seconds, managers can quickly identify:
-
High water-consuming soil types
-
Weather patterns driving higher costs
-
Crop types needing more irrigation
-
Regions consuming excessive energy
As a result, teams can take corrective action immediately.
Irrigation Type Analysis: Which Irrigation Method Performs Best?
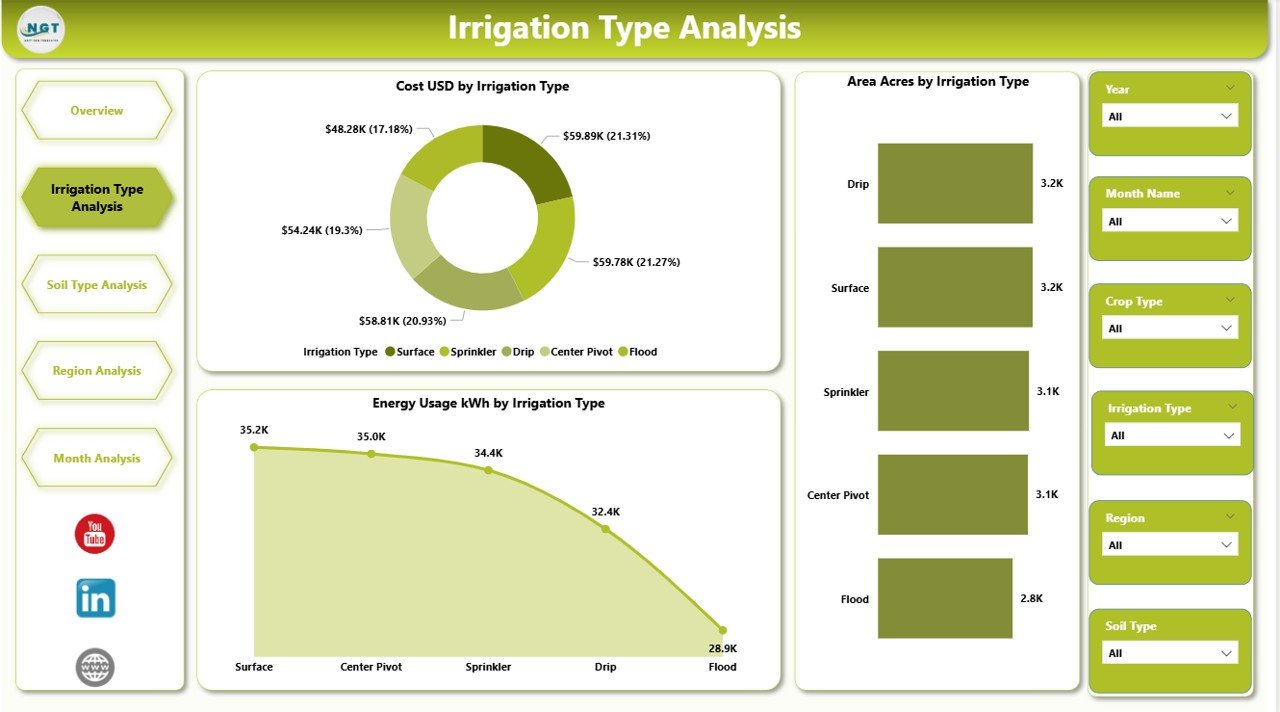
The Irrigation Type Analysis Page focuses on comparing irrigation technologies such as drip, sprinkler, surface, and pivot systems.
Charts on This Page
-
Cost (USD) by Irrigation Type
-
Area (Acres) by Irrigation Type
-
Energy Usage (kWh) by Irrigation Type
Insights You Can Get
Because each irrigation method consumes water and energy differently, this page helps users:
-
Identify cost-effective irrigation systems
-
Understand energy-intensive methods
-
Optimize irrigation system selection
-
Plan system upgrades
Moreover, decision-makers can compare performance across regions and crops using slicers.
Click to Purchases Irrigation Systems Dashboard in Power BI
Soil Type Analysis: How Does Soil Affect Irrigation Efficiency?
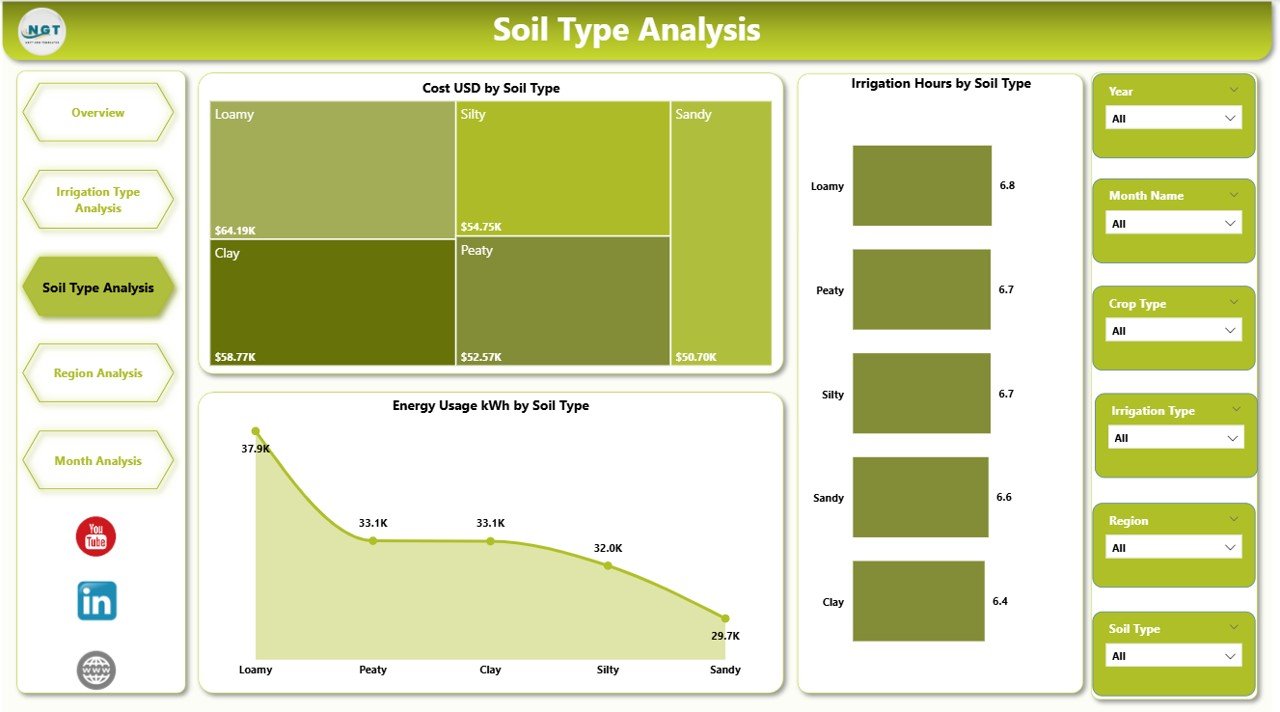
Soil plays a critical role in water absorption, retention, and runoff. Therefore, the Soil Type Analysis Page helps users understand how different soils impact irrigation.
Charts on This Page
-
Cost (USD) by Soil Type
-
Irrigation Hours by Soil Type
-
Energy Usage (kWh) by Soil Type
Key Benefits of Soil Analysis
This page helps agriculture managers:
-
Identify water-intensive soil types
-
Adjust irrigation duration by soil condition
-
Prevent over-irrigation or under-irrigation
-
Improve soil-specific irrigation planning
Because soil behavior varies widely, this analysis supports precise water management.
Region Analysis: Which Regions Consume the Most Resources?
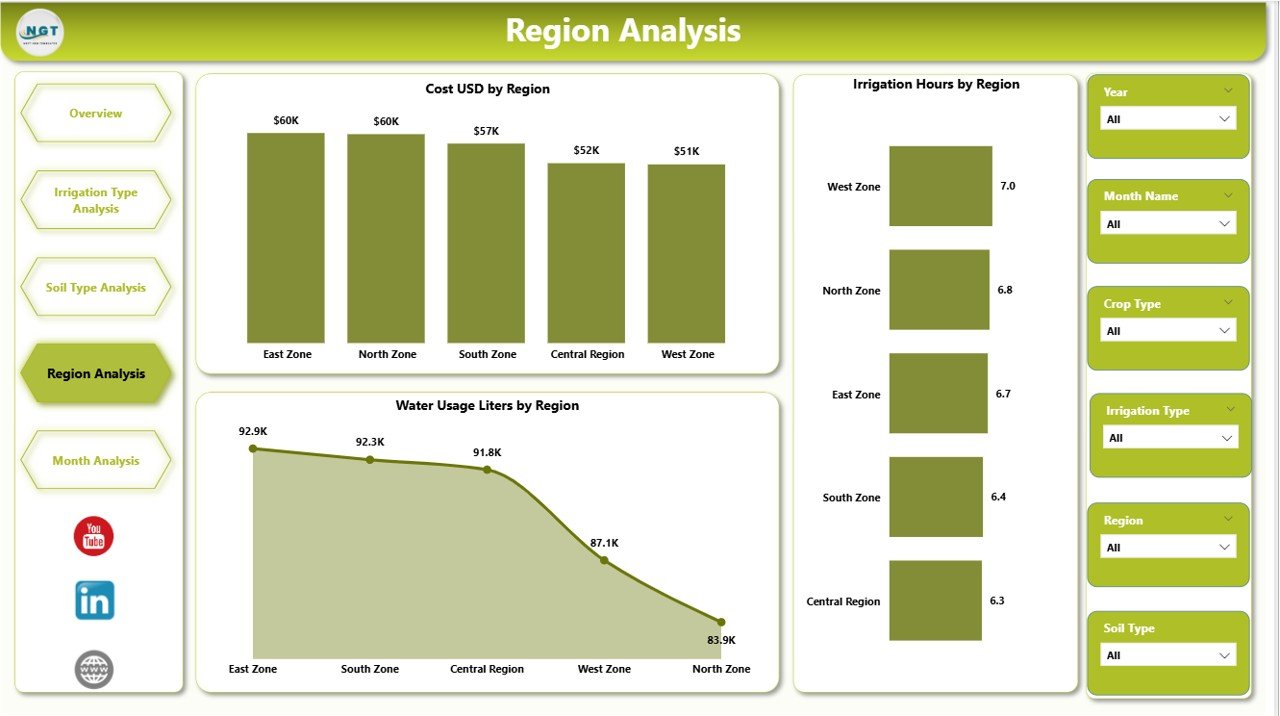
The Region Analysis Page provides a geographic perspective of irrigation operations.
Charts on This Page
-
Cost (USD) by Region
-
Irrigation Hours by Region
-
Water Usage (Liters) by Region
Why Regional Analysis Matters
With this page, organizations can:
-
Compare irrigation efficiency across regions
-
Detect regions with unusually high costs
-
Allocate resources more effectively
-
Design region-specific water strategies
Consequently, regional managers can optimize irrigation planning based on local conditions.
Monthly Trends: How Does Irrigation Change Over Time?
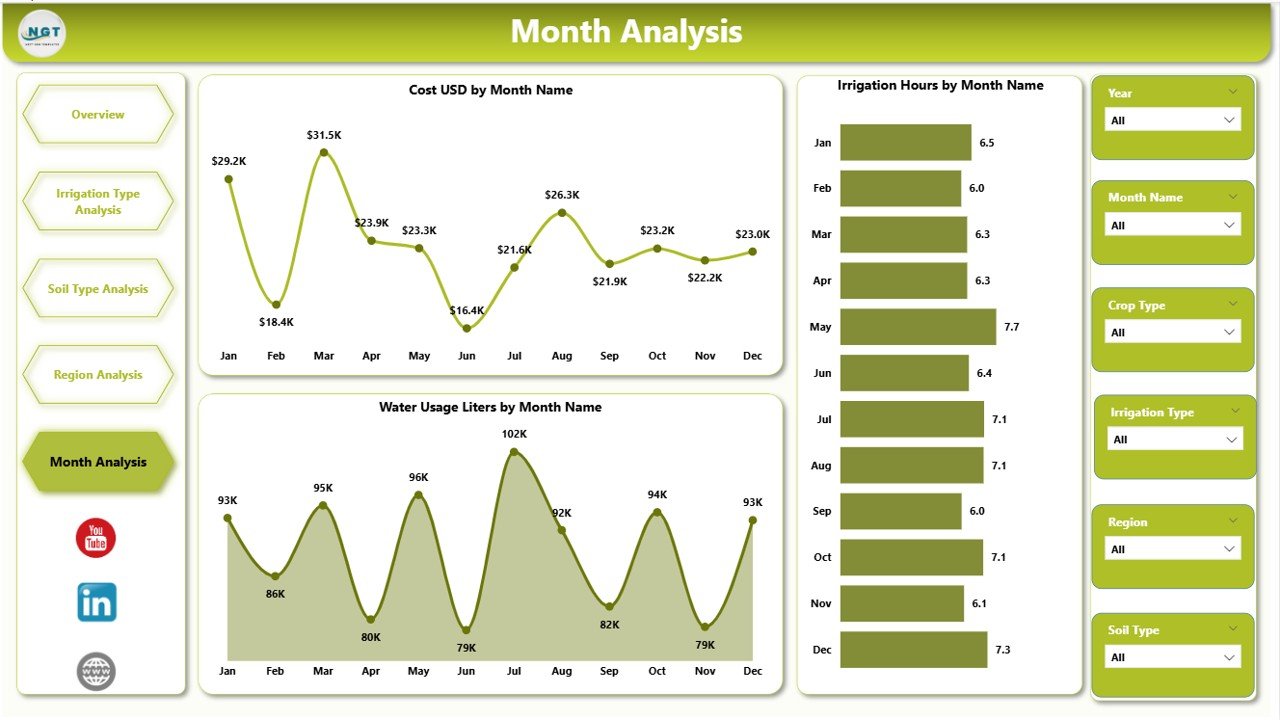
The Monthly Trends Page focuses on seasonal and temporal analysis.
Charts on This Page
-
Cost (USD) by Month
-
Irrigation Hours by Month
-
Water Usage (Liters) by Month
Insights from Monthly Trends
This page allows users to:
-
Identify peak irrigation months
-
Track seasonal water demand
-
Plan energy consumption
-
Forecast future irrigation costs
As a result, agricultural planners can improve budgeting and scheduling.
Advantages of Irrigation Systems Dashboard in Power BI
An Irrigation Systems Dashboard in Power BI delivers several powerful advantages.
✅ Centralized Data Visibility
All irrigation metrics appear in one interactive dashboard.
✅ Better Water Management
Because users track water usage clearly, they reduce waste significantly.
✅ Cost Optimization
By analyzing cost drivers, organizations control irrigation expenses effectively.
✅ Energy Efficiency
The dashboard highlights energy-heavy operations, enabling energy-saving actions.
✅ Data-Driven Decisions
Dashboards replace guesswork with factual insights.
✅ Easy Customization
Power BI allows users to add filters, visuals, and metrics easily.
Opportunities for Improvement in Irrigation Systems Dashboards
Although the dashboard already adds strong value, organizations can enhance it further.
Key Improvement Opportunities
-
Integration with real-time IoT sensors
-
Automated alerts for excess water usage
-
Weather forecast connectivity
-
Yield correlation analysis
-
Mobile-friendly dashboard views
By enhancing data sources and automation, irrigation optimization becomes even stronger.
Best Practices for the Irrigation Systems Dashboard in Power BI
Following best practices ensures long-term dashboard success.
✅ Use Clean and Structured Data
Always standardize units such as liters, kWh, and acres.
✅ Define Clear KPIs
Avoid too many metrics. Focus on high-impact irrigation KPIs.
✅ Use Slicers Wisely
Provide only relevant filters to prevent confusion.
✅ Update Data Regularly
Schedule refreshes to keep insights current.
✅ Keep the Design Simple
Use clear visuals and avoid clutter.
✅ Train End Users
Ensure users understand how to interpret charts and filters.
Who Should Use the Irrigation Systems Dashboard in Power BI?
Click to Purchases Irrigation Systems Dashboard in Power BI
This dashboard suits multiple stakeholders, including:
-
Farmers and farm owners
-
Irrigation managers
-
Agribusiness companies
-
Sustainability consultants
-
Government agriculture departments
-
Water resource planners
Because the dashboard adapts easily, it fits both small and large operations.
How Does This Dashboard Support Sustainable Agriculture?
Sustainability depends on responsible water and energy usage. This dashboard supports sustainability by:
-
Tracking water efficiency
-
Reducing energy waste
-
Minimizing cost overruns
-
Supporting compliance reporting
-
Encouraging data-driven conservation
As a result, organizations protect both profits and natural resources.
Conclusion: Why Is the Irrigation Systems Dashboard in Power BI a Must-Have Tool?
In today’s data-driven agricultural landscape, irrigation efficiency determines success. However, without real-time insights, organizations struggle to manage water, energy, and costs effectively.
The Irrigation Systems Dashboard in Power BI solves this challenge by converting complex irrigation data into clear, actionable insights. With structured pages, powerful visuals, and interactive slicers, users can monitor performance, reduce waste, and improve decision-making.
Ultimately, this dashboard empowers organizations to achieve smart irrigation, cost control, and sustainable agriculture—all in one place.
Frequently Asked Questions (FAQs)
What is an Irrigation Systems Dashboard in Power BI?
An Irrigation Systems Dashboard in Power BI is an interactive analytics tool that tracks water usage, irrigation cost, energy consumption, and operational efficiency.
Who can use this dashboard?
Farmers, irrigation managers, agribusiness firms, consultants, and government agencies can use it effectively.
Does this dashboard support real-time data?
Yes, it supports real-time or scheduled data refresh depending on the data source.
Can I customize the dashboard?
Yes, Power BI allows full customization of visuals, filters, KPIs, and data connections.
What data sources work best with this dashboard?
Excel files, IoT sensors, farm management systems, and weather data sources work well.
How does this dashboard improve sustainability?
It helps reduce water waste, minimize energy usage, and optimize irrigation planning.
Visit our YouTube channel to learn step-by-step video tutorials