Managing treasury operations without clear performance visibility often leads to cash mismatches, liquidity risks, delayed decisions, and missed optimization opportunities. Although many organizations track treasury data in Excel, they still struggle to convert numbers into actionable insights. As a result, finance teams spend more time preparing reports than analyzing performance.
That is exactly where a Treasury Operations KPI Dashboard in Excel becomes a powerful and practical solution.
In this detailed article, you will clearly understand what a Treasury Operations KPI Dashboard in Excel is, how it works, why it is essential, and how each worksheet supports efficient treasury management. Moreover, you will also learn its advantages, best practices, Excel structure, and frequently asked questions—explained in a clear and easy way.
Click to Purchases Treasury Operations KPI Dashboard in Excel
What Is a Treasury Operations KPI Dashboard in Excel?
A Treasury Operations KPI Dashboard in Excel is a structured performance-tracking tool designed to monitor key treasury metrics such as cash position, liquidity, funding efficiency, targets, and trends.
Instead of working with multiple Excel files and manual reports, this dashboard centralizes treasury KPIs into one interactive Excel workbook. As a result, treasury teams can track monthly and yearly performance with minimal manual effort.
Most importantly, this dashboard:
-
Tracks actual vs target values
-
Compares current year with previous year performance
-
Provides MTD and YTD analysis
-
Highlights performance gaps using indicators
-
Supports faster, data-driven decisions
Because Excel remains flexible and user-friendly, this dashboard suits organizations of all sizes.
Why Do Treasury Operations Need a KPI Dashboard?
Treasury operations directly impact liquidity, financial stability, and risk management. Therefore, even small inefficiencies can lead to significant financial consequences.
Without a KPI dashboard:
-
You may miss early liquidity warning signals
-
You may struggle to compare actual performance with targets
-
You may spend excessive time creating reports
-
You may rely on assumptions instead of data
However, a Treasury Operations KPI Dashboard in Excel solves these problems by offering:
-
Clear visibility into treasury performance
-
Faster month-end and year-end analysis
-
Standardized KPI tracking
-
Improved management confidence
As a result, treasury teams gain control, clarity, and consistency.
Click to Purchases Treasury Operations KPI Dashboard in Excel
Overview of Treasury Operations KPI Dashboard in Excel
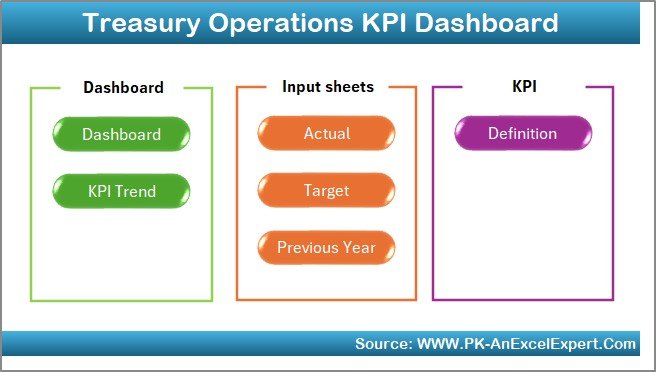
This ready-to-use Treasury Operations KPI Dashboard in Excel consists of 7 well-structured worksheets. Each worksheet serves a specific purpose and supports end-to-end treasury analysis.
The seven worksheets are:
-
Home Sheet
-
Dashboard Sheet
-
KPI Trend Sheet
-
Actual Numbers Input Sheet
-
Target Sheet
-
Previous Year Number Sheet
-
KPI Definition Sheet
Let us now explore each worksheet in detail.
What Is the Purpose of the Home Sheet?
The Home Sheet works as an index or navigation page.
On this sheet:
-
You will see 6 clearly designed buttons
-
Each button allows quick navigation to a specific worksheet
Because of this structure, users can easily move between dashboard views, trends, and data input sheets without confusion.
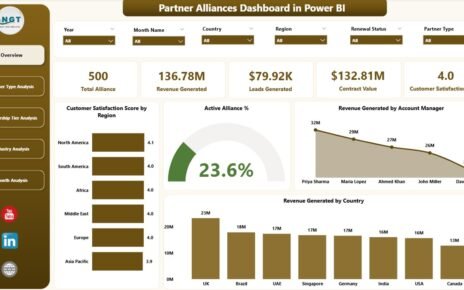
What Does the Dashboard Sheet Show?
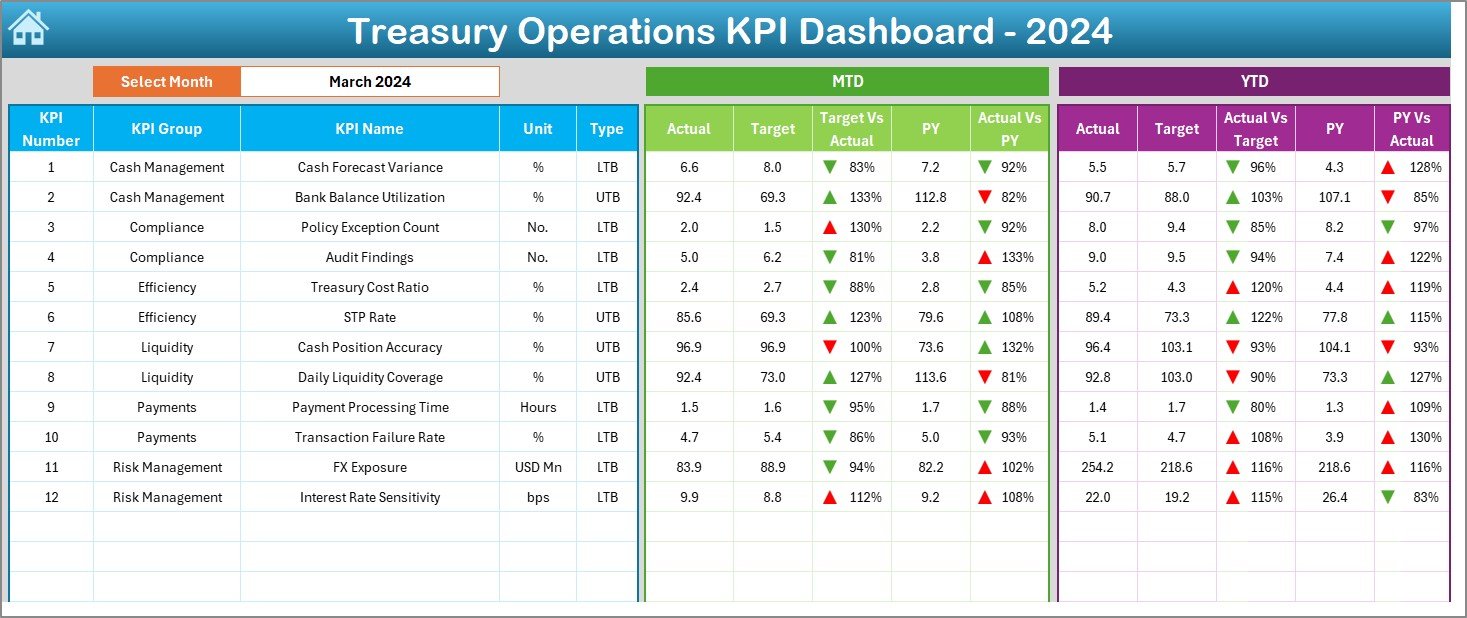
The Dashboard Sheet serves as the heart of the workbook.
On this sheet:
-
You select the Month from a drop-down located at cell D3
-
The entire dashboard updates automatically based on the selected month
KPI Performance on the Dashboard Sheet
The dashboard displays complete KPI performance using:
-
MTD Actual
-
MTD Target
-
MTD Previous Year
-
Target vs Actual (MTD)
-
PY vs Actual (MTD)
In addition, the dashboard also shows:
-
YTD Actual
-
YTD Target
-
YTD Previous Year
-
Target vs Actual (YTD)
-
PY vs Actual (YTD)
To improve readability, the dashboard uses conditional formatting with up and down arrows:
-
▲ indicates favorable performance
-
▼ indicates unfavorable performance
As a result, users can immediately identify KPIs that need attention.
Click to Purchases Treasury Operations KPI Dashboard in Excel
How Does the KPI Trend Sheet Help Analysis?
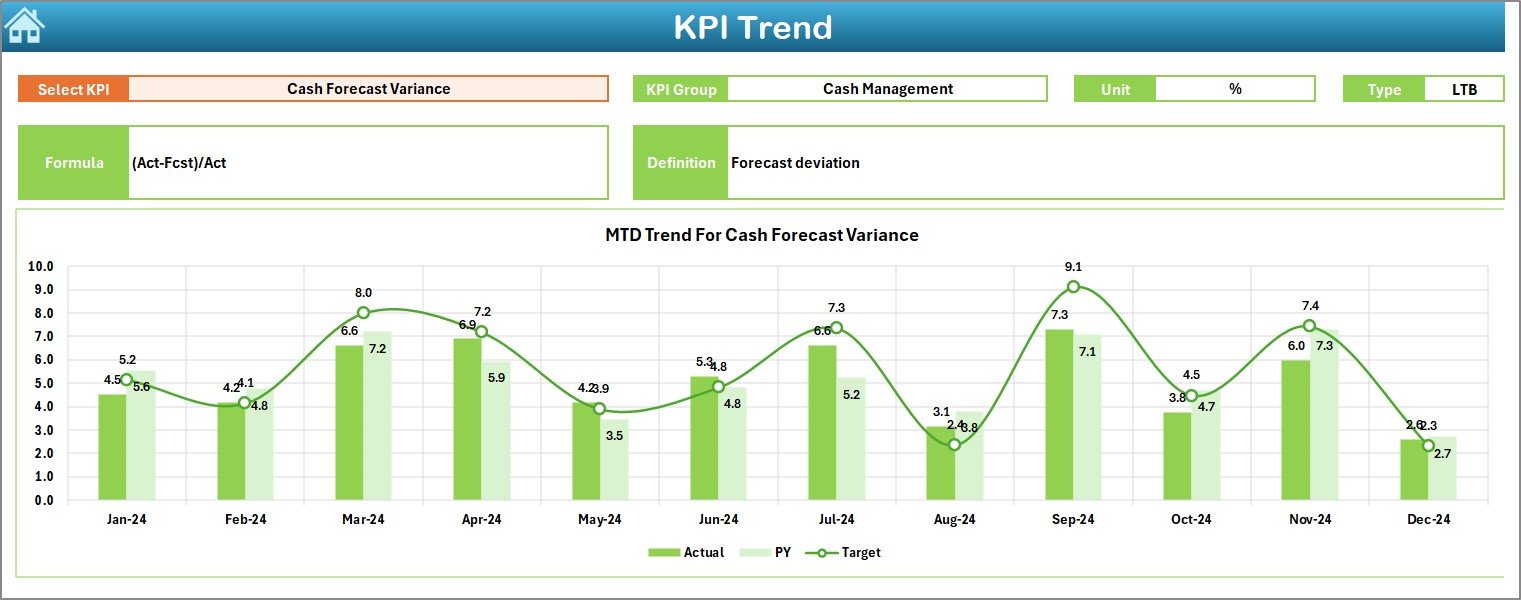
The KPI Trend Sheet focuses on performance behavior over time.
On this sheet:
-
You select a KPI Name from the drop-down at cell C3
-
Excel displays supporting KPI information such as:
-
KPI Group
-
KPI Unit
-
KPI Type (LTB or UTB)
-
KPI Formula
-
KPI Definition
-
Trend Charts on KPI Trend Sheet
The sheet also displays:
-
MTD Trend Chart
-
YTD Trend Chart
Each chart compares:
-
Actual values
-
Target values
-
Previous Year values
Because of this layout, treasury teams can easily spot trends, seasonality, and performance gaps.
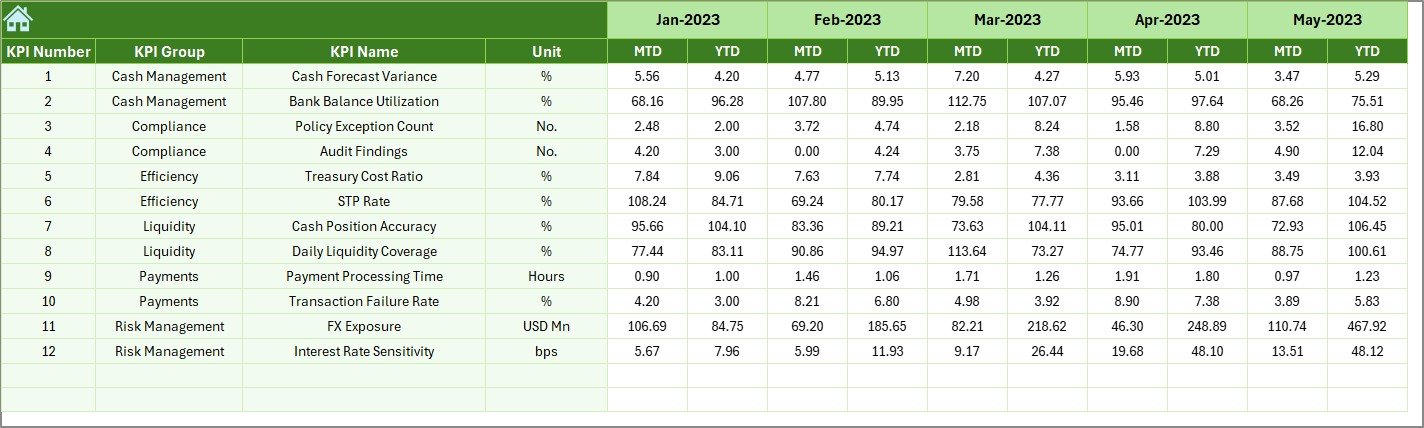
What Is the Actual Numbers Input Sheet?
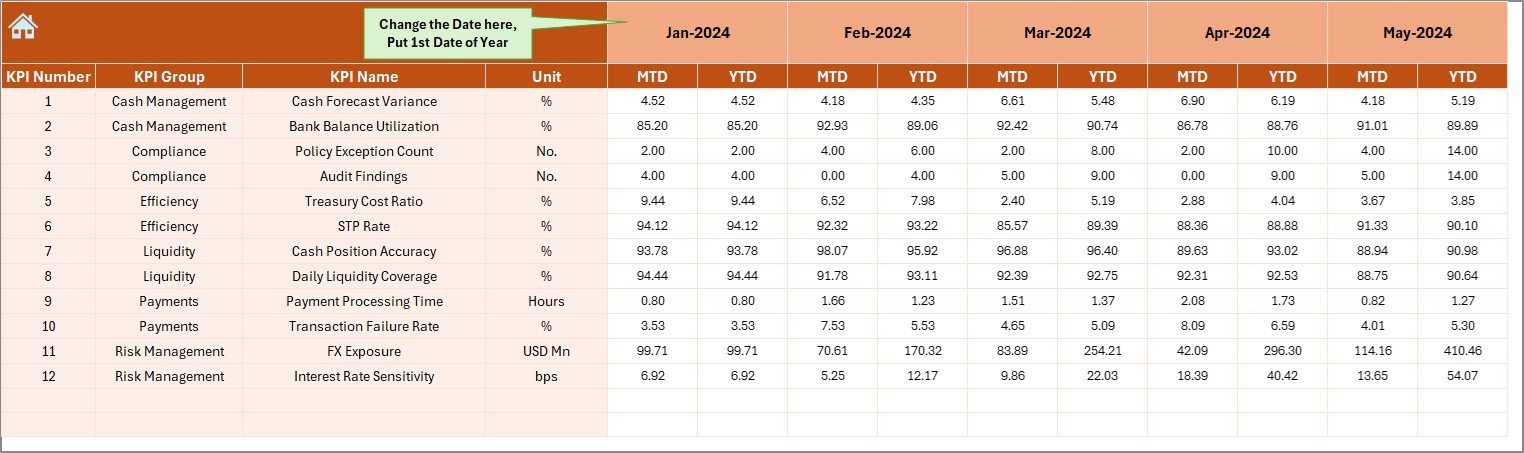
The Actual Numbers Input Sheet captures real performance data.
On this sheet:
-
You enter MTD and YTD actual values
-
You select the month using cell E1
-
You input only the first month date of the year
As soon as you update this sheet, the dashboard updates automatically.
Therefore, treasury teams avoid repetitive calculations and manual updates.
What Is the Target Sheet Used For?
The Target Sheet stores planned performance numbers.
On this sheet:
-
You enter MTD target values
-
You enter YTD target values
-
You assign targets for each KPI and month
Because targets remain separate from actuals, performance comparison becomes faster and more accurate.
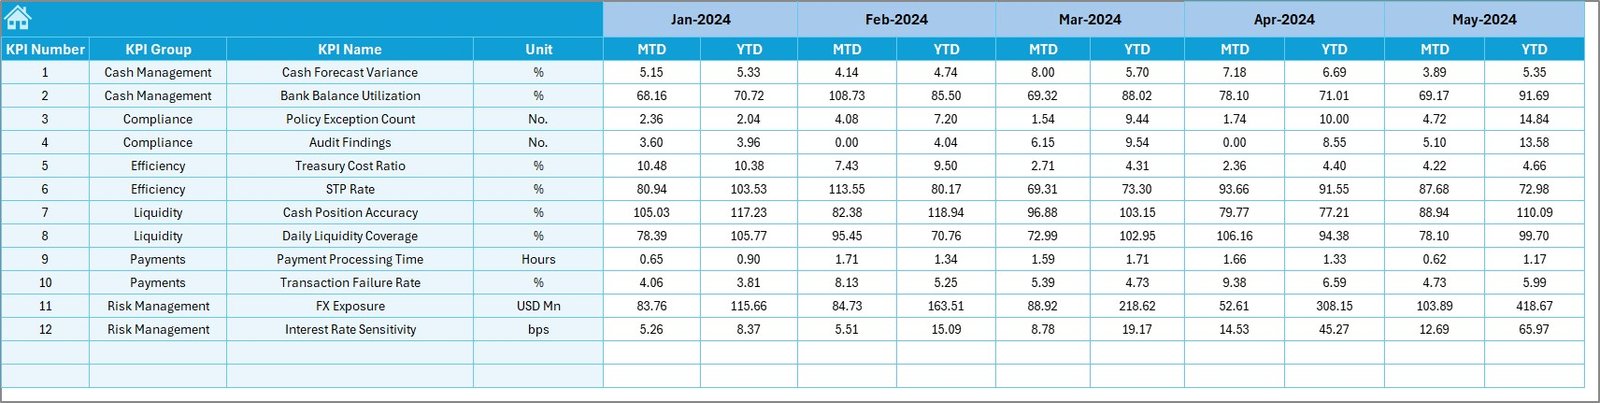
Why Is the Previous Year Number Sheet Important?
The Previous Year Number Sheet stores historical data.
On this sheet:
-
You enter previous year MTD numbers
-
You enter previous year YTD numbers
This structure allows the dashboard to:
-
Perform year-over-year comparisons
-
Measure growth or decline
-
Identify performance consistency
As a result, treasury teams gain long-term performance insights.
Click to Purchases Treasury Operations KPI Dashboard in Excel
What Does the KPI Definition Sheet Contain?
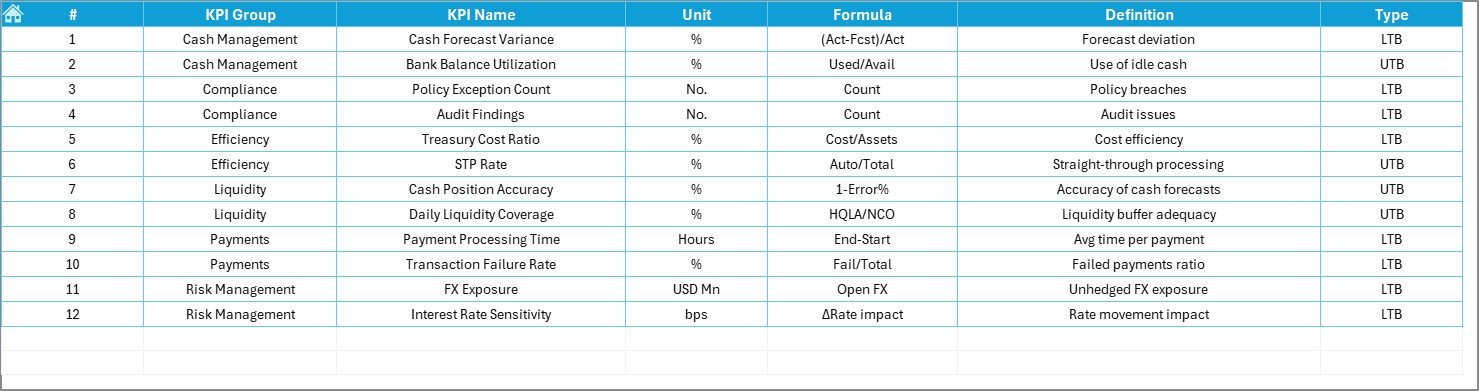
The KPI Definition Sheet acts as a master reference.
On this sheet, you enter:
-
KPI Name
-
KPI Group
-
KPI Unit
-
KPI Formula
-
KPI Definition
Because of this sheet:
-
All users interpret KPIs consistently
-
New team members understand KPIs quickly
-
KPI calculations remain transparent
Advantages of Treasury Operations KPI Dashboard in Excel
Using a Treasury Operations KPI Dashboard in Excel provides multiple benefits.
Key Advantages
✅ Centralized treasury performance monitoring
✅ Clear visibility of MTD and YTD performance
✅ Instant comparison of Actual, Target, and PY values
✅ Reduced manual reporting effort
✅ Improved liquidity and cash control
✅ Better forecasting and planning
✅ Faster decision-making
✅ Easy customization using Excel
Because of these advantages, treasury teams operate with greater confidence and accuracy.
Click to Purchases Treasury Operations KPI Dashboard in Excel
Best Practices for the Treasury Operations KPI Dashboard in Excel
To maximize dashboard effectiveness, treasury teams should follow best practices.
Best Practices
-
✅ Update actual data consistently every month
-
✅ Use standardized KPI names across all sheets
-
✅ Review and revise targets periodically
-
✅ Validate previous year data accuracy
-
✅ Focus on KPIs with negative trend indicators
-
✅ Use trend charts for forecasting discussions
-
✅ Train users on KPI definitions and formulas
-
✅ Protect formula cells to avoid errors
Following these practices ensures reliable and meaningful insights.
How Does This Dashboard Improve Treasury Decision-Making?
This dashboard helps treasury teams:
-
Monitor liquidity performance
-
Track funding efficiency
-
Control operational risks
-
Align treasury strategy with financial goals
-
Improve coordination between finance and leadership
As a result, organizations reduce financial uncertainty and improve treasury discipline.
Conclusion
The Treasury Operations KPI Dashboard in Excel transforms raw financial data into structured, actionable insights. Instead of working with disconnected sheets and reactive reports, treasury teams gain a single, reliable performance view.
Because this dashboard tracks MTD, YTD, targets, and previous year performance, it supports smarter decisions, better risk control, and stronger financial governance. Moreover, its Excel-based design keeps it flexible, affordable, and easy to maintain.
For any organization that wants better treasury visibility, efficiency, and control, this KPI dashboard becomes an essential management tool.
Click to Purchases Treasury Operations KPI Dashboard in Excel
Frequently Asked Questions (FAQs)
What is the main objective of a Treasury Operations KPI Dashboard in Excel?
The main objective is to track treasury performance using clear KPIs, targets, trends, and comparisons in Excel.
Can non-technical users operate this dashboard?
Yes. Anyone with basic Excel knowledge can use this dashboard easily.
How often should treasury data be updated?
You should update data monthly or whenever new treasury figures become available.
Can this dashboard handle multiple KPIs?
Yes. You can track multiple treasury KPIs by adding them to the KPI Definition and input sheets.
Does this dashboard support year-over-year analysis?
Yes. It compares current year data with previous year values for both MTD and YTD.
Can the dashboard be customized for specific organizations?
Yes. You can modify KPIs, targets, and structure to match business needs.
Click to Purchases Treasury Operations KPI Dashboard in Excel
Visit our YouTube channel to learn step-by-step video tutorials