Managing mining operations without a clear performance view feels risky and inefficient. Mining companies deal with high costs, safety risks, equipment downtime, and strict ESG requirements every day. Therefore, decision-makers need a simple, reliable, and data-driven way to track performance. That is exactly where a Mining Dashboard in Excel becomes essential.
In this detailed guide, you will learn what a Mining Dashboard in Excel is, why mining companies need it, how it works, and how each dashboard page supports better decisions. Moreover, you will explore its advantages, opportunities for improvement, best practices, and frequently asked questions. By the end of this article, you will clearly understand how a Mining Dashboard in Excel helps you control costs, improve productivity, and strengthen safety and sustainability—without complex software.
Click to buy Mining Dashboard in Excel
What Is a Mining Dashboard in Excel?
A Mining Dashboard in Excel is a ready-to-use, interactive reporting tool that tracks key mining performance indicators in one structured file. Instead of managing multiple spreadsheets, reports, and manual calculations, this dashboard consolidates all critical metrics into visual charts and KPIs.
Moreover, Excel dashboards remain flexible, familiar, and cost-effective. Mining managers, operations teams, finance teams, and safety officers can easily monitor performance without advanced technical skills. As a result, teams save time and focus more on actions rather than data preparation.
Why Do Mining Companies Need a Dashboard in Excel?
Mining operations involve multiple departments, mine sites, equipment types, and ore categories. Therefore, tracking performance manually often leads to delays, errors, and poor decisions. A Mining Dashboard in Excel solves these challenges by delivering clarity and control.
Key Reasons Mining Companies Use Excel Dashboards
- Centralize operational, financial, and safety data
- Monitor costs, revenue, and profit in real time
- Analyze production efficiency across sites and departments
- Identify downtime causes and equipment issues quickly
- Track ESG and safety performance with confidence
- Support faster and better management decisions
Because Excel supports charts, pivot tables, slicers, and formulas, mining dashboards stay powerful yet simple.
How Does a Mining Dashboard in Excel Work?
A Mining Dashboard in Excel works by pulling structured data into visual reports. First, raw data enters Excel tables. Then, pivot tables and formulas calculate KPIs. Finally, charts and graphs present insights clearly.
Moreover, users can filter data by mine site, department, ore type, equipment type, or company. As a result, decision-makers instantly view the information they need.
What Sheets Are Included in a Mining Dashboard in Excel?
A well-designed Mining Dashboard in Excel includes multiple sheet tabs, each focused on a specific performance area. Let us explore each section in detail.
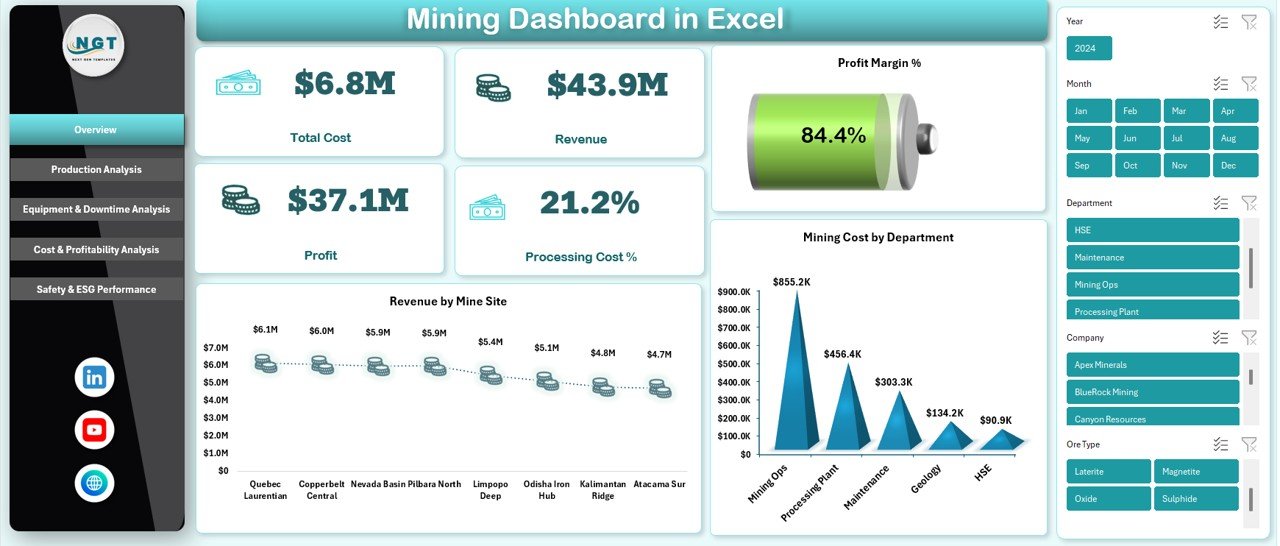
What Does the Overview Sheet Show in a Mining Dashboard in Excel?
The Overview Sheet provides a high-level snapshot of overall mining performance. It helps executives and managers quickly understand business health.
Key KPIs on the Overview Sheet
- Total Cost – Shows overall mining and processing expenses
- Revenue – Displays total revenue generated from mining activities
- Profit – Calculates revenue minus total cost
- Processing Cost % – Highlights processing efficiency
- Profit Margin % – Indicates overall profitability
Visual Analysis on the Overview Sheet
- Revenue by Mine Site – Compares revenue contribution across locations
- Mining Cost by Department – Identifies cost-heavy departments
Because this sheet summarizes critical numbers, managers use it for quick reviews and strategic discussions.
Click to buy Mining Dashboard in Excel
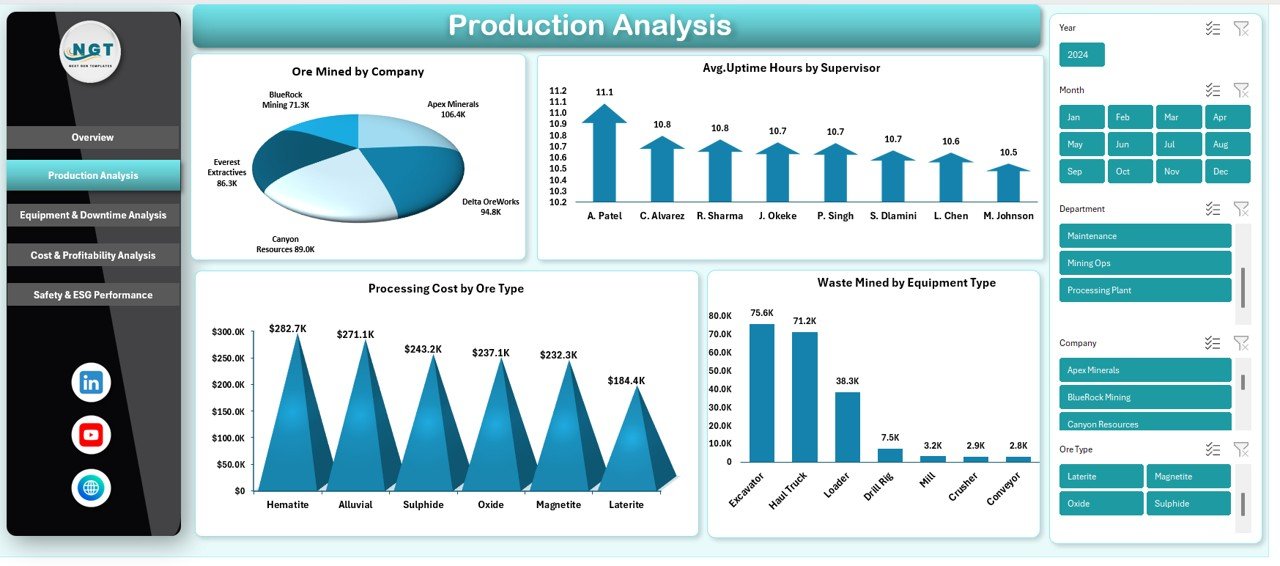
Production Analysis Sheet Improve
The Production Analysis sheet focuses on output, efficiency, and operational performance. It helps mining managers understand how effectively resources produce results.
Key Production Metrics Tracked
- Ore Mined by Company – Compares production levels across companies
- Average Uptime Hours by Supervisor – Measures supervisor effectiveness
- Processing Cost by Ore Type – Identifies cost differences by material
- Waste Mined by Equipment Type – Highlights waste generation patterns
Therefore, this sheet supports better planning, productivity improvements, and cost control.
Click to buy Mining Dashboard in Excel
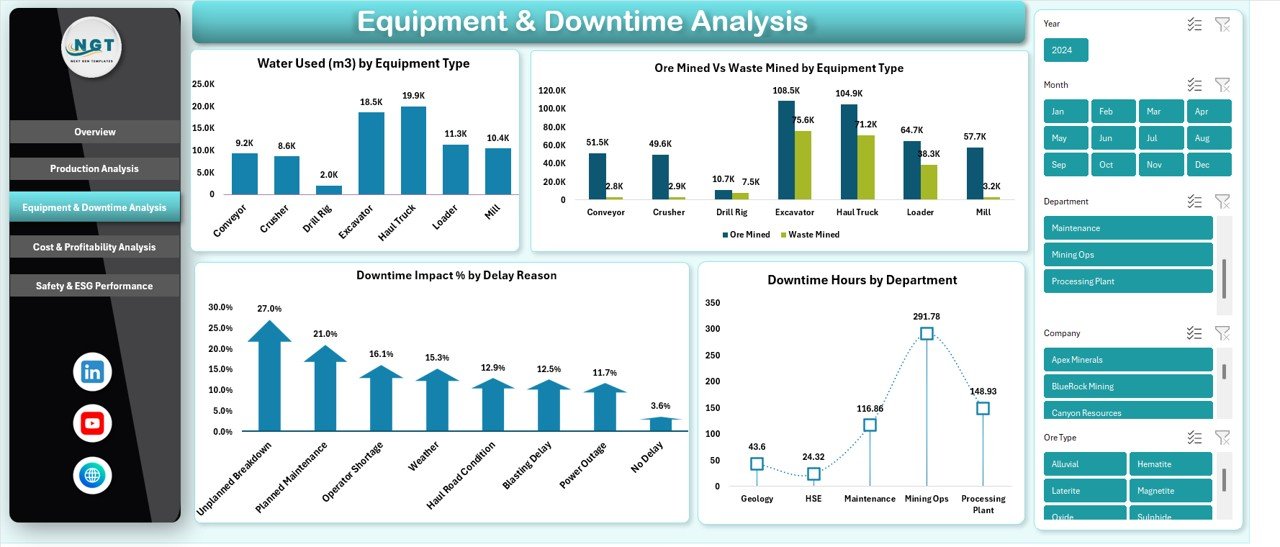
Equipment & Downtime Analysis Critical
Equipment downtime directly impacts productivity, cost, and safety. The Equipment & Downtime Analysis sheet provides deep insights into operational interruptions.
Key Equipment & Downtime KPIs
- Water Used (m³) by Equipment Type – Tracks resource consumption
- Ore Mined vs Waste Mined by Equipment Type – Measures equipment efficiency
- Downtime Impact % by Delay Reason – Identifies root causes of delays
- Downtime Hours by Department – Highlights operational bottlenecks
Because mining equipment remains expensive, this analysis helps extend asset life and reduce unplanned losses.
Click to buy Mining Dashboard in Excel
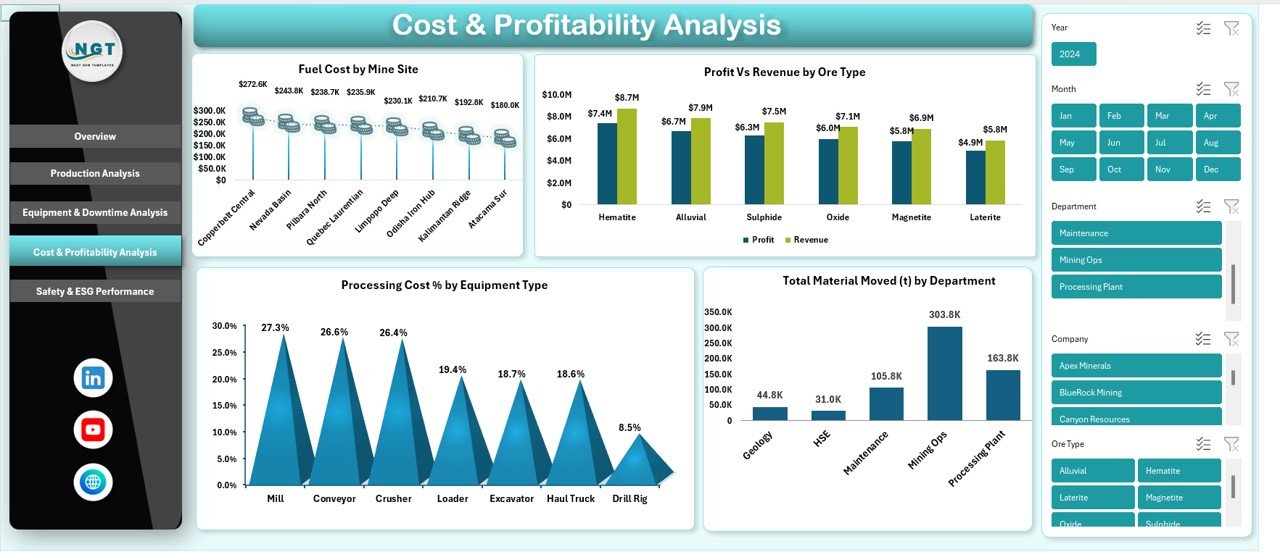
Cost & Profitability Analysis Sheet
The Cost & Profitability Analysis sheet connects operational data with financial outcomes. It helps finance teams and managers understand where profits grow or shrink.
Key Financial Metrics Tracked
- Fuel Cost by Mine Site – Monitors energy expenses
- Profit vs Revenue by Ore Type – Identifies high-margin materials
- Processing Cost % by Equipment Type – Measures processing efficiency
- Total Material Moved (t) by Department – Links cost to output
As a result, this sheet supports budgeting, pricing, and investment decisions.
Click to buy Mining Dashboard in Excel
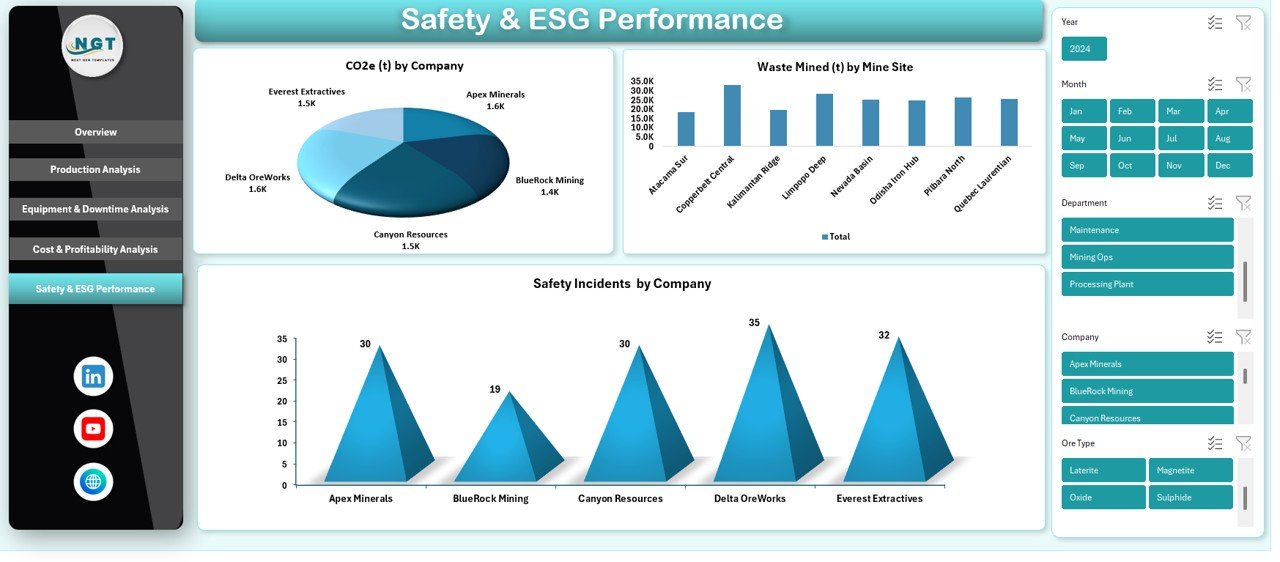
Safety & ESG Performance
Mining companies face strict environmental, social, and governance expectations. The Safety & ESG Performance sheet ensures transparency and accountability.
Key Safety & ESG Metrics
- CO₂e (t) by Company – Tracks carbon emissions
- Waste Mined (t) by Mine Site – Measures environmental impact
- Safety Incidents by Company – Monitors workplace safety
Therefore, this section helps companies meet compliance requirements and build trust with stakeholders.
Click to buy Mining Dashboard in Excel
Advantages of a Mining Dashboard in Excel
A Mining Dashboard in Excel offers several powerful advantages for mining organizations.
Key Advantages
- Centralized Reporting – All KPIs stay in one structured file
- Easy to Use – Excel requires no specialized training
- Cost-Effective – No expensive BI tools or licenses needed
- Customizable – Modify KPIs, charts, and layouts easily
- Faster Decisions – Visual insights support quick actions
- Improved Transparency – Teams access the same data view
Because of these benefits, many mining companies prefer Excel dashboards for daily and strategic reporting.
Opportunities for Improvement in a Mining Dashboard in Excel
Although Excel dashboards deliver strong value, continuous improvement enhances their effectiveness.
Areas for Improvement
- Automate data imports from source systems
- Add trend analysis for month-over-month tracking
- Introduce predictive KPIs for downtime and costs
- Expand ESG metrics for sustainability reporting
- Improve dashboard design for better readability
By improving these areas, mining dashboards become even more powerful decision-support tools.
Best Practices for the Mining Dashboard in Excel
Following best practices ensures accuracy, usability, and long-term success.
Best Practices to Follow
- Keep raw data separate from dashboard sheets
- Use consistent naming for KPIs and categories
- Validate data regularly to avoid errors
- Limit colors and focus on clarity
- Use slicers for easy filtering
- Protect formulas to prevent accidental changes
- Update data at fixed intervals
When teams follow these practices, dashboards remain reliable and scalable.
How Can a Mining Dashboard in Excel Improve Decision-Making?
A Mining Dashboard in Excel improves decisions by transforming raw data into insights. Managers quickly identify cost overruns, production gaps, and safety risks. Moreover, visual trends reveal patterns that tables alone cannot show.
Because the dashboard updates regularly, teams respond faster to issues. As a result, operations improve, costs reduce, and profitability increases.
Who Should Use a Mining Dashboard in Excel?
A Mining Dashboard in Excel supports multiple roles across the organization.
Ideal Users
- Mining Operations Managers
- Finance and Cost Controllers
- Maintenance and Equipment Teams
- Safety and ESG Officers
- Senior Management and Executives
Each role benefits from tailored insights within the same dashboard.
How Does Excel Compare to BI Tools for Mining Dashboards?
Although BI tools offer advanced analytics, Excel dashboards remain practical and flexible. Excel allows faster setup, easier customization, and lower costs. Moreover, many mining teams already rely on Excel daily.
Therefore, Excel dashboards work best for small to mid-sized operations or teams that value simplicity and control.
Conclusion: Why a Mining Dashboard in Excel Is a Smart Choice
A Mining Dashboard in Excel delivers clarity, control, and confidence in managing mining operations. It centralizes cost, production, equipment, and safety data into one powerful reporting tool. Moreover, it supports faster decisions, better cost control, and stronger ESG compliance.
Because Excel remains accessible and flexible, mining companies can scale and customize dashboards as their needs evolve. In short, a Mining Dashboard in Excel transforms complex mining data into actionable insights that drive performance and sustainability.
Frequently Asked Questions About Mining Dashboard in Excel
What is the main purpose of a Mining Dashboard in Excel?
The main purpose is to track, analyze, and visualize mining performance metrics such as cost, production, equipment efficiency, and safety in one place.
Can small mining companies use a Mining Dashboard in Excel?
Yes, small and mid-sized mining companies benefit greatly because Excel dashboards remain affordable and easy to manage.
How often should mining dashboard data be updated?
Teams should update data daily, weekly, or monthly depending on operational needs and reporting cycles.
Does a Mining Dashboard in Excel support ESG reporting?
Yes, it supports ESG metrics such as CO₂ emissions, waste mined, and safety incidents.
Do users need advanced Excel skills to use the dashboard?
No, basic Excel knowledge is enough because dashboards rely on clear visuals and simple interactions.
Can the dashboard handle multiple mine sites?
Yes, it can track and compare performance across multiple mine sites easily.
Is Excel secure for mining data?
Yes, users can protect sheets, restrict access, and secure sensitive formulas.
Visit our YouTube channel to learn step-by-step video tutorials
Watch the step-by-step video tutorial:
Click to buy Mining Dashboard in Excel