The medical equipment manufacturing industry demands precision, compliance, efficiency, and cost control at every stage. Manufacturers handle complex production processes, strict quality standards, expensive machinery, and time-sensitive deliveries. However, many organizations still rely on scattered spreadsheets, manual reports, and static files to track production performance. As a result, decision-making becomes slow, reactive, and risky.
That is exactly where a Medical Equipment Manufacturing Dashboard in Excel becomes a powerful solution.
In this in-depth article, you will learn what a Medical Equipment Manufacturing Dashboard in Excel is, why it is essential, how each dashboard page works, its advantages, best practices, and frequently asked questions. Moreover, this guide explains how Excel dashboards transform raw manufacturing data into clear, actionable insights without complex software or heavy IT investments.
What Is a Medical Equipment Manufacturing Dashboard in Excel?
Click to Purchases Medical Equipment Manufacturing Dashboard in Excel
A Medical Equipment Manufacturing Dashboard in Excel is a centralized, interactive reporting solution that tracks and visualizes key manufacturing metrics such as production units, production cost, defective units, downtime hours, and manufacturing time.
Instead of reviewing multiple sheets and manual calculations, manufacturers can monitor performance through visual charts, KPI cards, and slicers in one place. Because Excel supports pivot tables and pivot charts, this dashboard remains flexible, fast, and easy to maintain.
Most importantly, this dashboard supports data-driven decisions across production, quality, maintenance, and plant operations.
Why Do Medical Equipment Manufacturers Need a Dashboard in Excel?
Medical equipment manufacturing operates under high regulatory pressure and cost sensitivity. Therefore, organizations must monitor production metrics continuously.
Here is why this dashboard matters:
-
First, it improves production visibility across plants, shifts, and equipment.
-
Second, it helps identify cost leakages early.
-
Third, it supports quality improvement by tracking defective units.
-
Fourth, it reduces downtime through timely insights.
-
Finally, it enables faster decision-making without relying on IT teams.
Because Excel already exists in most organizations, this dashboard delivers value without additional software costs.
Key Features of the Medical Equipment Manufacturing Dashboard in Excel
This dashboard comes as a ready-to-use Excel file designed specifically for manufacturing analysis. Moreover, it focuses on pivot-based analysis, which ensures flexibility and scalability.
Page Navigator for Easy Access
The Page Navigator, located on the left side, allows users to switch instantly between dashboard pages. As a result, users save time and maintain analytical flow while reviewing data.
Right-Side Slicers for Dynamic Filtering
Each dashboard page includes right-side slicers. These slicers allow filtering by region, plant, equipment category, product name, and month. Consequently, users can drill down into specific insights without editing formulas.
How Does the Overview Page of the Medical Equipment Manufacturing Dashboard Work?
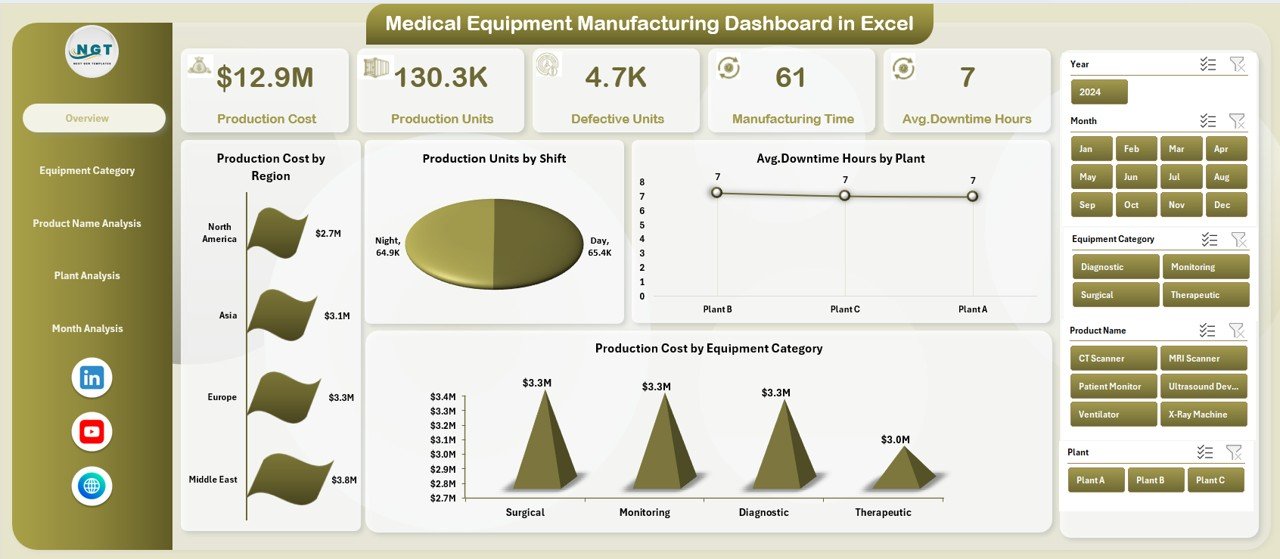
The Overview Page acts as the command center of the dashboard. It provides a quick snapshot of overall manufacturing performance.
Key Components of the Overview Page
KPI Cards
-
Total Production Cost
-
Total Production Units
-
Average Downtime Hours
-
Overall Manufacturing Time
Charts Included
-
Production Cost by Region
-
Production Units by Shift
-
Average Downtime Hours by Plant
-
Production Cost by Equipment Category
Why the Overview Page Matters
Because leaders need quick answers, this page delivers high-level insights at a glance. Moreover, it helps identify problem areas before diving deeper into detailed pages.
What Insights Does the Equipment Category Analysis Page Provide?
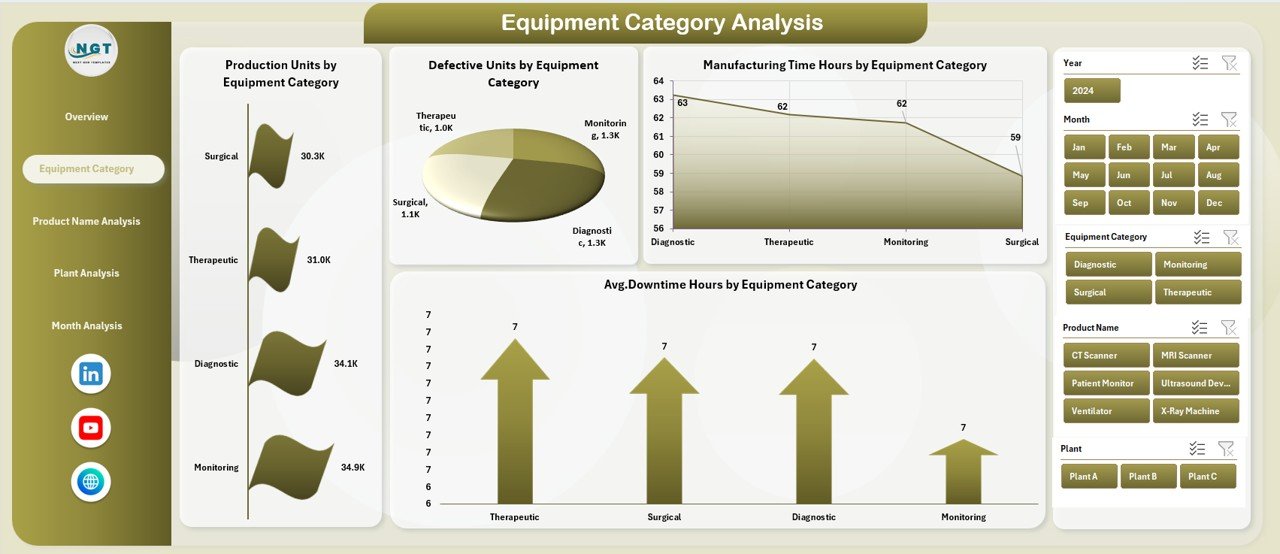
The Equipment Category Analysis Page focuses on understanding how different types of equipment perform.
Charts on This Page
-
Production Units by Equipment Category
-
Defective Units by Equipment Category
-
Manufacturing Time by Equipment Category
-
Average Downtime Hours by Equipment Category
Business Value of Equipment Category Analysis
This page helps manufacturers:
-
Compare productivity across equipment categories
-
Identify machines causing frequent downtime
-
Reduce defects by improving equipment maintenance
-
Optimize equipment utilization
As a result, organizations can prioritize maintenance schedules and capital investments effectively.
Click to Purchases Medical Equipment Manufacturing Dashboard in Excel
How Does the Product Name Analysis Page Improve Decision-Making?
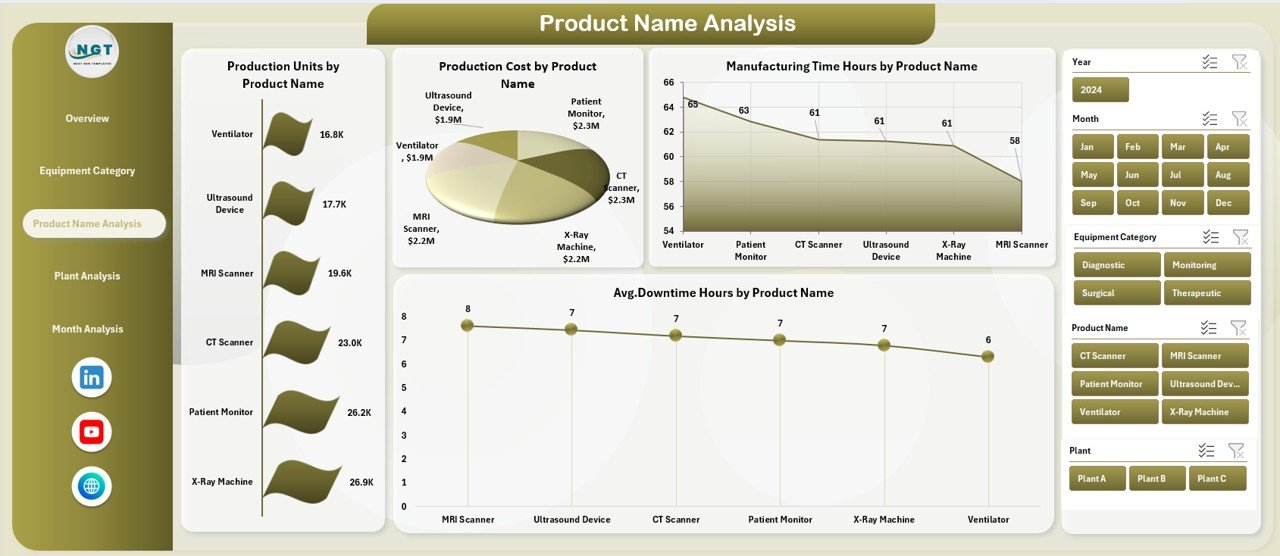
Medical equipment manufacturers often produce multiple products with different complexities. Therefore, product-level analysis becomes critical.
Charts on the Product Name Analysis Page
-
Production Units by Product Name
-
Production Cost by Product Name
-
Manufacturing Time Hours by Product Name
-
Average Downtime Hours by Product Name
Why Product-Level Analysis Is Important
This page helps manufacturers:
-
Identify high-cost products
-
Compare production efficiency across products
-
Optimize product mix
-
Improve pricing strategies
Consequently, businesses can align production with profitability goals.
Why Is Plant Analysis Crucial in Medical Equipment Manufacturing?
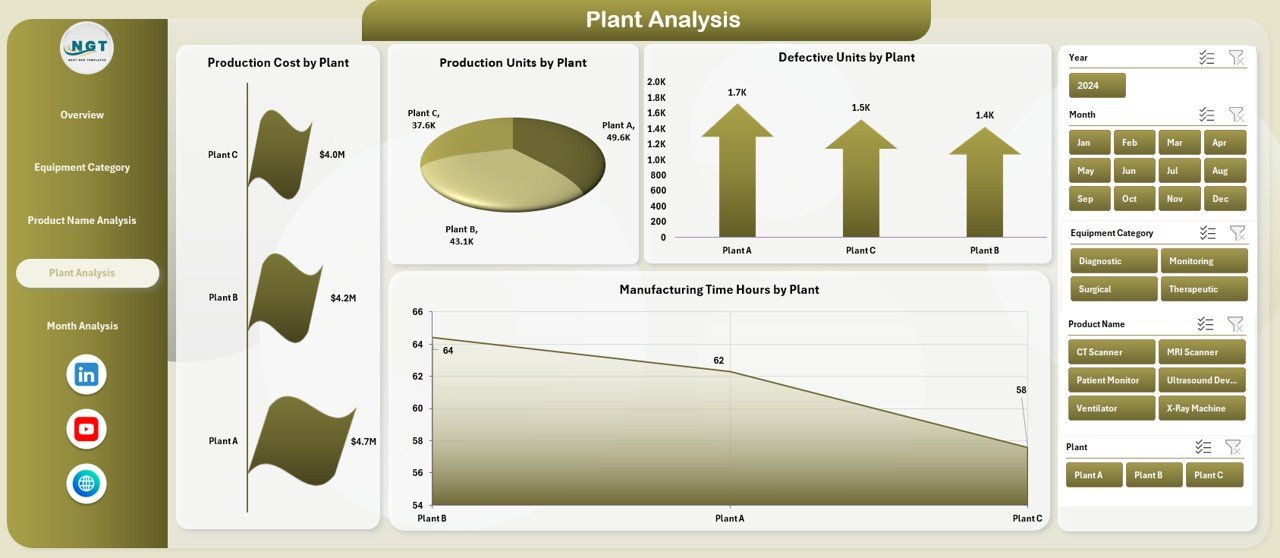
Different plants operate under different conditions, workforce skills, and machine setups. Hence, plant-wise analysis becomes essential.
Charts on the Plant Analysis Page
-
Production Cost by Plant
-
Production Units by Plant
-
Defective Units by Plant
-
Manufacturing Time Hours by Plant
How Plant Analysis Helps Operations
This analysis allows management to:
-
Benchmark plant performance
-
Identify underperforming facilities
-
Improve quality control
-
Allocate resources efficiently
As a result, companies improve operational consistency across locations.
What Does the Month Analysis Page Reveal?
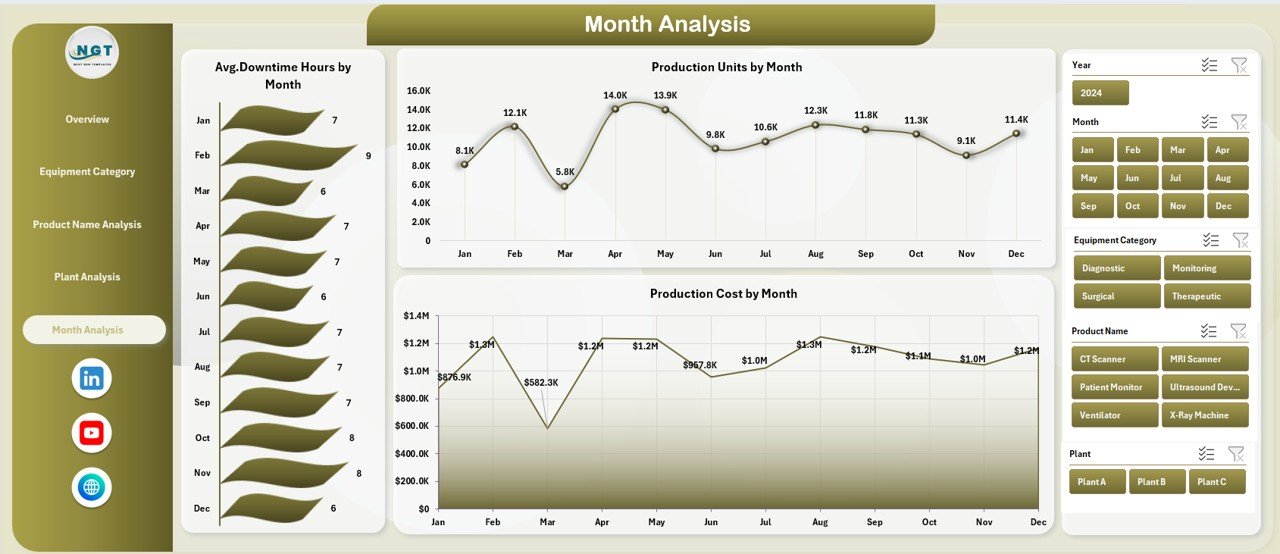
Manufacturing performance changes over time due to demand cycles, maintenance schedules, and workforce availability.
Charts on the Month Analysis Page
-
Average Downtime Hours by Month
-
Production Units by Month
-
Production Cost by Month
Benefits of Monthly Trend Analysis
This page helps organizations:
-
Track seasonal trends
-
Forecast production capacity
-
Identify cost spikes
-
Plan preventive maintenance
Therefore, monthly analysis supports proactive planning instead of reactive firefighting.
What Role Do the Data and Support Sheets Play?
Data Sheet
The Data Sheet acts as the backbone of the dashboard. It stores all transactional manufacturing data such as:
-
Date
-
Plant
-
Region
-
Shift
-
Equipment Category
-
Product Name
-
Production Units
-
Defective Units
-
Production Cost
-
Manufacturing Time
-
Downtime Hours
Because pivot tables source data from this sheet, users can update data easily without breaking visuals.
Support Sheet
The Support Sheet contains helper tables, lookup values, and calculated fields. As a result, it ensures consistent logic across all dashboard pages.
Advantages of Medical Equipment Manufacturing Dashboard in Excel
Click to Purchases Medical Equipment Manufacturing Dashboard in Excel
1. Centralized Manufacturing Insights
The dashboard consolidates production, cost, downtime, and quality data into a single view. Therefore, teams no longer waste time switching between files.
2. Cost-Effective Analytics Solution
Because the dashboard runs on Excel, it eliminates the need for expensive BI tools. Hence, even small manufacturers can adopt data analytics.
3. Faster Decision-Making
Interactive slicers and visuals allow instant analysis. As a result, managers respond quickly to issues.
4. Improved Quality Control
Tracking defective units by plant, product, and equipment helps reduce quality issues proactively.
5. Enhanced Operational Efficiency
By monitoring downtime and manufacturing time, organizations can streamline processes and improve throughput.
6. Scalability and Flexibility
The dashboard grows with your data. Simply refresh pivot tables after adding new records.
Opportunities for Improvement Using This Dashboard
Although the dashboard provides strong insights, manufacturers can enhance it further.
-
Add target vs actual comparisons for KPIs
-
Introduce MTD and YTD metrics
-
Integrate maintenance schedules
-
Include supplier quality metrics
-
Add conditional formatting alerts
These improvements further strengthen decision-making capabilities.
Best Practices for the Medical Equipment Manufacturing Dashboard in Excel
1. Maintain Clean and Structured Data
Always ensure the data sheet follows a consistent structure. Clean data improves accuracy and performance.
2. Use Standardized Naming Conventions
Standard names for plants, equipment, and products avoid duplication and errors.
3. Refresh Pivot Tables Regularly
Always refresh pivot tables after updating data to maintain accuracy.
4. Limit Over-Customization
Keep visuals simple and consistent. Too many colors or charts reduce clarity.
5. Train Users on Dashboard Usage
Educate users on slicers, filters, and interpretation of charts. Better understanding leads to better decisions.
6. Protect Critical Sheets
Lock support sheets and formulas to prevent accidental changes.
How Does This Dashboard Support Regulatory Compliance?
Medical equipment manufacturing requires strict compliance with quality and production standards. This dashboard helps by:
-
Tracking defects systematically
-
Maintaining historical production records
-
Supporting audit readiness
-
Improving documentation accuracy
As a result, organizations reduce compliance risks.
Who Should Use the Medical Equipment Manufacturing Dashboard in Excel?
This dashboard benefits:
-
Production Managers
-
Plant Managers
-
Quality Assurance Teams
-
Operations Heads
-
Manufacturing Analysts
-
Business Owners
Because Excel remains familiar, adoption becomes quick and smooth.
How Does This Dashboard Compare to Traditional Reports?
Traditional reports remain static and time-consuming. In contrast:
-
This dashboard updates dynamically
-
It supports drill-down analysis
-
It saves manual reporting hours
-
It improves collaboration
Therefore, dashboards outperform static reports significantly.
Conclusion
The Medical Equipment Manufacturing Dashboard in Excel transforms complex manufacturing data into clear, actionable insights. It helps organizations monitor production efficiency, control costs, reduce downtime, and improve quality—all within a familiar Excel environment.
By using interactive visuals, pivot charts, and slicers, manufacturers gain full visibility across plants, products, equipment, and time periods. Moreover, the dashboard supports faster decisions, better planning, and continuous improvement.
In today’s competitive and regulated manufacturing environment, relying on manual reports no longer works. Instead, this Excel dashboard empowers manufacturers to operate smarter, faster, and more efficiently.
Frequently Asked Questions (FAQs)
What is a Medical Equipment Manufacturing Dashboard in Excel?
It is an interactive Excel-based dashboard that tracks production, cost, downtime, defects, and manufacturing time using pivot charts and slicers.
Can this dashboard handle large datasets?
Yes, Excel pivot tables can handle thousands of records efficiently when data stays well-structured.
Do I need advanced Excel skills to use this dashboard?
No. Basic knowledge of filters and pivot tables is enough to use and maintain the dashboard.
Can I customize the dashboard for my organization?
Yes, you can add new KPIs, charts, or slicers based on your business needs.
Is this dashboard suitable for multiple plants?
Yes, the plant analysis page supports multi-plant manufacturing environments.
Does this dashboard support monthly and trend analysis?
Yes, the month analysis page tracks trends in production units, cost, and downtime.
Can I integrate this dashboard with other systems?
Yes, you can import data from ERP or MES systems into Excel for analysis.
Click to Purchases Medical Equipment Manufacturing Dashboard in Excel
Visit our YouTube channel to learn step-by-step video tutorials
Watch the step-by-step video tutorial: