Managing a furniture retail business involves more than selling sofas, beds, and dining tables. Today, retailers must track sales, profits, discounts, inventory, stores, regions, and seasonal trends in real time. However, when teams rely on scattered spreadsheets or manual reports, they often miss key insights.
That is exactly where a Furniture Retail Dashboard in Excel becomes extremely valuable.
In this in-depth article, you will learn what a Furniture Retail Dashboard in Excel is, why it matters, how it works, and how each dashboard page supports better decision-making. Moreover, you will explore its advantages, best practices, and frequently asked questions. By the end, you will clearly understand how this ready-to-use Excel dashboard helps furniture retailers improve performance, profitability, and operational control.
Click to Purchases Furniture Retail Dashboard in Excel
What Is a Furniture Retail Dashboard in Excel?
A Furniture Retail Dashboard in Excel is an interactive and visual reporting tool designed to analyze and monitor key performance metrics across a furniture retail business.
Instead of reviewing multiple files, static reports, or raw data tables, this dashboard consolidates all important information into one structured Excel file. As a result, business owners, store managers, sales teams, and analysts gain instant visibility into performance.
This dashboard typically tracks:
-
Net sales amount
-
Profit amount
-
Discount percentage
-
Cost amount
-
Quantity sold
-
Performance by salesperson, product category, store, region, and month
Because the dashboard uses Excel, users can easily update data, apply filters, and customize views without technical expertise.
Why Do Furniture Retailers Need a Dashboard in Excel?
Furniture retail operations generate large volumes of transactional data every day. However, raw data alone does not support smart decisions. Therefore, retailers need a system that converts data into insights.
A Furniture Retail Dashboard in Excel solves this problem effectively.
Key Reasons Retailers Use This Dashboard
-
Because it centralizes sales and profitability data
-
Because it highlights high-performing and underperforming areas
-
Because it simplifies monthly and regional analysis
-
Because it improves discount and cost control
-
Because it supports faster and more confident decisions
As a result, retailers move from reactive reporting to proactive performance management.
What Are the Key Features of the Furniture Retail Dashboard in Excel?
This ready-to-use Furniture Retail Dashboard in Excel includes multiple analytical pages, slicers, charts, and structured data sheets. Each feature focuses on clarity, usability, and business relevance.
Let us explore them in detail.
How Does the Page Navigator Improve Dashboard Usability?
The Page Navigator, located on the left side of the dashboard, allows users to move quickly between analytical pages.
Instead of scrolling through sheets or searching manually, users can jump directly to the required view with one click. Consequently, navigation becomes smooth and professional.
Benefits of Page Navigator
-
Saves time during analysis
-
Improves user experience
-
Makes the dashboard presentation-ready
-
Supports non-technical users
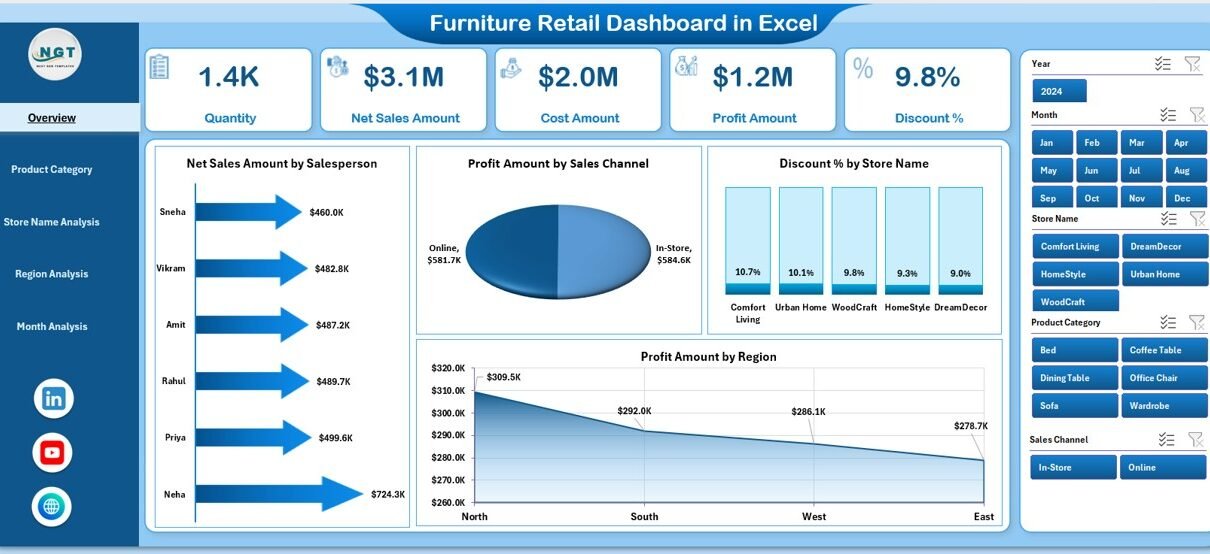
What Does the Overview Page Show in the Furniture Retail Dashboard?
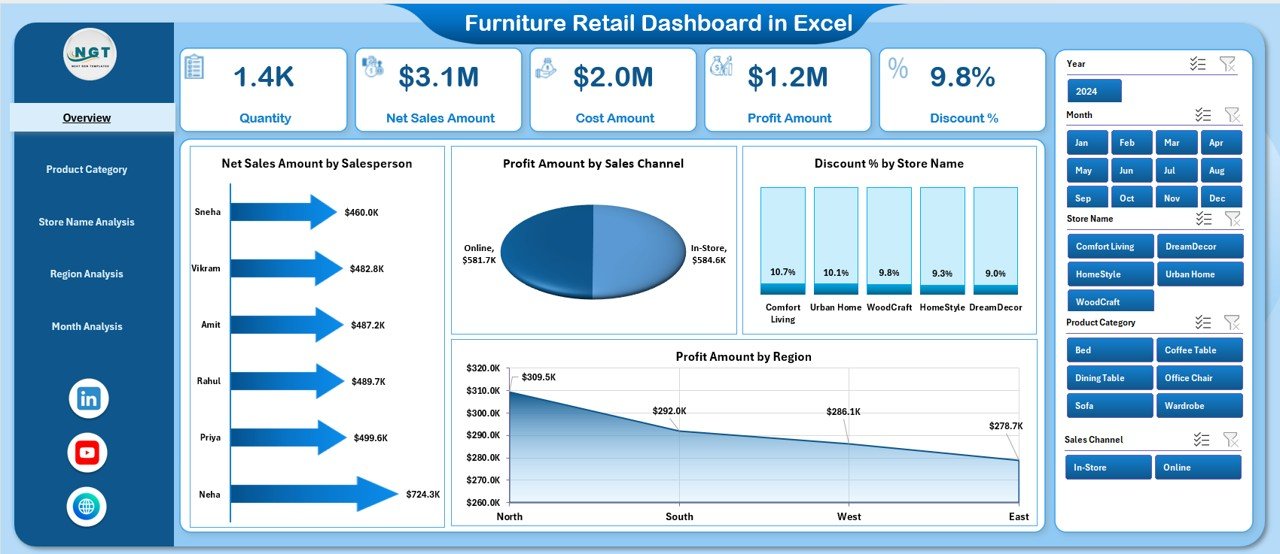
The Overview Page serves as the central summary of the entire furniture retail operation. Because decision-makers often start here, this page focuses on high-level insights.
Key Elements of the Overview Page
-
Right-side slicer for dynamic filtering
-
Four KPI cards for quick performance snapshot
-
Four visual charts for multi-dimensional analysis
Charts Included on the Overview Page
-
Net Sales Amount by Salesperson
-
Profit Amount by Sales Channel
-
Discount % by Store Name
-
Profit Amount by Region
Because these visuals update instantly based on slicer selection, users can analyze performance by month, store, or region within seconds.
How Does Product Category Analysis Help Furniture Retailers?
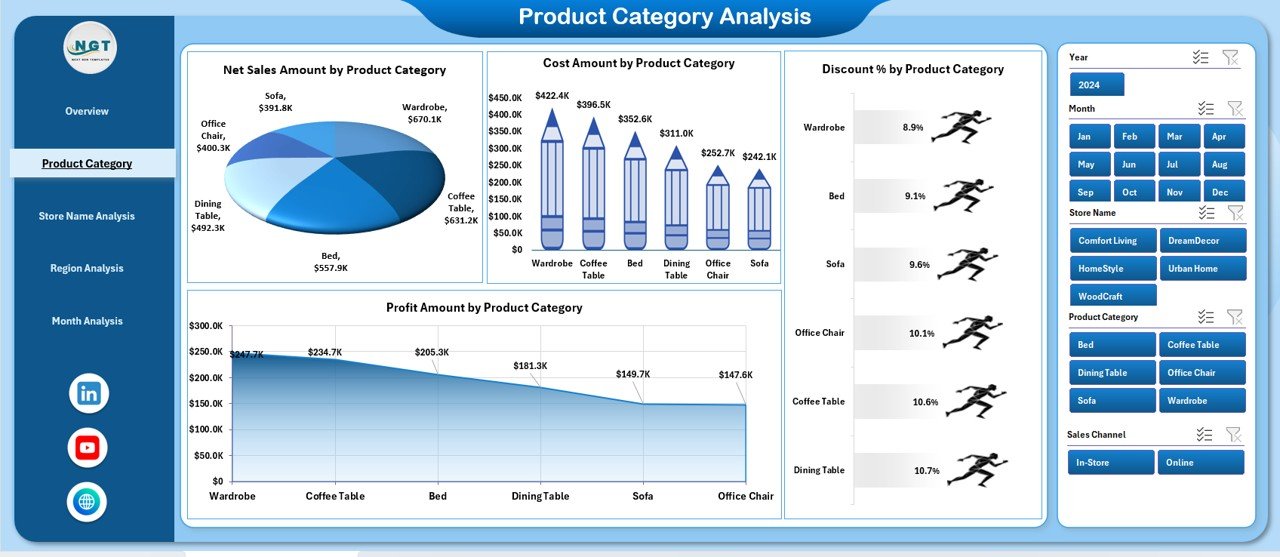
Product mix plays a crucial role in furniture retail success. Therefore, the Product Category Analysis Page focuses on understanding category-level performance.
Key Features of Product Category Analysis
-
Right-side slicer for flexible filtering
-
Four focused charts for category insights
Charts on Product Category Analysis Page
-
Net Sales Amount by Product Category
-
Profit Amount by Product Category
-
Discount % by Product Category
-
Cost Amount by Product Category
As a result, retailers can quickly identify:
-
Best-selling product categories
-
Low-margin product lines
-
Over-discounted categories
-
Cost-heavy segments
Why Is Store Name Analysis Important in Furniture Retail?
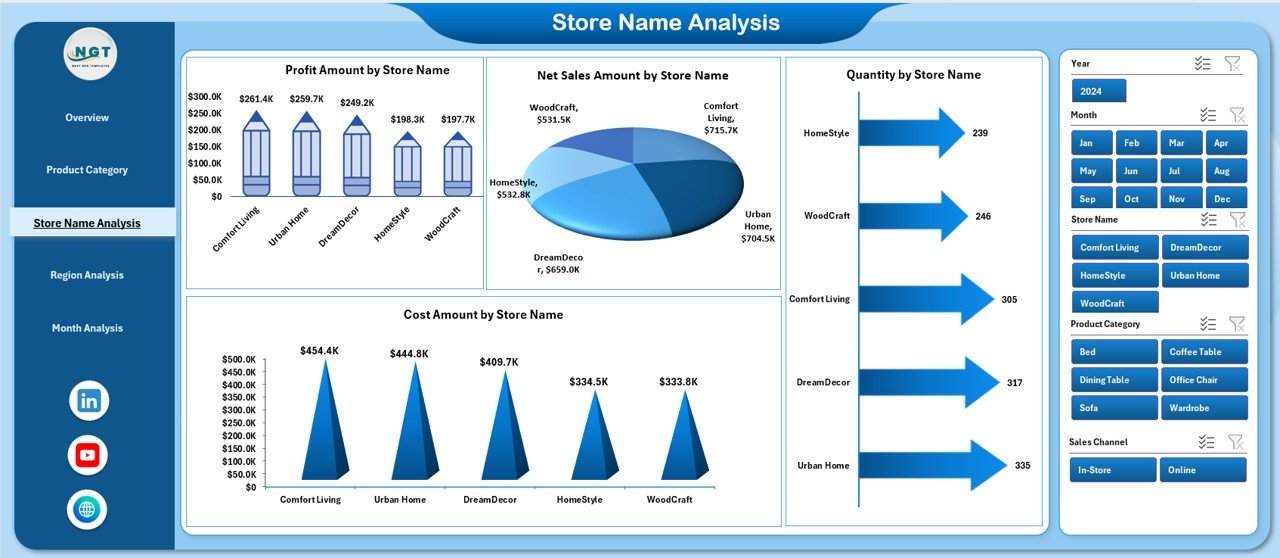
Furniture retailers often operate across multiple stores. Therefore, comparing store-level performance becomes essential.
The Store Name Analysis Page helps managers evaluate how each store performs in terms of sales, profitability, volume, and cost.
Key Features of Store Name Analysis
-
Right-side slicer for store comparison
-
Four operational performance charts
Charts on Store Name Analysis Page
-
Net Sales Amount by Store Name
-
Profit Amount by Store Name
-
Quantity by Store Name
-
Cost Amount by Store Name
Because of this structure, retailers can:
-
Identify top-performing stores
-
Spot underperforming locations
-
Optimize inventory allocation
-
Improve store-level strategies
-
Click to Purchases Furniture Retail Dashboard in Excel
How Does Region Analysis Support Strategic Expansion?

Regional performance varies based on demand, pricing, and customer behavior. Therefore, the Region Analysis Page provides location-based insights.
Key Features of Region Analysis
-
Right-side slicer for region selection
-
Four charts focused on regional metrics
Charts on Region Analysis Page
-
Net Sales Amount by Region
-
Discount % by Region
-
Quantity by Region
-
Cost Amount by Region
With this page, management can:
-
Compare regions effectively
-
Identify high-growth markets
-
Control discount leakage
-
Plan regional promotions
What Insights Does the Month Analysis Page Provide?
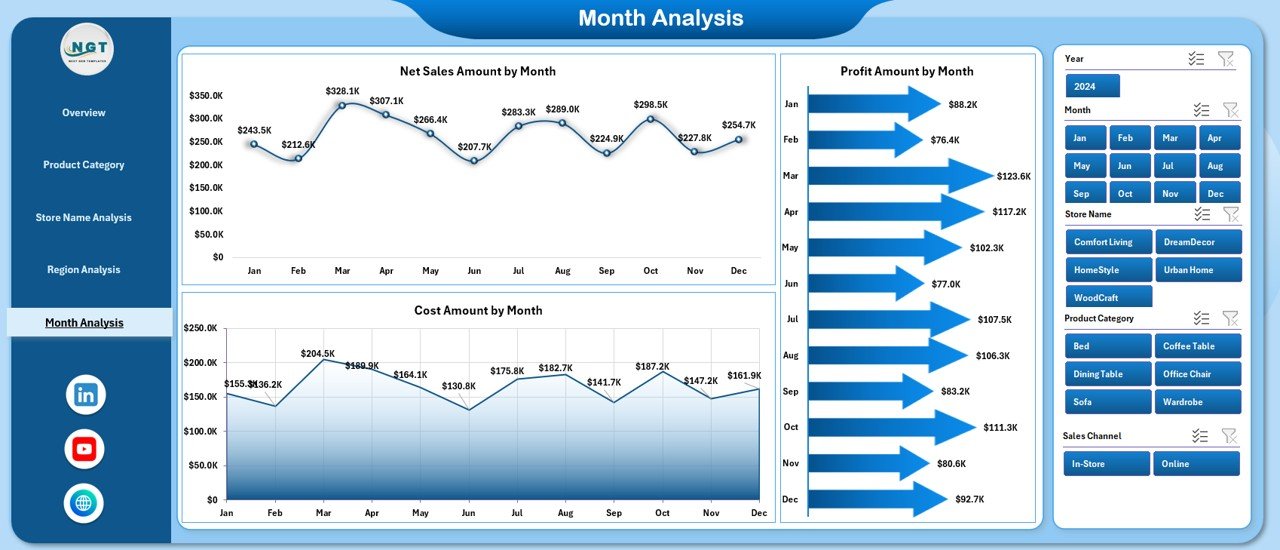
Seasonality plays a major role in furniture sales. Therefore, the Month Analysis Page tracks performance trends over time.
Key Features of Month Analysis
-
Right-side slicer for time selection
-
Trend-focused charts
Charts on Month Analysis Page
-
Net Sales Amount by Month
-
Profit Amount by Month
-
Cost Amount by Month
As a result, retailers can:
-
Identify peak and slow months
-
Track profitability trends
-
Plan inventory and promotions
-
Forecast future performance
What Is the Role of the Data Sheet in the Dashboard?
Click to Purchases Furniture Retail Dashboard in Excel
The Data Sheet acts as the foundation of the dashboard. All visuals and calculations depend on this structured dataset.
Key Benefits of Data Sheet
-
Centralized data storage
-
Easy data refresh
-
Clean and structured format
-
Compatible with pivot tables and charts
Because users update only the data sheet, the dashboard refreshes automatically.
How Does the Support Sheet Improve Dashboard Functionality?
The Support Sheet stores helper tables, lookup values, and background calculations.
Why the Support Sheet Matters
-
Keeps the main dashboard clean
-
Improves performance
-
Supports slicers and formulas
-
Enables scalability
As a result, the dashboard remains robust and easy to maintain.
Advantages of Furniture Retail Dashboard in Excel
A Furniture Retail Dashboard in Excel delivers several business and operational advantages.
Key Advantages
-
✅ Centralized sales and profit tracking
-
✅ Real-time performance visibility
-
✅ Easy-to-use Excel interface
-
✅ No advanced tools required
-
✅ Faster and better decision-making
-
✅ Improved discount and cost control
-
✅ Professional reporting format
Because of these advantages, retailers gain better control over their business.
Best Practices for the Furniture Retail Dashboard in Excel
To maximize the value of your dashboard, follow these best practices consistently.
1. Maintain Clean and Accurate Data
Always validate data before updating the data sheet. Clean data ensures reliable insights.
2. Use Slicers Strategically
Apply slicers to focus analysis on specific months, regions, or stores.
3. Review Dashboard Regularly
Schedule weekly or monthly reviews to track trends and act early.
4. Avoid Overloading with Charts
Keep visuals simple and relevant. Focus on insights, not decoration.
5. Train Users Properly
Ensure managers and analysts understand how to use slicers and interpret visuals.
How Does This Dashboard Improve Decision-Making?
This dashboard transforms raw data into actionable insights. Because information appears visually and dynamically, decision-makers respond faster and with confidence.
As a result, businesses improve profitability, reduce costs, and optimize operations.
Conclusion
A Furniture Retail Dashboard in Excel is not just a reporting tool. Instead, it acts as a strategic decision-support system for modern furniture retailers.
With structured pages, dynamic slicers, clear charts, and centralized data, this ready-to-use dashboard simplifies complex analysis. Moreover, it empowers business owners and managers to track performance, identify risks, and seize opportunities quickly.
If you want clarity, control, and confidence in your furniture retail operations, this Excel dashboard becomes an essential solution.
Frequently Asked Questions (FAQs)
What Is a Furniture Retail Dashboard in Excel Used For?
It tracks sales, profit, discounts, cost, quantity, and performance across stores, regions, products, and time.
Can Beginners Use This Dashboard Easily?
Yes. Because it uses Excel with slicers and charts, beginners can use it comfortably.
Do I Need Advanced Excel Skills to Use It?
No. You only need basic Excel knowledge to update data and use slicers.
Can I Customize the Dashboard?
Yes. You can add charts, KPIs, or pages based on your business needs.
How Often Should I Update the Data Sheet?
You should update it daily, weekly, or monthly depending on your reporting cycle.
Does This Dashboard Support Multiple Stores and Regions?
Yes. It supports multi-store and multi-region analysis effectively.
Visit our YouTube channel to learn step-by-step video tutorials