Managing intellectual property effectively has become a strategic priority for modern organizations. However, tracking patents, trademarks, copyrights, licensing performance, and legal timelines often becomes difficult when data stays scattered across files and teams. Because of this challenge, organizations need a structured and visual way to monitor IP performance.
That is exactly where an Intellectual Property (IP) KPI Dashboard in Excel becomes a powerful solution.
In this detailed guide, you will learn what an IP KPI Dashboard in Excel is, why organizations need it, how it works, and how each worksheet supports structured IP performance monitoring. Moreover, this article explains the advantages, best practices, and frequently asked questions so you can use this dashboard confidently in real-world scenarios.
Click to Purchases Intellectual Property (IP) KPI Dashboard in Excel
What Is an Intellectual Property (IP) KPI Dashboard in Excel?
An Intellectual Property (IP) KPI Dashboard in Excel is a ready-to-use performance tracking tool designed to monitor key IP metrics such as patent filings, approvals, renewals, costs, timelines, and compliance.
Instead of reviewing long reports or manually compiling data, this dashboard converts IP data into:
-
Monthly and yearly KPI views
-
Target vs Actual comparisons
-
Previous Year benchmarking
-
Trend charts for better insights
-
Clear performance indicators using arrows and colors
Because the dashboard runs entirely in Excel, it offers flexibility, familiarity, and full control without the need for complex software.
Why Do Organizations Need an IP KPI Dashboard?
Intellectual property teams manage sensitive and high-value assets. However, without structured tracking, teams face delays, missed deadlines, and poor visibility.
Therefore, an IP KPI Dashboard becomes essential because it helps organizations:
-
Track IP performance in one centralized view
-
Monitor MTD and YTD progress easily
-
Compare targets with actual results
-
Identify risks early using visual indicators
-
Improve decision-making with trends and history
As a result, legal teams, R&D departments, and management gain clarity and confidence in IP operations.
What KPIs Can You Track Using an IP KPI Dashboard?
Although KPIs may vary by organization, this dashboard supports tracking common IP performance indicators such as:
-
Patent Applications Filed
-
Patents Granted
-
Trademark Registrations
-
IP Renewal Compliance Rate
-
Average Filing Time
-
IP Legal Cost per Asset
-
Licensing Revenue Performance
-
Pending IP Cases
-
Rejected Applications Ratio
Because the dashboard allows custom KPI definitions, organizations can tailor it to their IP strategy easily.
How Does the Intellectual Property (IP) KPI Dashboard in Excel Work?
This IP KPI Dashboard is a ready-to-use Excel template designed with structured worksheets and dynamic formulas. Once you enter actual, target, and previous year data, the dashboard automatically updates visuals and comparisons.
Let us now understand each worksheet in detail.
What Is the Purpose of the Home Sheet?
1. Home Sheet (Index Sheet)
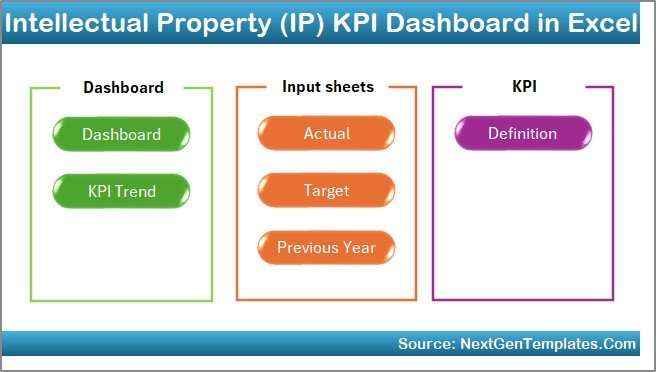
The Home Sheet works as the navigation center of the dashboard.
On this sheet, you will find:
-
A clean index layout
-
Six navigation buttons
-
One-click access to all major sheets
Because of this design, users can move between dashboard sections quickly without scrolling or searching. This improves usability, especially for senior stakeholders.
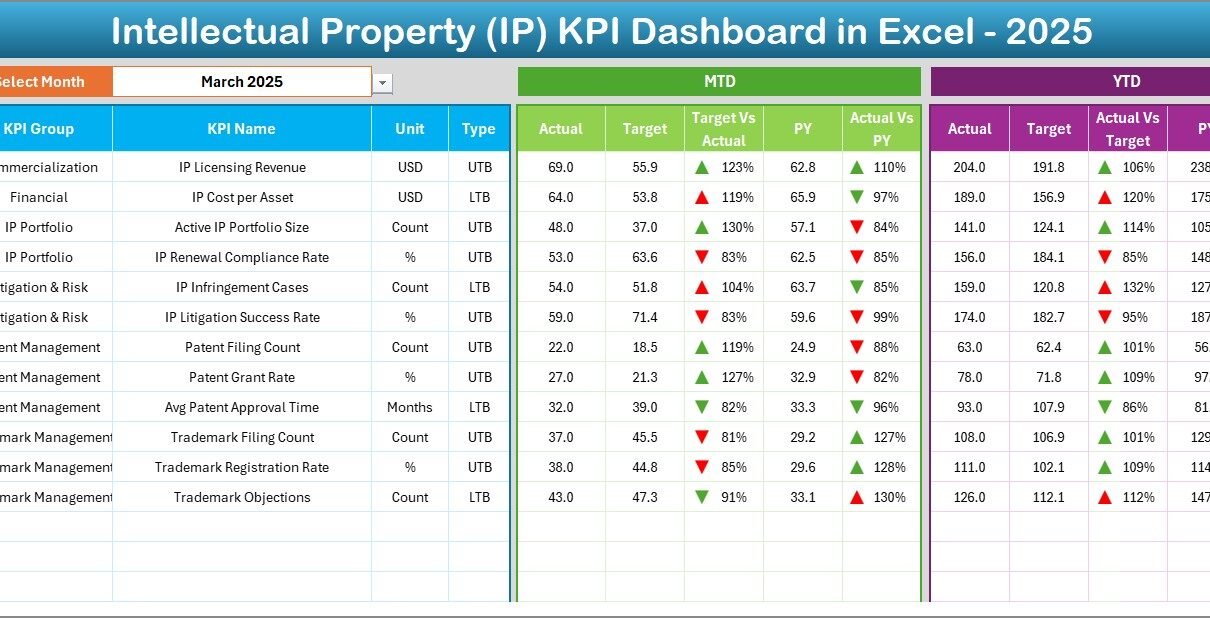
How Does the Dashboard Sheet Display KPI Performance?
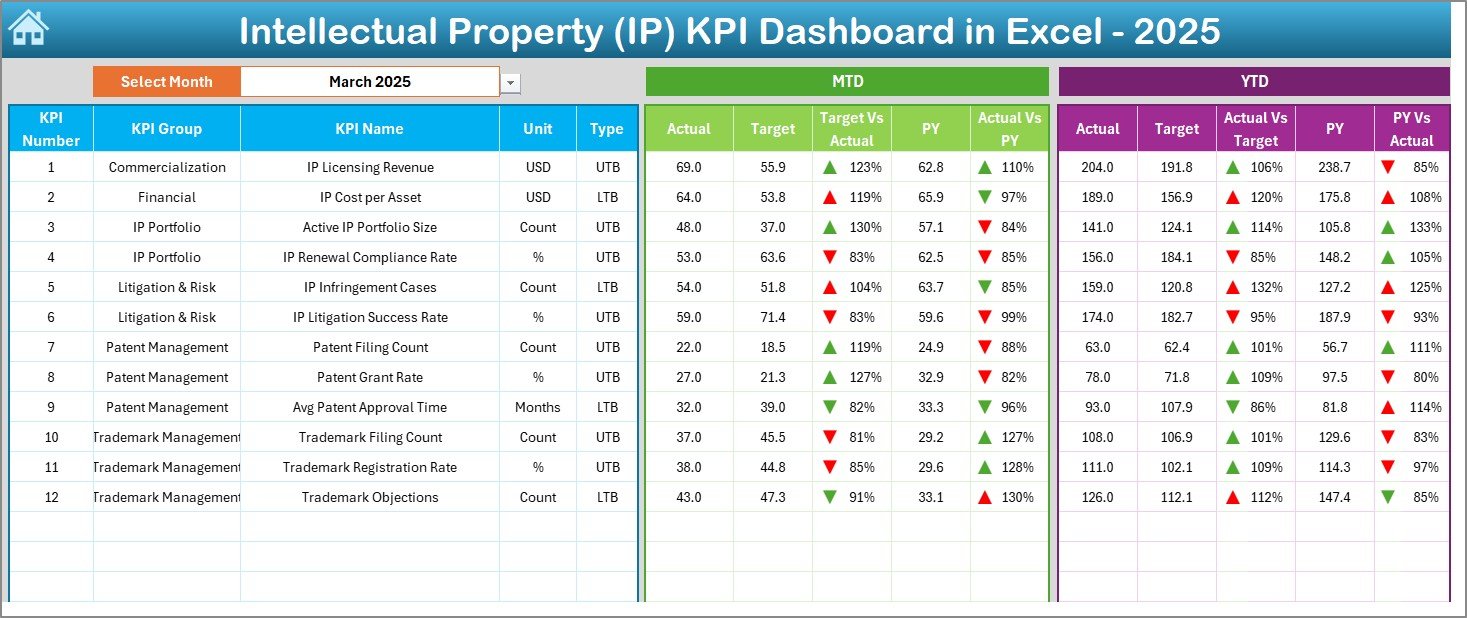
2. Dashboard Sheet
The Dashboard Sheet is the heart of the IP KPI Dashboard.
Here, you can see:
-
Complete KPI performance in one view
-
Monthly and yearly comparisons
-
Clear indicators for performance direction
Month Selection Feature
-
On cell D3, you can select the required month using a drop-down
-
Once selected, the entire dashboard updates automatically
Metrics Displayed on the Dashboard
Click to Purchases Intellectual Property (IP) KPI Dashboard in Excel
MTD Section Shows:
-
Actual values
-
Target values
-
Previous Year values
-
Target vs Actual comparison
-
PY vs Actual comparison with up/down arrows
YTD Section Shows:
-
Actual values
-
Target values
-
Previous Year values
-
Target vs Actual comparison
-
PY vs Actual comparison with conditional formatting
Because of this setup, users instantly understand current performance and historical context.
What Is the KPI Trend Sheet Used For?
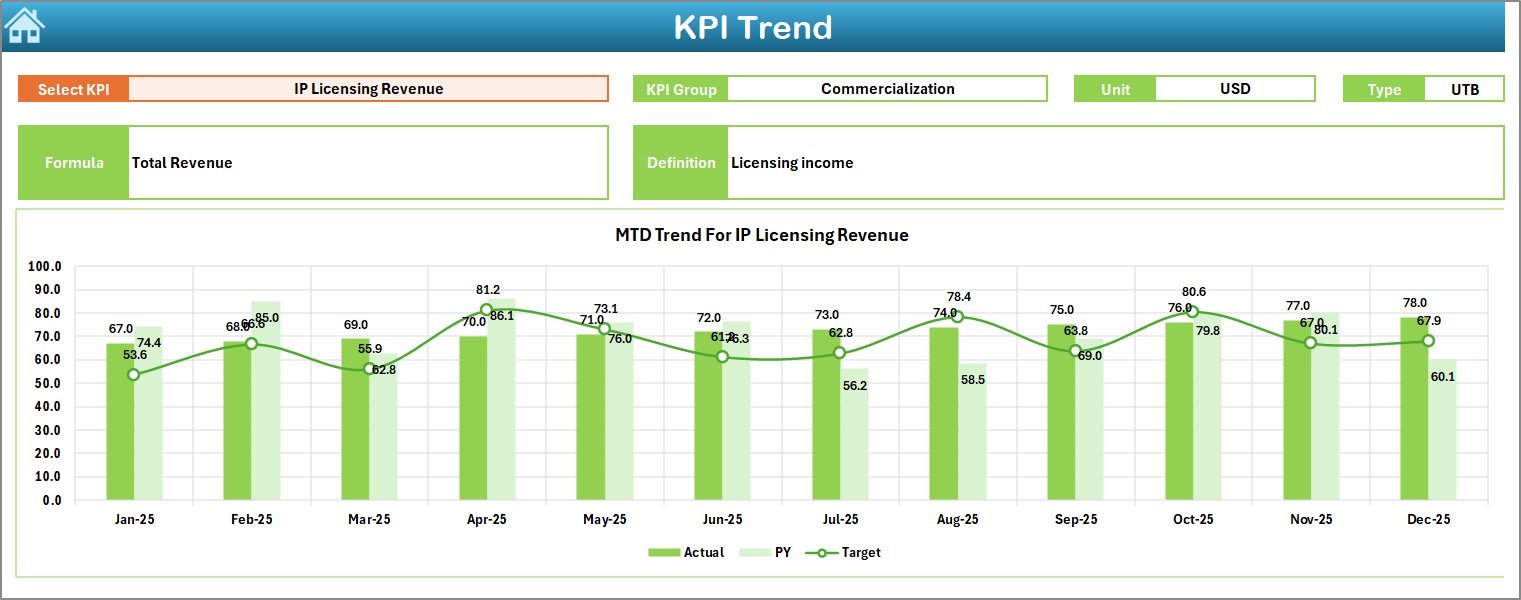
3. KPI Trend Sheet
The KPI Trend Sheet focuses on deep analysis of a single KPI.
KPI Selection
-
Select a KPI name from the drop-down available in cell C3
KPI Information Displayed
Once selected, the sheet displays:
-
KPI Group
-
Unit of KPI
-
KPI Type (Lower the Better or Upper the Better)
-
KPI Formula
-
KPI Definition
Trend Analysis Charts
Additionally, this sheet shows:
-
MTD trend chart for Actual, Target, and Previous Year
-
YTD trend chart for Actual, Target, and Previous Year
As a result, users can identify patterns, seasonal effects, and performance gaps easily.
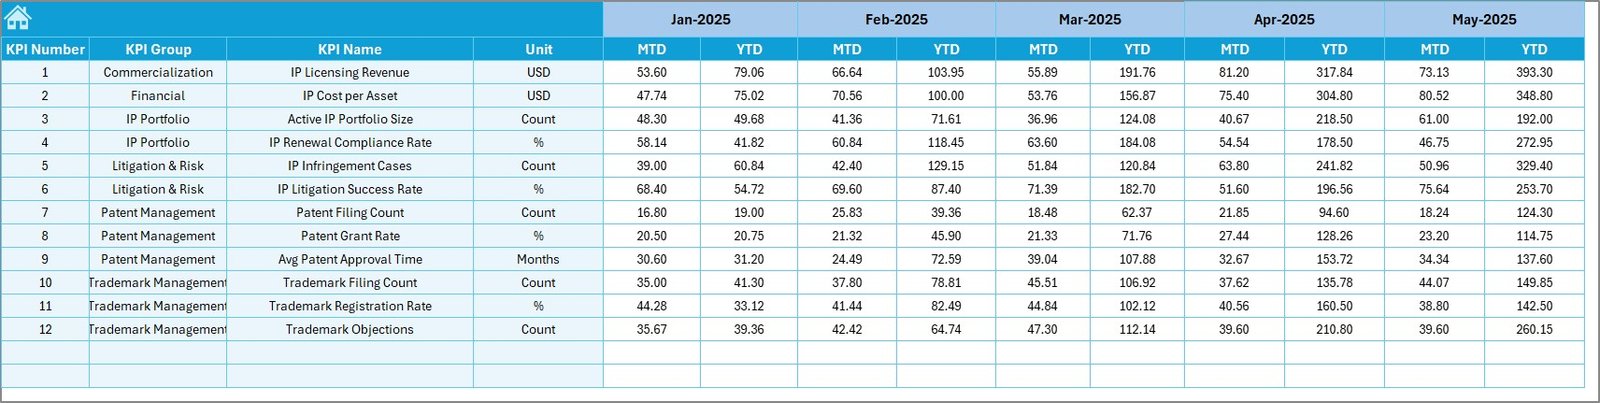
How Do You Enter Actual IP Performance Data?
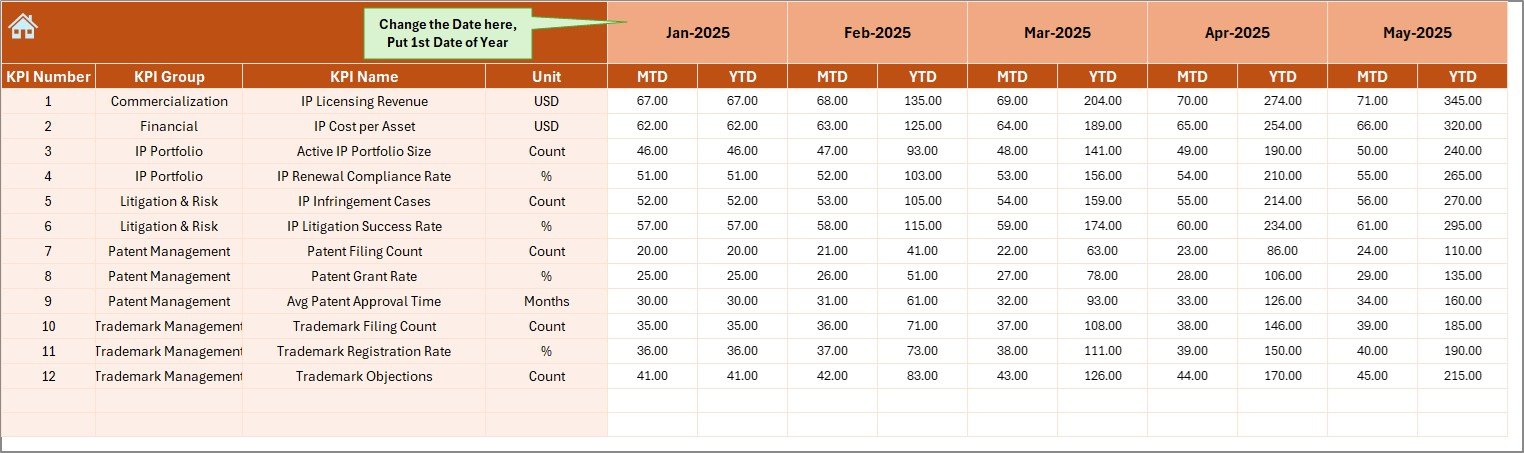
4. Actual Numbers Input Sheet
The Actual Numbers Input Sheet allows users to enter real IP performance data.
Key Features
-
Enter MTD and YTD actual values
-
Select the starting month of the year in cell E1
-
Change months easily without restructuring data
Because of this flexibility, teams can maintain consistent data entry throughout the year.
How Are Targets Defined in the Dashboard?
5. Target Sheet
The Target Sheet captures expected performance levels.
Here, you can:
-
Enter monthly MTD targets
-
Enter cumulative YTD targets
-
Define targets for each KPI
Once entered, these targets automatically reflect across the dashboard and trend sheets.
Why Is the Previous Year Sheet Important?
6. Previous Year Number Sheet
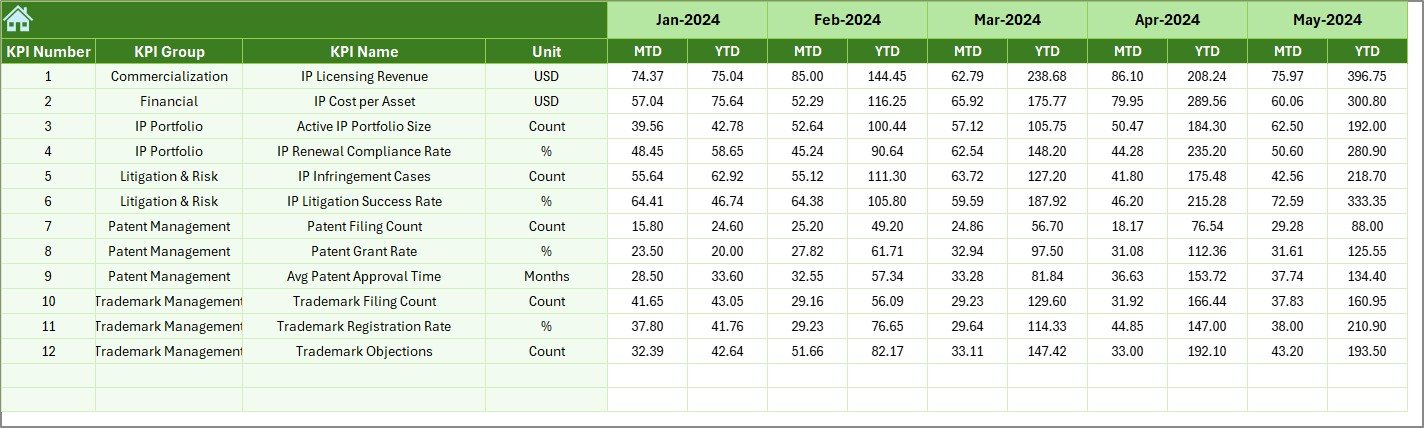
The Previous Year Number Sheet stores historical performance data.
Click to Purchases Intellectual Property (IP) KPI Dashboard in Excel
You should:
-
Enter previous year values using the same structure as current year data
-
Maintain consistency for accurate comparison
This sheet enables powerful year-over-year analysis, helping organizations understand growth and improvement.
What Is the Role of the KPI Definition Sheet?
7. KPI Definition Sheet
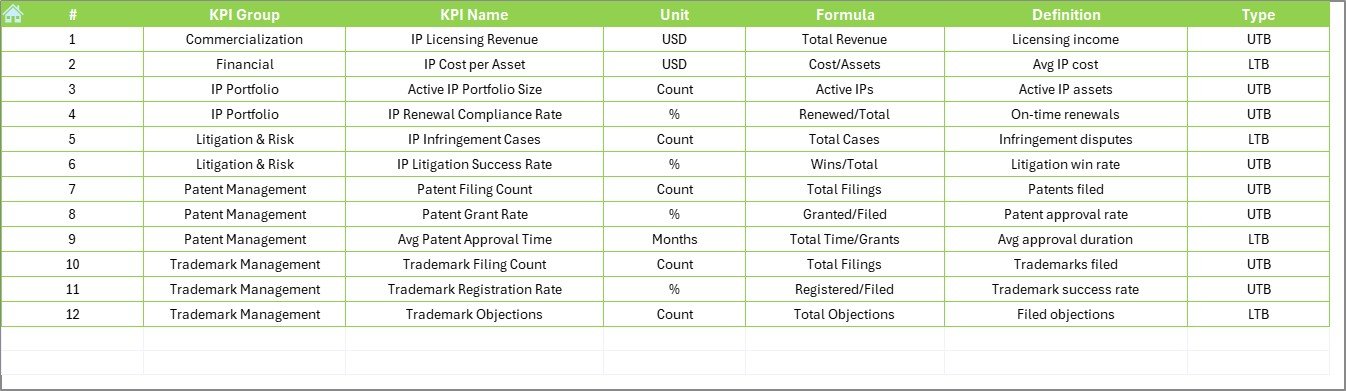
The KPI Definition Sheet ensures clarity and standardization.
In this sheet, you define:
-
KPI Name
-
KPI Group
-
Unit of Measurement
-
Formula
-
KPI Definition
Because of this, every stakeholder understands what each KPI means and how calculations work.
Advantages of Intellectual Property (IP) KPI Dashboard in Excel
Using an IP KPI Dashboard in Excel offers multiple strategic benefits.
Key Advantages
-
Centralized IP performance tracking
-
Clear MTD and YTD visibility
-
Easy Target vs Actual comparison
-
Previous Year benchmarking
-
Visual indicators for quick decisions
-
No need for complex software
-
Fully customizable KPI structure
-
Suitable for legal, R&D, and management teams
Therefore, organizations improve control, transparency, and accountability across IP operations.
How Does This Dashboard Improve Decision-Making?
Because the dashboard presents real-time comparisons and trends, decision-makers can:
-
Identify delays in filings or approvals
-
Monitor cost overruns early
-
Track compliance with renewal timelines
-
Allocate resources more effectively
-
Strengthen IP strategy using data
As a result, organizations protect their intellectual assets more efficiently.
Best Practices for the Intellectual Property (IP) KPI Dashboard in Excel
To get maximum value from this dashboard, follow these best practices.
Data Entry Best Practices
-
Update actual numbers monthly
-
Validate target values regularly
-
Keep previous year data consistent
KPI Design Best Practices
-
Limit KPIs to meaningful metrics
-
Clearly define Lower the Better and Upper the Better KPIs
-
Avoid overlapping KPIs
Dashboard Usage Best Practices
-
Review MTD performance monthly
-
Analyze YTD trends quarterly
-
Share dashboard insights with stakeholders
-
Use trend sheets for root cause analysis
By following these practices, teams maintain accuracy and reliability.
Who Should Use an IP KPI Dashboard in Excel?
This dashboard suits multiple roles and industries, including:
-
Intellectual Property Teams
-
Legal Departments
-
R&D Teams
-
Compliance Officers
-
Innovation Managers
-
Senior Management
Because Excel is widely used, adoption remains quick and smooth.
Can This Dashboard Be Customized?
Yes, the IP KPI Dashboard in Excel is highly customizable.
You can:
-
Add or remove KPIs
-
Modify KPI groups
-
Adjust targets
-
Change visual formatting
-
Extend trend analysis
This flexibility ensures the dashboard aligns with your IP strategy.
Conclusion: Why Should You Use an Intellectual Property (IP) KPI Dashboard in Excel?
An Intellectual Property (IP) KPI Dashboard in Excel provides a structured, visual, and efficient way to manage IP performance.
Instead of relying on scattered files and manual reviews, this dashboard centralizes all IP metrics in one professional reporting system. Because it supports MTD, YTD, Target vs Actual, and Previous Year analysis, it empowers teams to make informed decisions and protect valuable intellectual assets.
Ultimately, this dashboard transforms IP tracking from a reactive task into a strategic advantage.
Frequently Asked Questions (FAQs)
What is an IP KPI Dashboard in Excel used for?
An IP KPI Dashboard in Excel helps organizations track, analyze, and monitor intellectual property performance using KPIs, trends, and comparisons.
Can I use this dashboard without advanced Excel skills?
Yes. The dashboard is ready to use and requires only basic data entry skills.
How often should I update the dashboard?
You should update actual values monthly and review trends quarterly for best results.
Can I add more KPIs to the dashboard?
Yes. You can easily add or modify KPIs using the KPI Definition and input sheets.
Does the dashboard support year-over-year comparison?
Yes. The Previous Year Number Sheet enables accurate year-over-year performance analysis.
Is this dashboard suitable for small teams?
Absolutely. Both small and large organizations can use this dashboard effectively.
Visit our YouTube channel to learn step-by-step video tutorials