Logistics plays a critical role in business success. Every delay, every extra kilometer, and every missed delivery directly impacts cost, customer satisfaction, and profitability. Therefore, organizations must track logistics performance in a structured and measurable way. That is exactly where a Logistics Efficiency KPI Scorecard in Excel becomes a powerful and practical solution.
In this in-depth and SEO-friendly guide, you will learn what a Logistics Efficiency KPI Scorecard in Excel is, why it is important, how it works, and how each worksheet supports data-driven logistics decisions. Moreover, you will explore its advantages, best practices, and frequently asked questions. By the end of this article, you will clearly understand how this ready-to-use Excel scorecard helps logistics teams improve efficiency, reduce costs, and achieve operational excellence.
Click to Purchases Logistics Efficiency KPI Scorecard in Excel
What Is a Logistics Efficiency KPI Scorecard in Excel?
A Logistics Efficiency KPI Scorecard in Excel is a structured and interactive Excel-based reporting tool that tracks, monitors, and evaluates key performance indicators related to logistics operations.
Instead of using scattered spreadsheets, emails, or manual reports, this scorecard centralizes all logistics KPIs into one Excel file. As a result, logistics managers, supply chain teams, and decision-makers gain instant visibility into performance.
Moreover, Excel makes the scorecard easy to use, flexible to update, and simple to customize. You do not need advanced technical skills to operate it. You simply update the data, select the required period, and instantly review logistics performance.
Why Is Logistics Efficiency Important for Businesses?
Logistics efficiency directly affects both cost and customer satisfaction. Therefore, businesses must measure and improve it continuously.
Here is why logistics efficiency matters so much:
-
Faster deliveries improve customer trust and loyalty
-
Optimized routes reduce fuel and transportation costs
-
Accurate inventory movement avoids stockouts and overstocking
-
Reliable logistics improve vendor and partner relationships
-
Efficient logistics support business scalability
However, without KPIs, logistics performance remains unclear. That is why a Logistics Efficiency KPI Scorecard in Excel becomes essential.
Click to Purchases Logistics Efficiency KPI Scorecard in Excel
What Is the Purpose of a Logistics Efficiency KPI Scorecard?
The main purpose of a logistics KPI scorecard is to convert raw logistics data into clear, actionable insights.
This scorecard helps organizations:
-
Track logistics KPIs consistently
-
Compare actual performance with targets
-
Monitor Month-to-Date (MTD) and Year-to-Date (YTD) trends
-
Identify inefficiencies and bottlenecks early
-
Support data-driven decision-making
As a result, logistics teams move from reactive problem-solving to proactive performance management.
What KPIs Are Commonly Tracked in a Logistics Efficiency Scorecard?
A Logistics Efficiency KPI Scorecard typically tracks KPIs such as:
-
On-Time Delivery Rate
-
Transportation Cost per Unit
-
Order Fulfillment Cycle Time
-
Inventory Turnover Ratio
-
Vehicle Utilization Rate
-
Delivery Accuracy
-
Freight Cost Variance
-
Damage or Return Rate
Each KPI aligns with a specific logistics objective, such as cost control, speed, accuracy, or reliability.
How Does a Logistics Efficiency KPI Scorecard in Excel Work?
The scorecard works through structured data input, automated calculations, and visual performance indicators.
You enter actual and target values for each KPI. Then, Excel calculates variances, trends, and performance status. After that, you analyze results using dropdowns and charts.
Because Excel supports formulas, charts, and conditional formatting, the entire scorecard updates dynamically.
Click to Purchases Logistics Efficiency KPI Scorecard in Excel
What Are the Worksheets in a Logistics Efficiency KPI Scorecard in Excel?
This ready-to-use Logistics Efficiency KPI Scorecard includes four structured worksheets, each serving a specific purpose.
Let us explore them one by one.
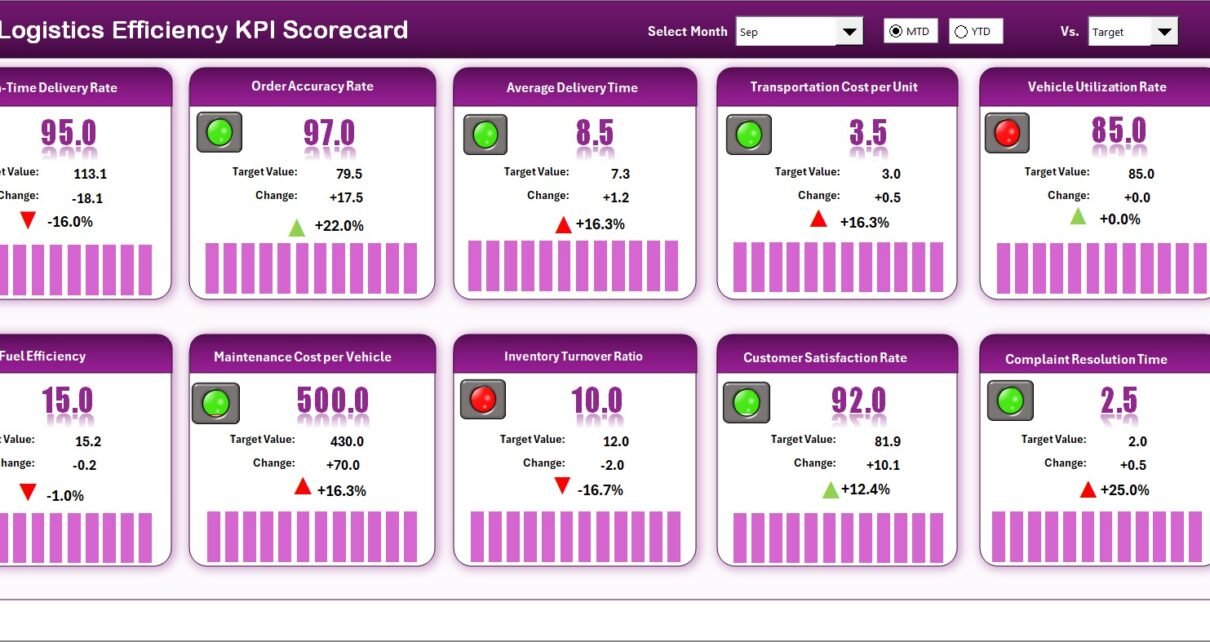
What Is the Scorecard Sheet and How Does It Help?
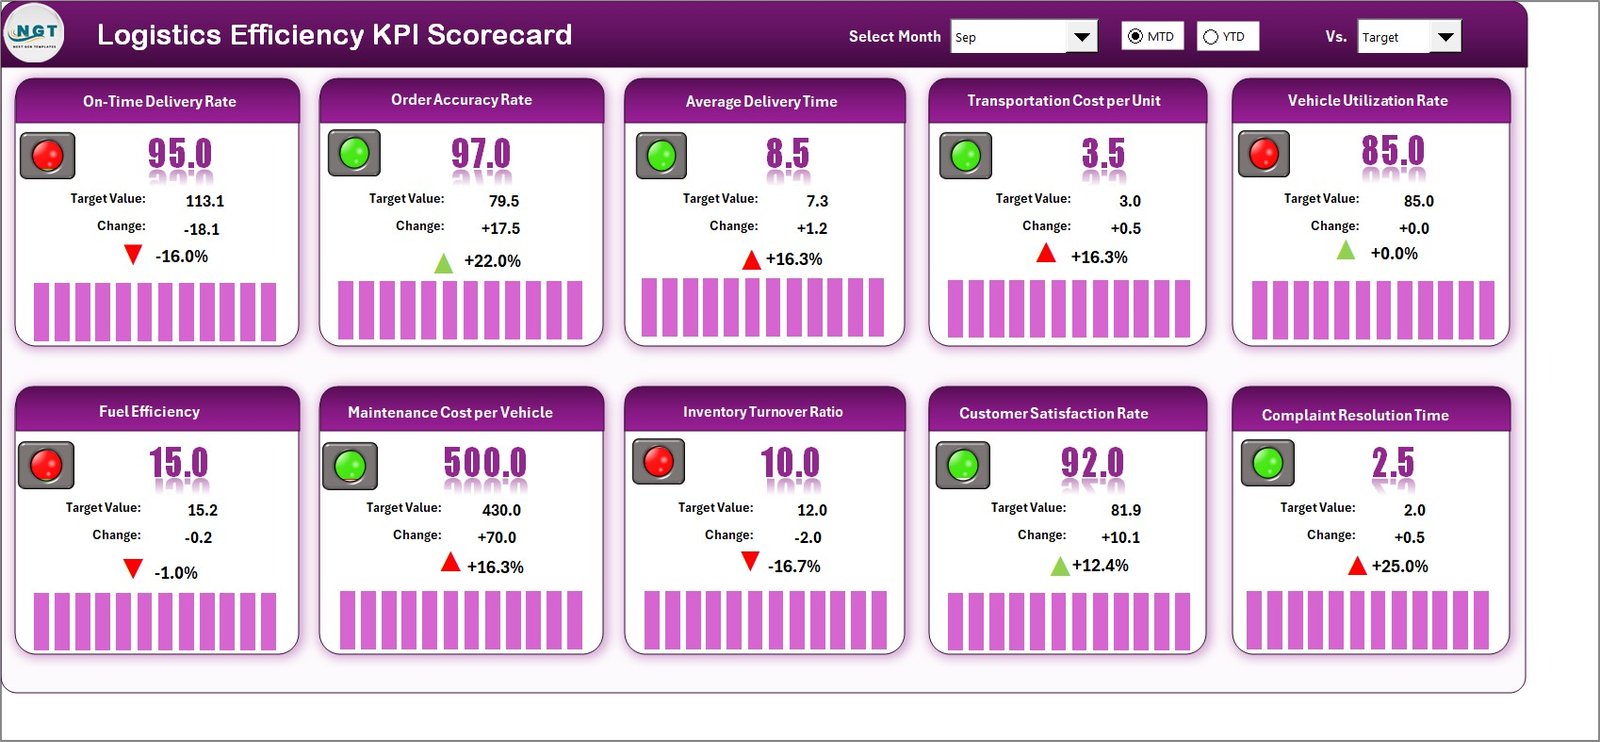
The Scorecard Sheet is the main interface of the KPI scorecard. It provides a consolidated view of all logistics KPIs.
Key Features of the Scorecard Sheet
-
Dropdown Menus for Period Selection
You can select Month, MTD, or YTD to analyze performance for different timeframes. -
Actual vs Target Comparison
The sheet clearly displays actual values against defined targets for each KPI. -
Visual Performance Indicators
Color-coded indicators or conditional formatting instantly show whether performance meets expectations. -
Comprehensive KPI Overview
You can view KPI Name, KPI Group, Unit, Type, Actual, Target, and variance in one place.
Why the Scorecard Sheet Matters
Because this sheet summarizes all KPIs, decision-makers can quickly identify:
-
Which KPIs perform well
-
Which KPIs need immediate attention
-
Where corrective action is required
As a result, leadership saves time and focuses on the right priorities.
What Is the KPI Trend Sheet and Why Is It Important?
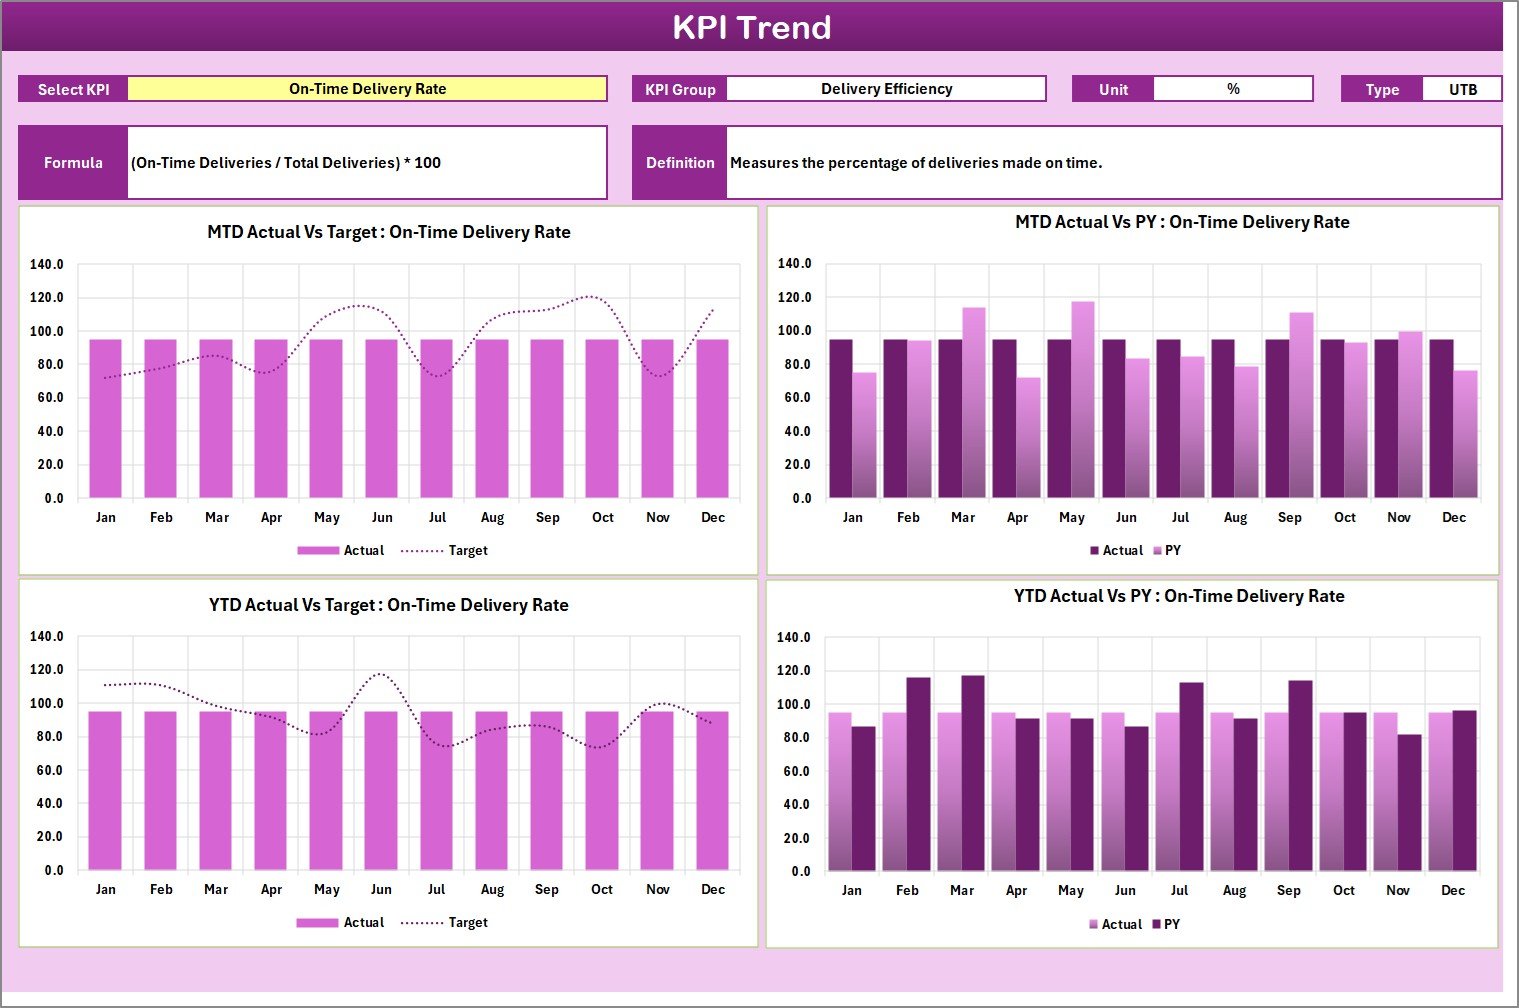
The KPI Trend Sheet helps you analyze performance trends over time.
How the KPI Trend Sheet Works
-
You select a KPI name from the dropdown at cell C3
-
The sheet automatically displays:
-
KPI Group
-
KPI Unit
-
KPI Type (Lower the Better or Upper the Better)
-
KPI Formula
-
KPI Definition
-
Trend Analysis Features
-
MTD Trend Chart for Actual, Target, and Previous Year (PY)
-
YTD Trend Chart for Actual, Target, and Previous Year (PY)
Why Trend Analysis Is Critical
Trends show patterns, not just numbers. Therefore, this sheet helps you:
-
Identify performance improvements or declines
-
Compare current performance with past periods
-
Detect seasonal or operational issues early
As a result, logistics teams can take corrective actions before problems escalate.
Click to Purchases Logistics Efficiency KPI Scorecard in Excel
What Is the Input Data Sheet and How Do You Use It?
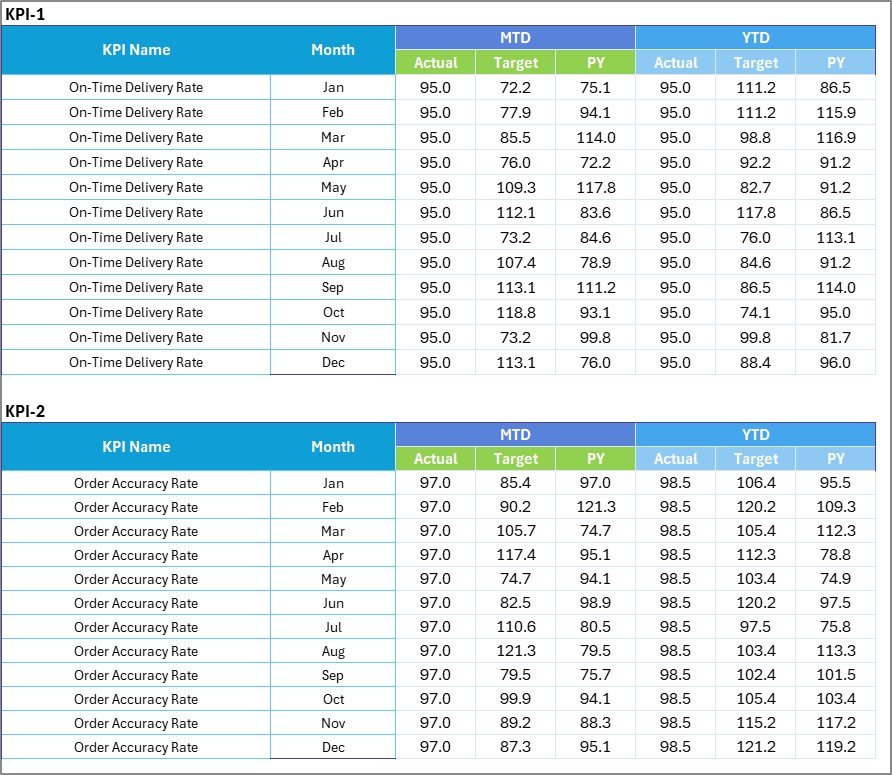
The Input Data Sheet is where all KPI data gets recorded.
Key Features of the Input Data Sheet
-
Data Entry Area
You enter actual values, target values, and related metrics for each KPI. -
Easy Updates
You can update data monthly or daily, depending on your reporting cycle. -
Flexible Structure
The sheet supports adding new KPIs or modifying existing ones.
Why Accurate Input Data Matters
Accurate data ensures reliable insights. Therefore, this sheet acts as the foundation of the entire scorecard.
When data remains accurate and updated, all dashboards and charts reflect true performance.
What Is the KPI Definition Sheet and Why Is It Needed?
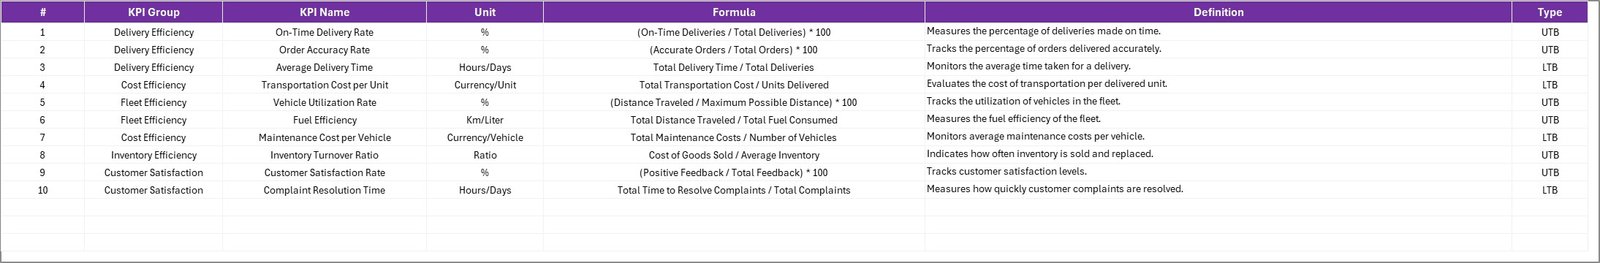
The KPI Definition Sheet acts as a reference guide for all KPIs.
Information Captured in the KPI Definition Sheet
-
KPI Name
-
KPI Group
-
Unit of Measurement
-
KPI Formula
-
KPI Definition
-
KPI Type (Lower the Better or Upper the Better)
Benefits of the KPI Definition Sheet
-
Ensures consistent KPI understanding across teams
-
Avoids confusion or misinterpretation
-
Helps new team members learn KPIs quickly
-
Improves reporting accuracy
Because clarity drives consistency, this sheet plays a crucial role.
Advantages of Logistics Efficiency KPI Scorecard in Excel
A Logistics Efficiency KPI Scorecard in Excel delivers multiple business benefits.
Key Advantages
-
Centralized Performance Tracking
All logistics KPIs remain in one structured file. -
Improved Decision-Making
Clear visuals and comparisons support faster decisions. -
Cost Control
Identifying inefficiencies helps reduce logistics expenses. -
Operational Transparency
Teams gain clear visibility into logistics performance. -
User-Friendly Interface
Excel requires no complex tools or advanced training. -
Customizable and Scalable
You can easily modify KPIs as business needs evolve. -
Time-Saving Reporting
Automated calculations reduce manual reporting effort.
How Does This Scorecard Improve Logistics Performance?
This scorecard improves logistics performance by turning data into action.
It helps teams:
-
Track daily, monthly, and yearly performance
-
Spot delivery delays and cost overruns early
-
Improve route planning and vehicle utilization
-
Align logistics goals with business objectives
-
Measure continuous improvement initiatives
Because measurement drives improvement, the scorecard becomes a powerful management tool.
Click to Purchases Logistics Efficiency KPI Scorecard in Excel
Best Practices for the Logistics Efficiency KPI Scorecard in Excel
To maximize the value of your scorecard, follow these best practices.
1. Define Clear and Relevant KPIs
Always select KPIs that directly impact logistics efficiency. Avoid tracking too many metrics at once.
2. Set Realistic Targets
Targets should challenge teams but remain achievable. Unrealistic targets reduce motivation.
3. Update Data Regularly
Frequent data updates ensure accurate and timely insights.
4. Use Consistent KPI Definitions
Maintain standardized KPI definitions to avoid confusion.
5. Review Trends, Not Just Current Values
Trends reveal long-term performance patterns and improvement opportunities.
6. Involve Logistics Teams
Engage operations teams in KPI reviews to drive accountability.
7. Act on Insights
Always convert KPI insights into corrective actions and improvement plans.
Who Should Use a Logistics Efficiency KPI Scorecard in Excel?
This scorecard suits a wide range of users, including:
-
Logistics Managers
-
Supply Chain Analysts
-
Warehouse Managers
-
Operations Heads
-
Business Owners
-
Consultants and Analysts
Because Excel remains widely used, this tool fits organizations of all sizes.
Can Small and Medium Businesses Use This Scorecard?
Yes, absolutely.
Small and medium businesses often lack expensive analytics tools. Therefore, an Excel-based KPI scorecard offers:
-
Low implementation cost
-
Easy setup and maintenance
-
High flexibility
-
Immediate value
As a result, SMBs can manage logistics efficiently without heavy investments.
Click to Purchases Logistics Efficiency KPI Scorecard in Excel
Conclusion: Why You Need a Logistics Efficiency KPI Scorecard in Excel
A Logistics Efficiency KPI Scorecard in Excel transforms logistics data into meaningful insights. It helps organizations track performance, control costs, improve delivery reliability, and support smarter decisions.
Because it offers structured worksheets, trend analysis, visual indicators, and flexible data entry, this scorecard becomes an essential tool for modern logistics management.
If your organization wants better control over logistics performance without complex systems, this ready-to-use Excel scorecard delivers the perfect balance of simplicity and power.
Frequently Asked Questions (FAQs)
What is a Logistics Efficiency KPI Scorecard in Excel used for?
It tracks and analyzes logistics performance using predefined KPIs in an Excel-based format.
Can I customize KPIs in the scorecard?
Yes, you can easily add, remove, or modify KPIs based on business needs.
Does the scorecard support MTD and YTD analysis?
Yes, it includes both Month-to-Date and Year-to-Date performance analysis.
Do I need advanced Excel skills to use this scorecard?
No, basic Excel knowledge is sufficient to operate and update the scorecard.
How often should I update the KPI data?
You should update data based on your reporting cycle, such as daily, weekly, or monthly.
Can this scorecard replace logistics dashboards?
It can act as a powerful alternative for organizations that prefer Excel-based reporting.
Is this scorecard suitable for multiple warehouses or regions?
Yes, with minor customization, it can support multiple locations and operations.
Click to Purchases Logistics Efficiency KPI Scorecard in Excel
Visit our YouTube channel to learn step-by-step video tutorials