Running a hotel chain is not only about delivering great guest experiences. It is also about tracking performance, improving efficiency, and making timely decisions based on accurate data. However, many hotel groups still rely on scattered Excel files, manual reports, and delayed performance reviews. As a result, leaders struggle to get a clear picture of what is really happening across properties.
That is exactly where a Hotel Chains KPI Dashboard in Excel becomes a powerful solution.
In this detailed article, you will learn what a Hotel Chains KPI Dashboard in Excel is, how it works, its worksheet structure, key features, advantages, best practices, and frequently asked questions. By the end, you will clearly understand how this ready-to-use Excel dashboard helps hotel chains monitor KPIs, compare performance, and drive consistent growth across locations.
Click to Purchases Hotel Chains KPI Dashboard in Excel
What Is a Hotel Chains KPI Dashboard in Excel?
A Hotel Chains KPI Dashboard in Excel is a centralized, interactive, and ready-to-use performance tracking tool designed specifically for hotel groups and hospitality businesses.
Instead of maintaining multiple spreadsheets for occupancy, revenue, guest satisfaction, and operational metrics, this dashboard brings everything together in one structured Excel file. As a result, hotel managers and executives can track performance quickly and accurately.
With this dashboard, hotel chains can:
-
Monitor key hotel KPIs in one place
-
Compare Actual vs Target performance
-
Analyze Month-to-Date (MTD) and Year-to-Date (YTD) results
-
Track Previous Year (PY) performance for trend analysis
-
Identify underperforming areas instantly using visual indicators
Most importantly, because it runs entirely in Microsoft Excel, teams do not need expensive BI tools or technical expertise.
Why Do Hotel Chains Need a KPI Dashboard in Excel?
Hotel chains operate in a highly competitive and fast-moving environment. Therefore, leaders need real-time visibility into both operational and financial performance.
However, without a structured dashboard:
-
Reports take too long to prepare
-
Data remains inconsistent across hotels
-
Performance reviews become reactive instead of proactive
-
Decision-making slows down
A Hotel Chains KPI Dashboard in Excel solves these problems by offering clarity, speed, and consistency.
What KPIs Can You Track Using a Hotel Chains KPI Dashboard in Excel?
A well-designed hotel KPI dashboard supports a wide range of performance indicators. These KPIs help hotel chains evaluate profitability, efficiency, and guest satisfaction.
Common hotel KPIs include:
-
Occupancy Rate
-
Average Daily Rate (ADR)
-
Revenue per Available Room (RevPAR)
-
Gross Operating Profit (GOP)
-
Cost per Occupied Room
-
Guest Satisfaction Score
-
Booking Conversion Rate
-
Average Length of Stay
-
Cancellation Rate
-
Employee Productivity Metrics
Because the dashboard includes a KPI Definition sheet, hotel teams can customize KPIs based on their specific business goals.
How Does a Hotel Chains KPI Dashboard in Excel Work?
The dashboard works by combining structured data input sheets with automated calculations and visual reporting. Once users enter Actual, Target, and Previous Year data, the dashboard instantly updates all visuals.
Moreover, dropdown filters and dynamic formulas allow users to analyze performance by month and KPI without manual effort.
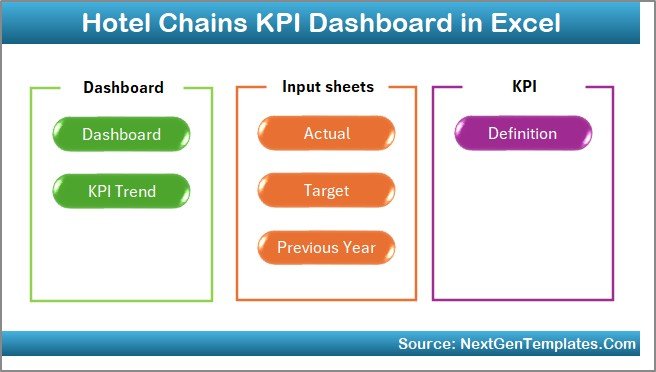
Overview of the Hotel Chains KPI Dashboard Structure
This Hotel Chains KPI Dashboard in Excel includes 7 well-structured worksheets. Each sheet serves a specific purpose, ensuring smooth data flow and easy navigation.
Let us explore each worksheet in detail.
1. Home Sheet: How Does the Navigation Work?
The Home Sheet acts as the index page of the dashboard.
Key highlights of the Home Sheet:
-
Clean and professional layout
-
6 interactive buttons for easy navigation
-
One-click access to all major sheets
Because of this design, users do not waste time searching for sheets. Instead, they can jump directly to the required section.
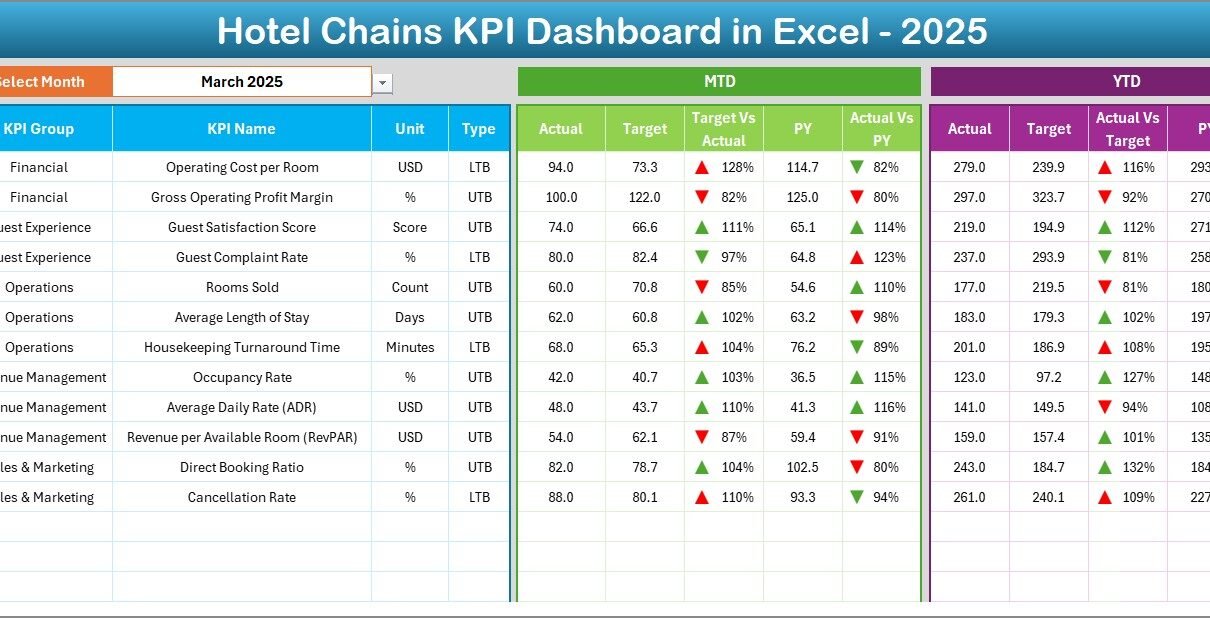
2. Dashboard Sheet: How Does the Main KPI View Work?
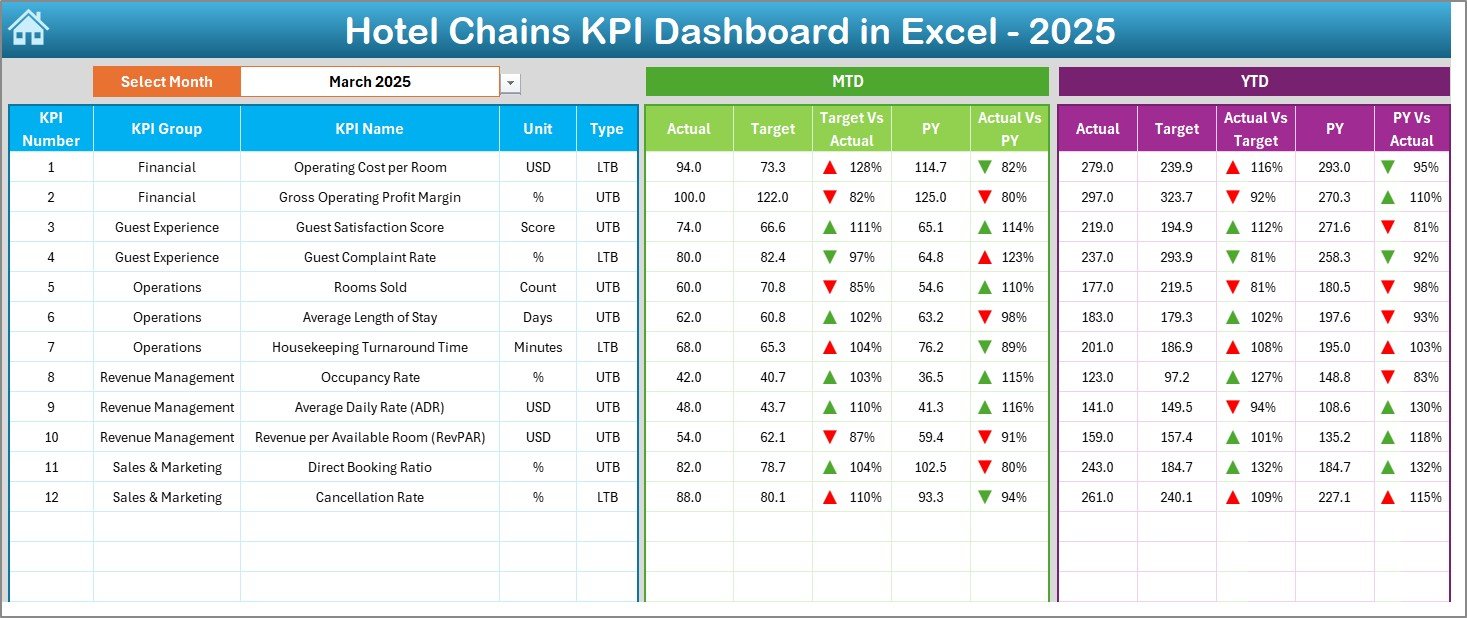
The Dashboard Sheet is the heart of the Hotel Chains KPI Dashboard in Excel.
This sheet displays all KPIs in a summarized and visual format. Moreover, it allows dynamic analysis through a month selector.
Key Features of the Dashboard Sheet
-
Month selection dropdown on Cell D3
-
Automatic update of all KPI values based on the selected month
-
Clear comparison between performance metrics
KPI Metrics Displayed on the Dashboard
For each KPI, the dashboard shows:
MTD Metrics
-
MTD Actual
-
MTD Target
-
MTD Previous Year
-
Target vs Actual with up/down arrows
-
PY vs Actual with up/down arrows
YTD Metrics
-
YTD Actual
-
YTD Target
-
YTD Previous Year
-
Target vs Actual with visual indicators
-
PY vs Actual with trend arrows
Because of conditional formatting, users can instantly spot good and poor performance.
Click to Purchases Hotel Chains KPI Dashboard in Excel
3. KPI Trend Sheet: How Can You Analyze KPI Trends?
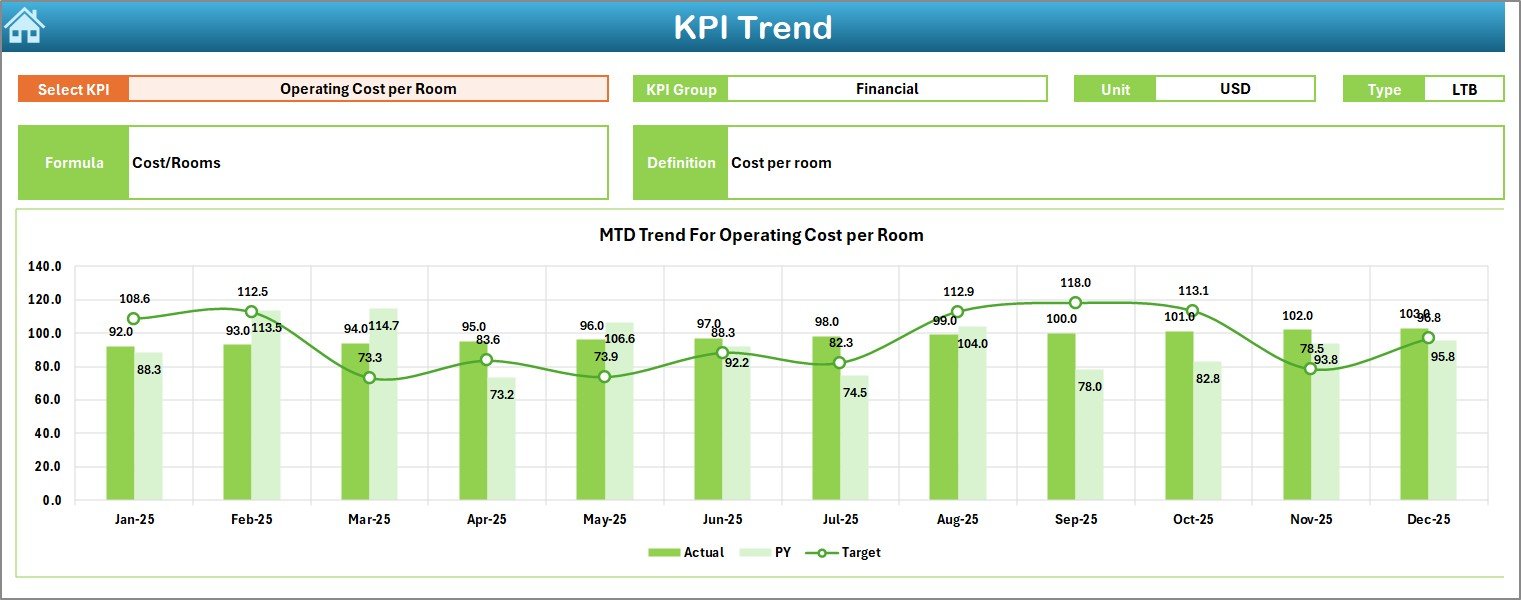
The KPI Trend Sheet focuses on deeper KPI analysis.
On this sheet, users can select a KPI from the dropdown available in Cell C3. Once selected, the dashboard displays detailed information and trends.
What Information Does the KPI Trend Sheet Show?
-
KPI Group
-
KPI Unit
-
KPI Type (Lower the Better or Upper the Better)
-
KPI Formula
-
KPI Definition
Trend Analysis Charts
This sheet also includes:
-
MTD trend chart for Actual, Target, and PY
-
YTD trend chart for Actual, Target, and PY
As a result, hotel managers can easily track performance movement over time.
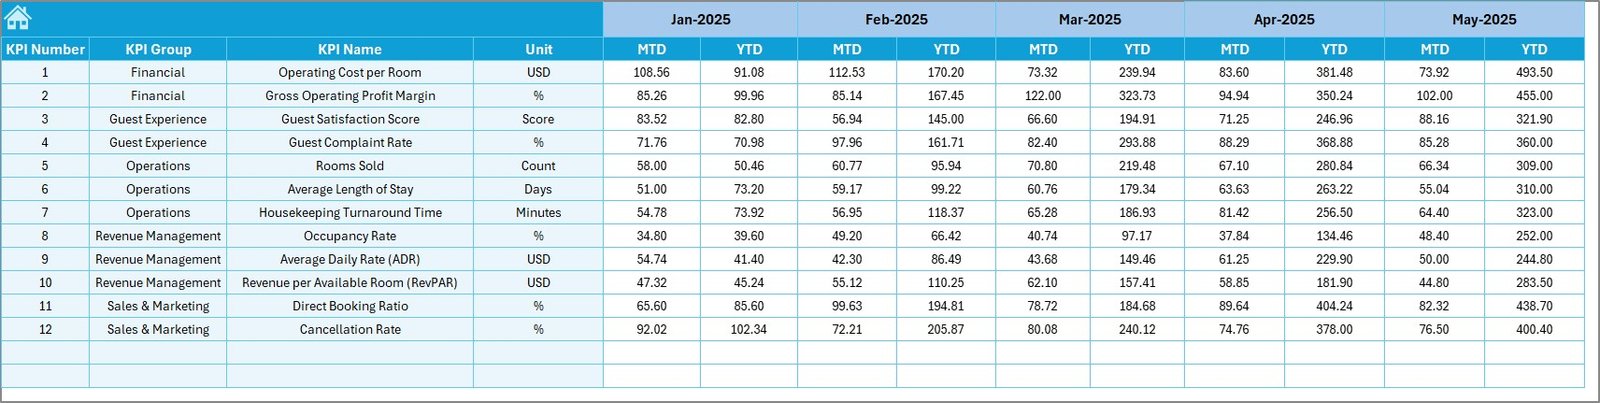
4. Actual Numbers Input Sheet: How Do You Enter Data?
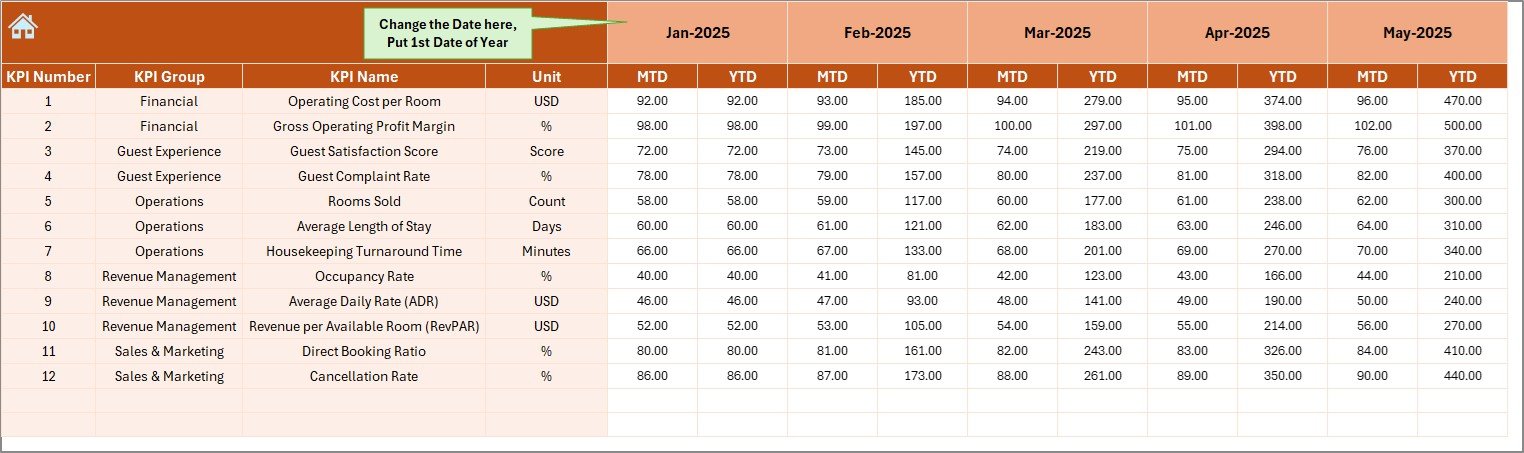
The Actual Numbers Input Sheet is where users enter real performance data.
How Data Entry Works
-
Enter Actual MTD and YTD values for each KPI
-
Change the starting month of the year in Cell E1
-
Update monthly data without breaking formulas
Because of its structured design, users can maintain data accuracy and consistency.
5. Target Sheet: How Do You Set Performance Targets?
The Target Sheet allows hotel chains to define performance goals.
On this sheet, users enter:
-
MTD Target values for each KPI
-
YTD Target values for each KPI
Once targets are set, the dashboard automatically compares them with Actual results.
6. Previous Year Number Sheet: Why Is Historical Comparison Important?
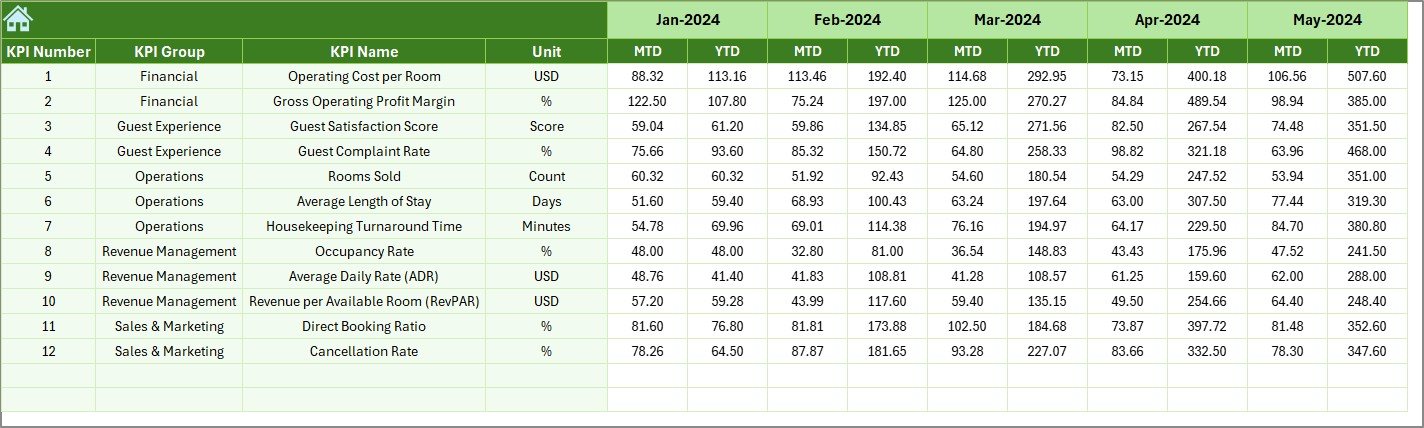
The Previous Year Number Sheet stores last year’s KPI data.
By entering Previous Year MTD and YTD values, hotel chains can:
-
Measure growth year-over-year
-
Identify seasonal patterns
-
Benchmark current performance
This comparison plays a crucial role in strategic planning.
7. KPI Definition Sheet: How Does It Improve KPI Clarity?
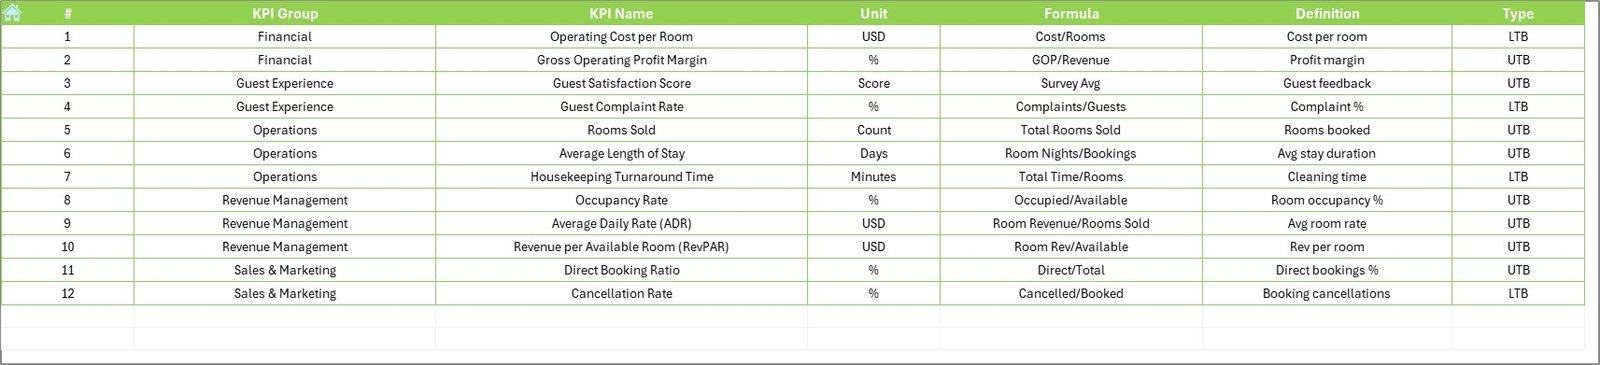
The KPI Definition Sheet acts as the foundation of the dashboard.
Click to Purchases Hotel Chains KPI Dashboard in Excel
On this sheet, users define:
-
KPI Name
-
KPI Group
-
KPI Unit
-
KPI Formula
-
KPI Definition
Because all KPIs follow a standard structure, teams avoid confusion and misinterpretation.
Advantages of Hotel Chains KPI Dashboard in Excel
Using a Hotel Chains KPI Dashboard in Excel offers several strong advantages.
Centralized Performance Tracking
Instead of multiple files, hotel chains manage all KPIs in one dashboard. As a result, reporting becomes faster and cleaner.
Easy to Use and Update
Because the dashboard runs in Excel, users do not need advanced technical skills. Moreover, updating data takes only a few minutes.
Real-Time Insights
Once data is updated, all charts and KPIs refresh automatically. Therefore, decision-makers always see the latest performance.
Cost-Effective Solution
Unlike BI tools, Excel dashboards do not require additional software licenses. This makes them ideal for small and mid-sized hotel chains.
Better Decision-Making
With clear visuals, trend charts, and comparisons, leaders make informed decisions quickly.
Best Practices for the Hotel Chains KPI Dashboard in Excel
To get the maximum value from your dashboard, follow these best practices.
Use Clearly Defined KPIs
Always define KPIs properly in the KPI Definition Sheet. Clear definitions ensure consistency across teams.
Update Data Regularly
Enter Actual, Target, and Previous Year data on a monthly basis. Regular updates keep insights relevant.
Limit the Number of KPIs
Focus only on KPIs that matter most. Too many KPIs reduce clarity and impact.
Review Trends, Not Just Numbers
Always analyze trend charts along with MTD and YTD values. Trends reveal long-term performance patterns.
Align KPIs with Business Goals
Ensure that selected KPIs directly support revenue growth, cost control, and guest satisfaction.
How Does This Dashboard Help Hotel Chain Executives?
Hotel chain executives need quick, high-level insights. This dashboard supports them by:
-
Showing summarized KPI performance
-
Highlighting problem areas instantly
-
Supporting strategic planning with trend data
-
Reducing dependency on manual reports
As a result, executives gain confidence in their decisions.
Can This Dashboard Be Customized for Different Hotel Brands?
Click to Purchases Hotel Chains KPI Dashboard in Excel
Yes, the dashboard is fully customizable.
Hotel chains can:
-
Add or remove KPIs
-
Modify KPI groups
-
Adjust formulas and targets
-
Rebrand the dashboard layout
This flexibility makes it suitable for luxury hotels, budget chains, and resort groups.
Conclusion: Why Should Hotel Chains Use a KPI Dashboard in Excel?
A Hotel Chains KPI Dashboard in Excel transforms how hotel groups track and manage performance. Instead of spending hours on manual reporting, teams gain instant visibility into KPIs that matter most.
With structured worksheets, dynamic charts, and clear comparisons, this dashboard helps hotel chains improve efficiency, increase profitability, and enhance guest satisfaction.
If your hotel chain wants a simple yet powerful performance tracking solution, this Excel-based KPI dashboard is the perfect choice.
Frequently Asked Questions About Hotel Chains KPI Dashboard in Excel
What is a Hotel Chains KPI Dashboard in Excel used for?
It helps hotel chains track, analyze, and improve key operational and financial performance metrics in one centralized Excel file.
Do I need advanced Excel skills to use this dashboard?
No. The dashboard is user-friendly and designed for business users with basic Excel knowledge.
Can I track multiple hotels using this dashboard?
Yes. You can customize KPIs or extend data tables to support multiple hotel locations.
How often should I update the dashboard?
You should update it monthly to ensure accurate MTD and YTD performance tracking.
Can I customize KPIs in this dashboard?
Yes. The KPI Definition Sheet allows full customization of KPIs, formulas, and units.
Is this dashboard suitable for small hotel chains?
Absolutely. It is cost-effective, easy to maintain, and scalable as the business grows.
Visit our YouTube channel to learn step-by-step video tutorials