Rural development drives economic stability, social growth, and long-term sustainability. However, many government bodies and NGOs still track rural programs using scattered spreadsheets. As a result, decision-makers struggle to measure progress clearly. Moreover, they miss early warning signals when targets fall behind.
So, how can you track rural development performance in a structured and visual way?
The answer is simple.
You need a Rural Development KPI Dashboard in Power BI.
Click to Purchases Rural Development KPI Dashboard in Power BI
This ready-to-use dashboard helps government departments, rural agencies, development authorities, and NGOs monitor key performance indicators in one centralized system. Furthermore, it transforms raw Excel data into interactive visuals. Instead of spending hours preparing manual reports, you can instantly analyze MTD and YTD performance.
In this detailed guide, you will learn:
-
What a Rural Development KPI Dashboard in Power BI is
-
Why rural organizations need it
-
Complete explanation of all 3 dashboard pages
-
Key KPIs you can track
-
Advantages of Rural Development KPI Dashboard in Power BI
-
Best Practices for Rural Development KPI Dashboard
-
Frequently Asked Questions with Answers
Let us explore everything step by step.
What Is a Rural Development KPI Dashboard in Power BI?
A Rural Development KPI Dashboard in Power BI is a ready-to-use performance monitoring tool built in Microsoft Power BI. It helps organizations track rural infrastructure projects, social programs, agricultural initiatives, and community development metrics using structured KPIs.
Instead of managing multiple Excel sheets separately, this dashboard centralizes:
-
Monthly KPI data
-
Target vs Actual comparison
-
Previous year performance comparison
-
Year-to-date (YTD) progress
-
KPI trend visualization
-
KPI definitions and formulas
Moreover, the dashboard connects to an Excel data source. Therefore, you can easily update KPI values without complex databases.
Why Do Rural Development Organizations Need a KPI Dashboard?
Rural development projects often involve:
-
Infrastructure construction
-
Agricultural productivity programs
-
Employment schemes
-
Healthcare initiatives
-
Water and sanitation projects
-
Education improvement programs
However, without structured monitoring, teams face several challenges.
Common Problems Without a Dashboard
-
Delayed reporting
-
Manual calculation errors
-
Lack of visibility across departments
-
Poor comparison with previous year
-
No quick identification of underperforming KPIs
Therefore, organizations need a system that provides clarity and speed.
A Rural Development KPI Dashboard solves these issues by offering:
-
Real-time performance tracking
-
Automated calculations
-
Visual trend comparison
-
Drill-through KPI insights
As a result, leadership teams make faster and better decisions.
What Are the Key Features of Rural Development KPI Dashboard in Power BI?
This dashboard contains 3 powerful pages in Power BI Desktop. Each page serves a specific purpose.
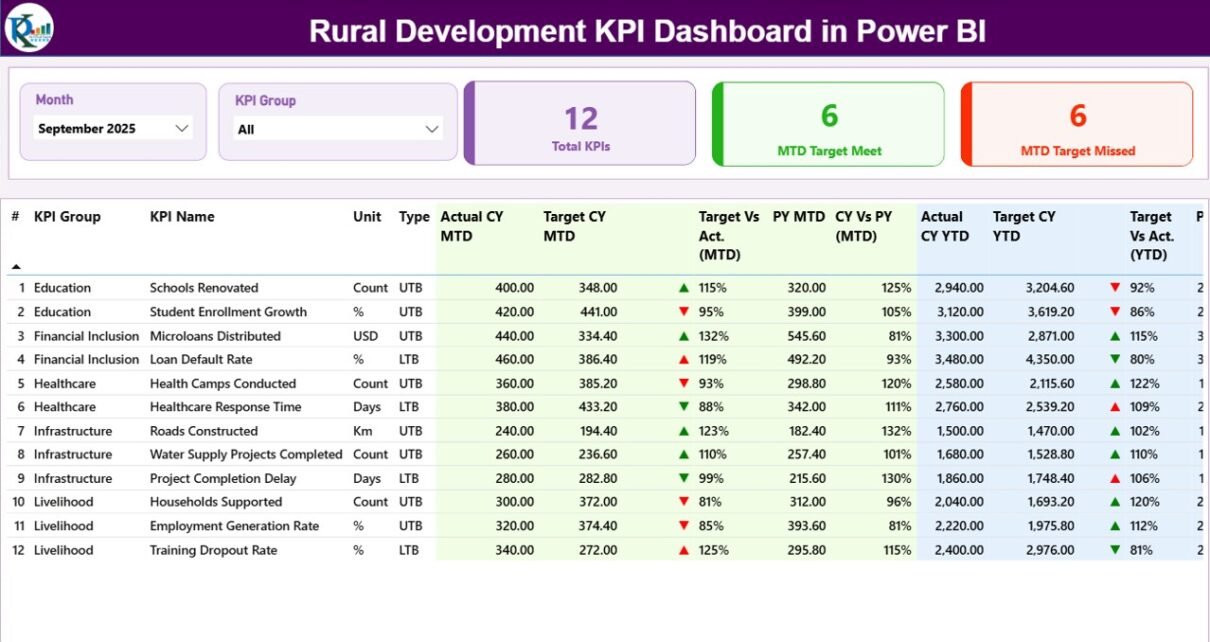
1️⃣ Summary Page – The Main Control Center

What Do You See on the Top Section?
-
Month Slicer
-
KPI Group Slicer
-
Total KPI Count Card
-
MTD Target Meet Count Card
-
MTD Target Missed Count Card
These slicers allow users to filter data by month and KPI category. Consequently, managers can analyze performance group-wise.
Detailed KPI Table
Below the cards, the dashboard displays a structured KPI table with the following fields:
-
KPI Number
-
KPI Group
-
KPI Name
-
Unit
-
Type (LTB or UTB)
-
Actual CY MTD
-
Target CY MTD
-
MTD Icon (▲ / ▼ with color)
-
Target vs Actual (MTD %)
-
PY MTD
-
CY vs PY (MTD %)
-
Actual CY YTD
-
Target CY YTD
-
YTD Icon
-
Target vs Actual (YTD %)
-
PY YTD
-
CY vs PY (YTD %)
How Does the Icon System Work?
-
Green ▲ indicates performance meets or exceeds target
-
Red ▼ indicates performance falls below target
Additionally, the system recognizes KPI type:
-
UTB (Upper the Better) – Higher values mean better performance
-
LTB (Lower the Better) – Lower values indicate better results
Therefore, the dashboard correctly evaluates performance based on KPI logic.
Click to Purchases Rural Development KPI Dashboard in Power BI
2️⃣ KPI Trend Page – Visual Growth Analysis
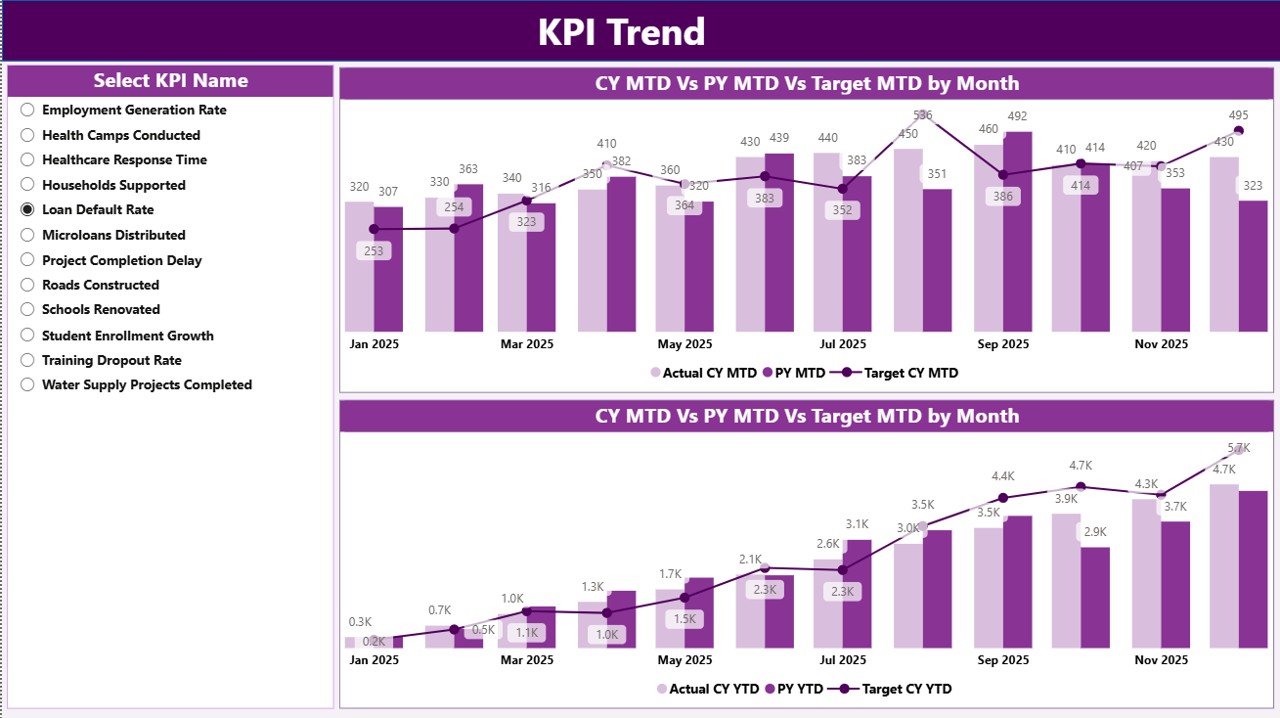
What Does This Page Include?
-
KPI Name Slicer (Left Panel)
-
2 Combo Charts:
-
MTD Trend Chart
-
YTD Trend Chart
-
Each combo chart shows:
-
Current Year Actual
-
Previous Year Actual
-
Target
Because of this, users can quickly compare trends month by month.
For example:
If rural road construction targets increase gradually, you can see whether actual progress matches planned growth.
3️⃣ KPI Definition Page – Drill Through Details
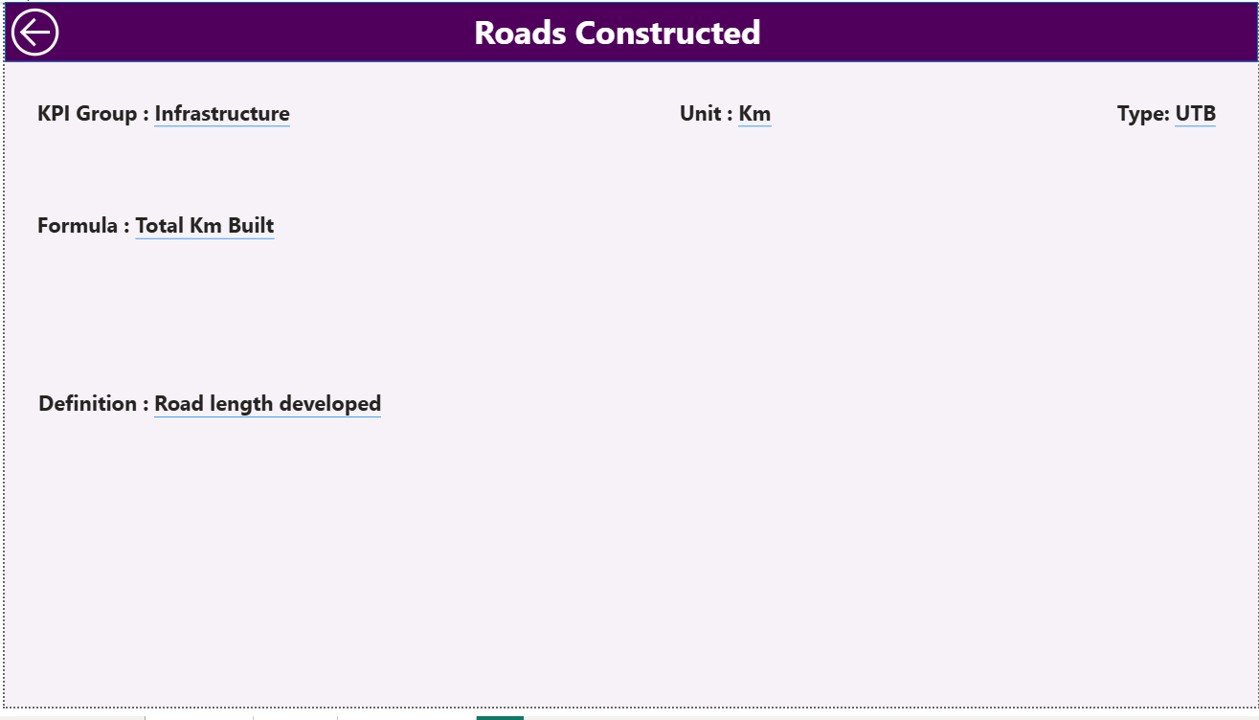
What Can You See Here?
-
KPI Number
-
KPI Group
-
KPI Name
-
Unit
-
Formula
-
KPI Definition
-
KPI Type
You can access this page by right-clicking on a KPI in the summary page and selecting drill-through.
After reviewing details, simply click the back button in the top-left corner.
As a result, users understand the calculation logic behind every KPI.
How Does the Excel Data Source Work?
The dashboard uses an Excel file as the data source. You must update three worksheets:
1️⃣ Input_Actual Sheet
Fill the following:
-
KPI Name
-
Month (use first date of month, e.g., 01-Jan-2025)
-
MTD Value
-
YTD Value
This sheet stores actual performance data.
2️⃣ Input_Target Sheet
Fill:
-
KPI Name
-
Month
-
MTD Target
-
YTD Target
This sheet stores planned targets.
3️⃣ KPI Definition Sheet
Fill:
-
KPI Number
-
KPI Group
-
KPI Name
-
Unit
-
Formula
-
Definition
-
Type (LTB or UTB)
Therefore, Excel acts as a structured backend, while Power BI handles visualization.
Which Rural Development KPIs Can You Track?
You can track multiple rural indicators such as:
Infrastructure KPIs
-
Rural Roads Completed (km)
-
Electrification Coverage (%)
-
Water Supply Projects Completed
-
Sanitation Coverage (%)
Agriculture KPIs
-
Crop Yield per Hectare
-
Farmer Training Programs Conducted
-
Irrigation Coverage (%)
Employment KPIs
-
Jobs Created
-
Skill Development Participation
-
Self-Help Groups Formed
Social Development KPIs
-
School Enrollment Rate
-
Healthcare Access Rate
-
Women Empowerment Participation
Because the dashboard supports KPI grouping, you can categorize these into Infrastructure, Agriculture, Employment, and Social Development.
Advantages of Rural Development KPI Dashboard in Power BI
Click to Purchases Rural Development KPI Dashboard in Power BI
A powerful dashboard delivers measurable benefits.
1️⃣ Centralized Monitoring
You can track all KPIs in one platform. Therefore, you eliminate confusion.
2️⃣ Real-Time Target Tracking
You instantly see which KPIs meet targets. Consequently, teams take corrective action faster.
3️⃣ Historical Comparison
You compare current performance with previous year data. As a result, you measure long-term progress.
4️⃣ Data-Driven Decisions
Leaders rely on visual insights rather than assumptions.
5️⃣ Time Savings
Automated calculations reduce manual effort significantly.
6️⃣ Transparency and Accountability
Clear metrics improve reporting to stakeholders and funding agencies.
Best Practices for the Rural Development KPI Dashboard
To get maximum value, follow these best practices.
✔ Update Data Monthly
Enter data consistently on the first date of every month.
✔ Define KPI Types Correctly
Always assign UTB or LTB correctly. Otherwise, the icon logic may show incorrect results.
✔ Maintain Clean Excel Data
Avoid blank rows and inconsistent naming.
✔ Review Target Accuracy
Ensure targets reflect realistic rural development goals.
✔ Use KPI Groups Strategically
Group KPIs logically for better filtering and reporting.
✔ Validate Formulas in KPI Definition
Double-check formulas before publishing reports.
How Does This Dashboard Improve Rural Governance?
A Rural Development KPI Dashboard strengthens governance because:
-
It increases transparency
-
It improves monitoring efficiency
-
It identifies underperforming projects
-
It supports funding justification
-
It aligns local actions with national goals
Moreover, when rural leaders see data clearly, they allocate resources more effectively.
Conclusion
Rural development requires consistent monitoring, accurate reporting, and clear accountability. However, manual systems slow down progress and increase errors.
The Rural Development KPI Dashboard in Power BI provides a structured, interactive, and powerful solution. It connects Excel data with dynamic visuals. It highlights target achievement instantly. Furthermore, it enables historical comparison and trend analysis.
Therefore, if you want to improve rural performance tracking, increase transparency, and support data-driven decisions, this dashboard offers the ideal solution.
Frequently Asked Questions with Answers
What is UTB and LTB in the dashboard?
UTB means Upper the Better. LTB means Lower the Better. The dashboard uses these types to evaluate KPI performance correctly.
How often should I update the data?
You should update the Excel file monthly. Always use the first date of the month for consistency.
Can I add new KPIs?
Yes. Simply add the KPI in the KPI Definition sheet and enter its actual and target data in respective sheets.
Do I need advanced Power BI knowledge?
No. The dashboard works as a ready-to-use file. You only update Excel data.
Can government departments use this dashboard?
Yes. Government agencies, NGOs, and rural development authorities can use this dashboard effectively.
Does the dashboard support previous year comparison?
Yes. It automatically calculates CY vs PY percentages for both MTD and YTD.
Visit our YouTube channel to learn step-by-step video tutorials