Managing transmission line construction projects requires speed, control, and clear performance tracking. However, many project teams still depend on scattered spreadsheets and manual reports. As a result, managers struggle to monitor progress, control budgets, and meet deadlines.
Therefore, companies now need a centralized, structured, and interactive monitoring system. The Transmission Line Construction KPI Dashboard in Power BI solves this challenge effectively. It transforms raw Excel data into dynamic visuals. Moreover, it helps project managers, engineers, EPC contractors, and executives track monthly and yearly performance in real time.
In this complete guide, you will learn:
-
What a Transmission Line Construction KPI Dashboard in Power BI is
-
Why transmission projects require structured KPI tracking
-
Detailed explanation of all dashboard pages
-
Excel data structure used in the solution
-
Advantages of the dashboard
-
Best practices for implementation
-
Frequently asked questions
Let’s explore everything step by step.
Click to Purchases Transmission Line Construction KPI Dashboard in Power BI
What Is a Transmission Line Construction KPI Dashboard in Power BI?
A Transmission Line Construction KPI Dashboard in Power BI is an interactive business intelligence solution designed to monitor key performance indicators for transmission infrastructure projects.
Instead of checking multiple Excel files, teams can:
-
Monitor monthly performance (MTD)
-
Track year-to-date performance (YTD)
-
Compare current year vs previous year
-
Evaluate target vs actual results
-
Analyze trends using dynamic charts
Because it works inside Power BI Desktop, users get powerful filtering, drill-through analysis, and automated calculations. Furthermore, it connects directly to Excel data, which makes data entry simple and structured.
Click to Purchases Transmission Line Construction KPI Dashboard in Power BI
Why Do Transmission Line Construction Projects Need KPI Tracking?
Transmission line construction involves land acquisition, tower erection, conductor stringing, substation connectivity, testing, and commissioning. Each stage affects cost, time, and quality.
However, when teams do not track KPIs properly:
-
Delays increase
-
Budget overruns occur
-
Resource allocation becomes inefficient
-
Safety risks grow
-
Management loses visibility
Therefore, structured KPI tracking becomes essential.
With this Power BI dashboard, companies gain:
-
Clear visibility of progress
-
Instant performance comparison
-
Quick identification of problem areas
-
Data-driven decision-making
As a result, project control improves significantly.
What Are the Key Features of Transmission Line Construction KPI Dashboard in Power BI?
This ready-to-use dashboard includes 3 structured pages inside the Power BI Desktop file. Each page serves a specific purpose.
Click to Purchases Transmission Line Construction KPI Dashboard in Power BI
1️⃣ Summary Page – The Main Control Center
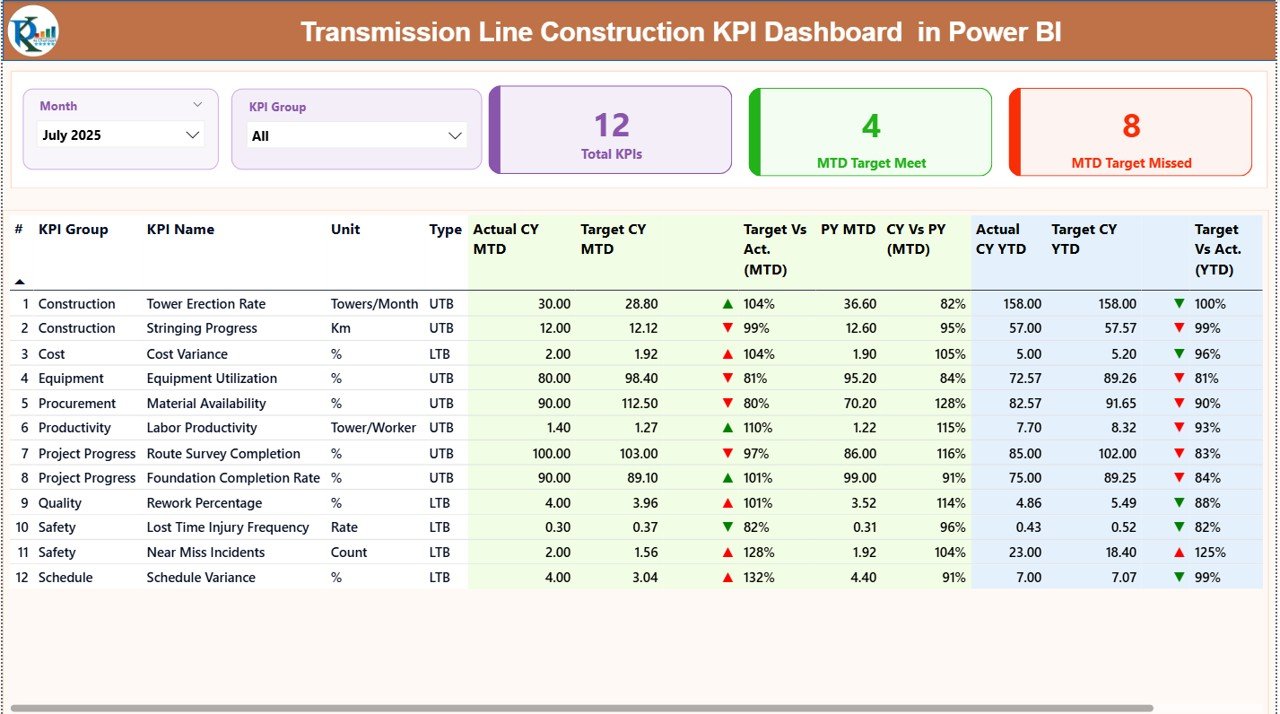
The Summary Page acts as the heart of the dashboard. It displays all KPIs in one structured view.
🔹 Slicers at the Top
At the top, you will find:
-
Month Slicer
-
KPI Group Slicer
Because of these slicers, users can filter data instantly. Once you select a month, the entire dashboard updates automatically.
🔹 KPI Performance Cards
Just below the slicers, you will see three key cards:
-
Total KPI Count
-
MTD Target Meet Count
-
MTD Target Missed Count
These cards provide a quick health check of the project. Therefore, managers can understand overall performance in seconds.
🔹 Detailed KPI Performance Table
Below the cards, the dashboard shows a structured KPI table with the following fields:
-
KPI Number – Sequence number of KPI
-
KPI Group – Category of KPI
-
KPI Name – Name of performance indicator
-
Unit – Measurement unit
-
Type – LTB (Lower the Better) or UTB (Upper the Better)
🔹 MTD Performance Section
The dashboard shows:
-
Actual CY MTD – Current Year Month-to-Date value
-
Target CY MTD – Target value for the month
-
MTD Icon (▲ / ▼) – Green or Red indicator
-
Target vs Actual (MTD) – Percentage calculation
-
Formula:
Actual MTD / Target MTD
-
-
PY MTD – Previous Year MTD value
-
CY vs PY (MTD) – Comparison percentage
-
Formula:
CY MTD / PY MTD
-
Because of these comparisons, teams can evaluate performance against both targets and past trends.
🔹 YTD Performance Section
Similarly, the dashboard displays:
-
Actual CY YTD
-
Target CY YTD
-
YTD Icon (▲ / ▼)
-
Target vs Actual (YTD)
-
Formula:
Actual YTD / Target YTD
-
-
PY YTD
-
CY vs PY (YTD)
-
Formula:
CY YTD / PY YTD
-
Therefore, users gain complete visibility of both short-term and long-term performance.
Click to Purchases Transmission Line Construction KPI Dashboard in Power BI
2️⃣ KPI Trend Page – Visual Performance Analysis
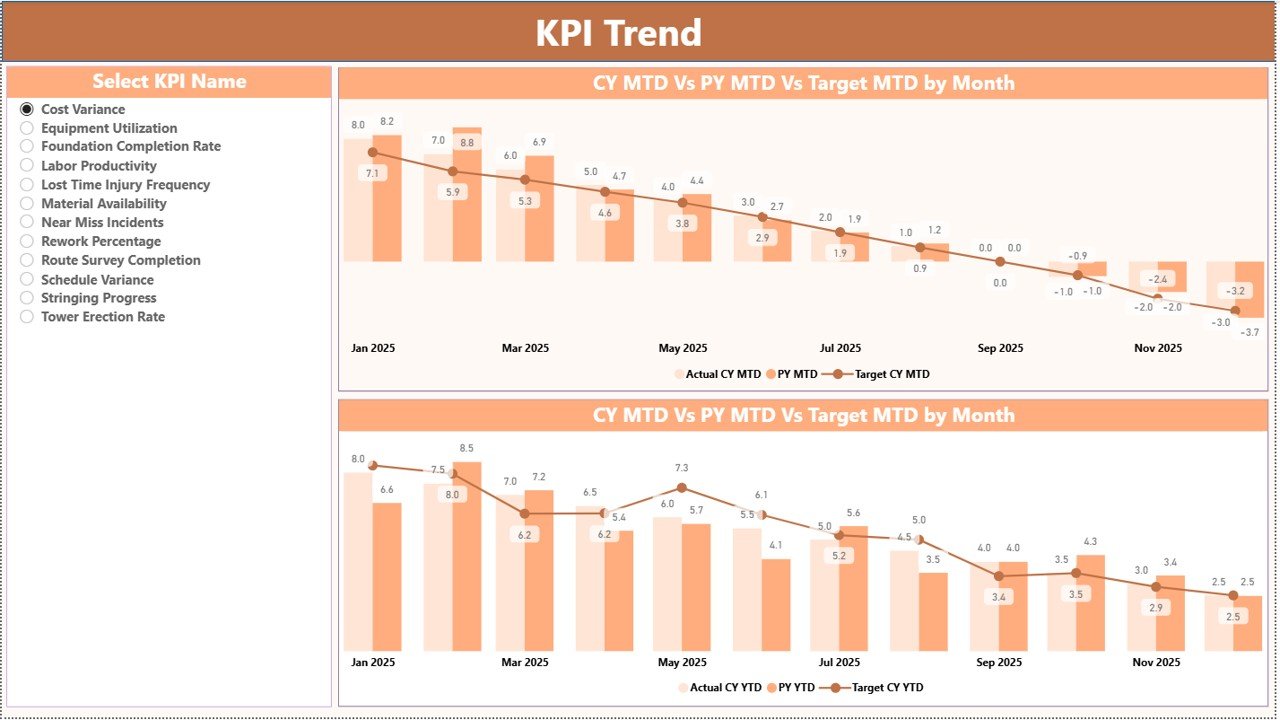
The KPI Trend Page helps users analyze historical trends visually.
🔹 Two Combo Charts
This page displays two powerful combo charts:
-
MTD Trend Chart
-
YTD Trend Chart
Each chart shows:
-
Current Year Actual
-
Previous Year Actual
-
Target Values
Because of this layout, managers can easily detect improvement or decline patterns.
🔹 KPI Selection Slicer
On the left side, a slicer allows users to select any KPI. Once selected, both charts update automatically.
As a result, performance analysis becomes fast and focused.
Click to Purchases Transmission Line Construction KPI Dashboard in Power BI
3️⃣ KPI Definition Page – Drill-Through Insight
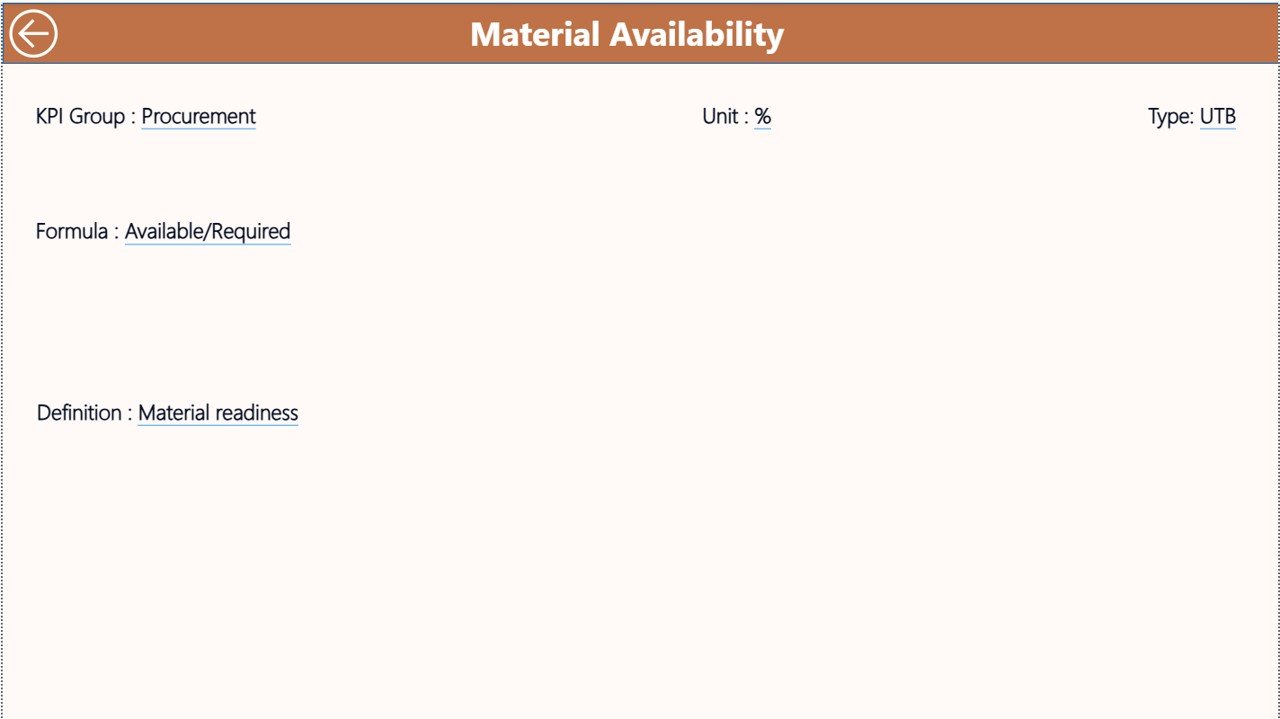
The KPI Definition Page remains hidden. However, users can drill through from the Summary Page.
This page displays:
-
KPI Formula
-
KPI Definition
-
KPI Group
-
KPI Type
Therefore, stakeholders can understand the logic behind each KPI.
To return, users simply click the back button at the top left corner.
How Does the Excel Data Structure Work?
The dashboard connects directly to an Excel file. Therefore, data entry remains simple and structured.
The Excel file includes three worksheets.
1️⃣ Input_Actual Sheet
In this sheet, users enter:
-
KPI Name
-
Month (First date of month)
-
MTD value
-
YTD value
Because you only fill actual numbers, maintenance remains easy.
2️⃣ Input_Target Sheet
Here, users enter:
-
KPI Name
-
Month
-
Target MTD
-
Target YTD
Therefore, Power BI calculates performance automatically.
3️⃣ KPI Definition Sheet
In this sheet, users fill:
-
KPI Number
-
KPI Group
-
KPI Name
-
Unit
-
Formula
-
Definition
-
Type (LTB or UTB)
Because the dashboard reads this structure, it categorizes KPIs correctly.
Click to Purchases Transmission Line Construction KPI Dashboard in Power BI
What KPIs Can You Track in Transmission Line Construction?
You can track multiple categories such as:
🔹 Progress KPIs
-
Tower Erection Completion %
-
Foundation Completion %
-
Stringing Progress %
🔹 Cost KPIs
-
Cost Variance %
-
Budget Utilization %
-
Cost per KM
🔹 Safety KPIs
-
Lost Time Injury Frequency Rate
-
Safety Incidents Count
-
Near Miss Reports
🔹 Quality KPIs
-
Rework Percentage
-
Inspection Pass Rate
Because of this flexibility, companies can customize KPIs based on project requirements.
Click to Purchases Transmission Line Construction KPI Dashboard in Power BI
Advantages of Transmission Line Construction KPI Dashboard in Power BI
This dashboard offers several advantages.
1️⃣ Real-Time Performance Monitoring
You can instantly track performance. Therefore, decision-making becomes faster.
2️⃣ Centralized Data View
All KPIs appear in one place. As a result, managers avoid scattered reports.
3️⃣ Automated Calculations
Power BI calculates percentages and comparisons automatically. Therefore, manual errors reduce significantly.
4️⃣ Trend Analysis
Combo charts help identify performance trends quickly.
5️⃣ Target Tracking
Green and red indicators show performance status clearly.
6️⃣ Drill-Through Capability
Users can access detailed KPI definitions instantly.
7️⃣ Improved Project Control
Better visibility leads to better project management.
Click to Purchases Transmission Line Construction KPI Dashboard in Power BI
Best Practices for Transmission Line Construction KPI Dashboard in Power BI
To maximize results, follow these best practices.
1️⃣ Define Clear KPIs
Choose measurable and realistic KPIs. Avoid vague indicators.
2️⃣ Update Data Monthly
Enter data consistently at the start of each month.
3️⃣ Validate Data Accuracy
Check Excel inputs before refreshing Power BI.
4️⃣ Categorize KPIs Properly
Use correct KPI groups such as Progress, Cost, Safety, and Quality.
5️⃣ Use LTB and UTB Correctly
Mark KPIs properly as Lower the Better or Upper the Better.
6️⃣ Review Trends Regularly
Analyze both MTD and YTD charts. Therefore, you can detect issues early.
7️⃣ Share Insights with Teams
Present dashboard findings during project review meetings.
Click to Purchases Transmission Line Construction KPI Dashboard in Power BI
How Does This Dashboard Improve Decision-Making?
Because the dashboard provides instant comparisons, managers identify problems quickly.
For example:
-
If MTD performance drops below target, managers can allocate more resources.
-
If cost variance increases, finance teams can control spending.
-
If safety incidents rise, supervisors can enforce stricter safety measures.
Therefore, the dashboard supports proactive management rather than reactive action.
Who Should Use This Dashboard?
This solution benefits:
-
EPC Contractors
-
Project Managers
-
Construction Engineers
-
Power Transmission Companies
-
Government Infrastructure Agencies
Because it provides clarity and structure, it suits both small and large projects.
Conclusion
Transmission line construction projects demand accuracy, speed, and strong control. However, traditional reporting methods often fail to deliver real-time visibility.
Therefore, the Transmission Line Construction KPI Dashboard in Power BI provides a powerful and structured solution. It centralizes data, automates calculations, and delivers actionable insights.
Moreover, it simplifies complex project data into clear visuals. As a result, managers gain better control, reduce risks, and improve overall performance.
If you want stronger project monitoring and smarter decision-making, this dashboard becomes an essential tool.
Click to Purchases Transmission Line Construction KPI Dashboard in Power BI
Frequently Asked Questions (FAQs)
1️⃣ What is MTD and YTD in this dashboard?
MTD stands for Month-to-Date performance. YTD stands for Year-to-Date performance.
2️⃣ Can I customize KPIs?
Yes, you can modify KPIs in the KPI Definition Excel sheet.
3️⃣ Do I need advanced Power BI skills?
No. You only need to update Excel data and refresh the dashboard.
4️⃣ Can I add new KPI groups?
Yes, simply define them in the KPI Definition sheet.
5️⃣ How often should I update data?
You should update data monthly. However, you can update it more frequently if needed.
6️⃣ Does the dashboard support drill-through analysis?
Yes. You can drill through to view KPI formulas and definitions.
7️⃣ Can this dashboard handle multiple projects?
Yes, you can expand the Excel data structure to support multiple projects.
Click to Purchases Transmission Line Construction KPI Dashboard in Power BI
Visit our YouTube channel to learn step-by-step video tutorials