Modern manufacturing industries are rapidly adopting 3D printing technology, also known as additive manufacturing, to produce complex parts with high precision and efficiency. However, as production volume increases, manufacturers must monitor costs, materials, labor, machine usage, and profitability carefully.
Without a structured analytical system, companies often struggle to understand production performance, track manufacturing costs, and identify operational inefficiencies.
Therefore, organizations require a centralized analytical tool that converts manufacturing data into clear insights. This is exactly where the 3D Printing Manufacturing Dashboard in Excel becomes extremely valuable.
The 3D Printing Manufacturing Dashboard in Excel is a ready-to-use analytical tool designed to monitor production performance, track costs, evaluate profitability, and analyze manufacturing trends across different plant locations, material types, and product categories.
Because Excel provides powerful analytical features such as charts, pivot tables, slicers, and conditional formatting, manufacturers can easily transform raw production data into meaningful business insights.
In this comprehensive guide, you will learn everything about the 3D Printing Manufacturing Dashboard in Excel, including its features, benefits, analysis capabilities, best practices, and practical implementation strategies.
Click to buy 3D Printing Manufacturing Dashboard in Excel
What Is a 3D Printing Manufacturing Dashboard in Excel?
A 3D Printing Manufacturing Dashboard in Excel is a structured data visualization system that helps manufacturers monitor important production metrics such as:
- Production cost
- Revenue
- Labor hours
- Material usage
- Machine expenses
- Profit margins
- Quality performance
Instead of analyzing scattered spreadsheets, managers can view all manufacturing KPIs in one centralized dashboard.
Moreover, the dashboard provides interactive analysis across:
- Plant locations
- Material types
- Product categories
- Monthly performance trends
As a result, production managers can quickly identify cost issues, optimize resources, and improve manufacturing efficiency.
Why Do Manufacturers Need a 3D Printing Dashboard?
3D printing manufacturing involves multiple variables. For example:
- Different materials such as PLA, ABS, Nylon, or Resin
- Multiple production plants
- Various product types
- Machine operating costs
- Labor hours
- Material consumption
Therefore, tracking these variables manually becomes extremely difficult.
A manufacturing dashboard simplifies decision-making because it:
- Consolidates data into one system
- Displays visual analytics
- Helps identify trends quickly
- Supports cost optimization
- Improves production planning
Consequently, organizations can make faster and more accurate operational decisions.
Key Features of the 3D Printing Manufacturing Dashboard in Excel
The 3D Printing Manufacturing Dashboard in Excel contains multiple analytical pages that provide deep insights into manufacturing performance.
The dashboard typically includes the following sheets.
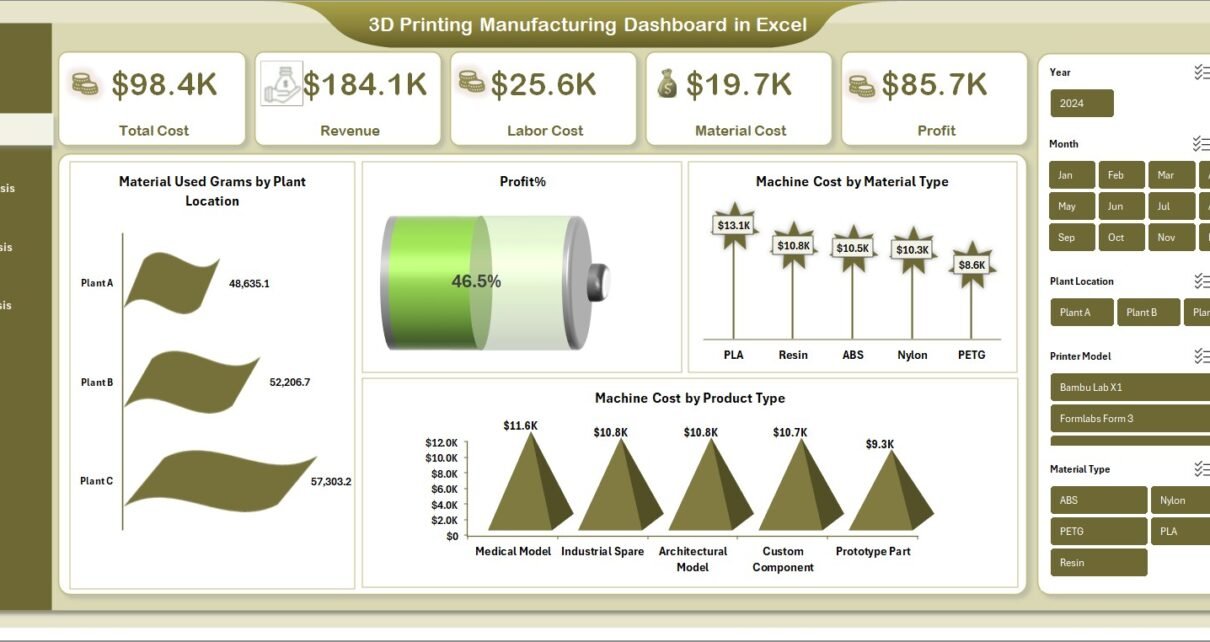
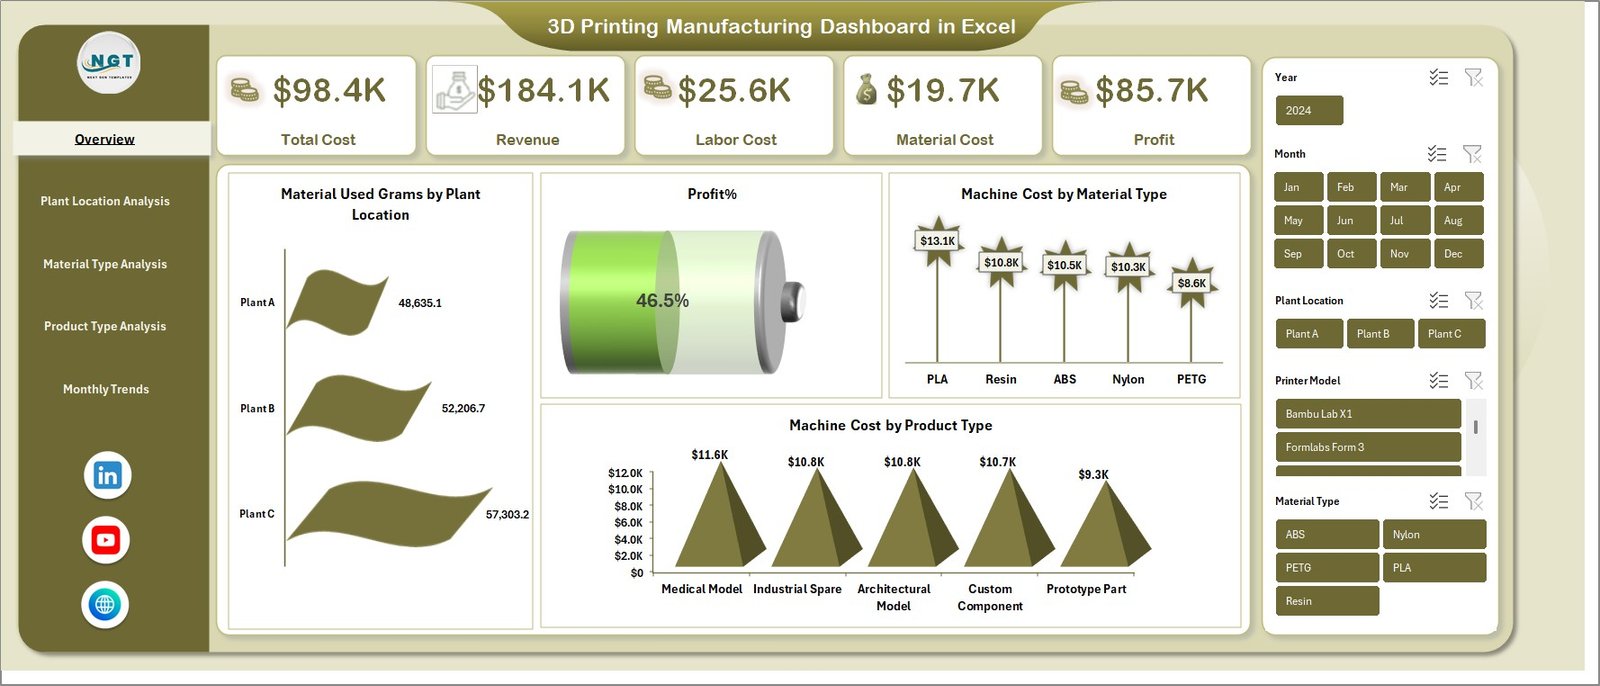
Overview Dashboard – Complete Manufacturing Snapshot
The Overview page acts as the main control center of the dashboard. It provides a quick summary of overall manufacturing performance.
Key KPIs displayed in this section include:
- Total Cost
- Revenue
- Labor Cost
- Material Cost
- Profit Percentage
These indicators allow decision-makers to understand overall profitability immediately.
Key Charts on the Overview Page
The overview dashboard includes several visual charts such as:
- Material Used (Grams) by Plant Location
This chart shows how much material each production facility consumes. - Machine Cost by Material Type
Helps identify which materials generate higher machine usage costs. - Machine Cost by Product Type
Shows which product categories require higher machine investment.
Because this page presents high-level insights, managers can quickly evaluate production health before exploring detailed analysis.
Click to buy 3D Printing Manufacturing Dashboard in Excel
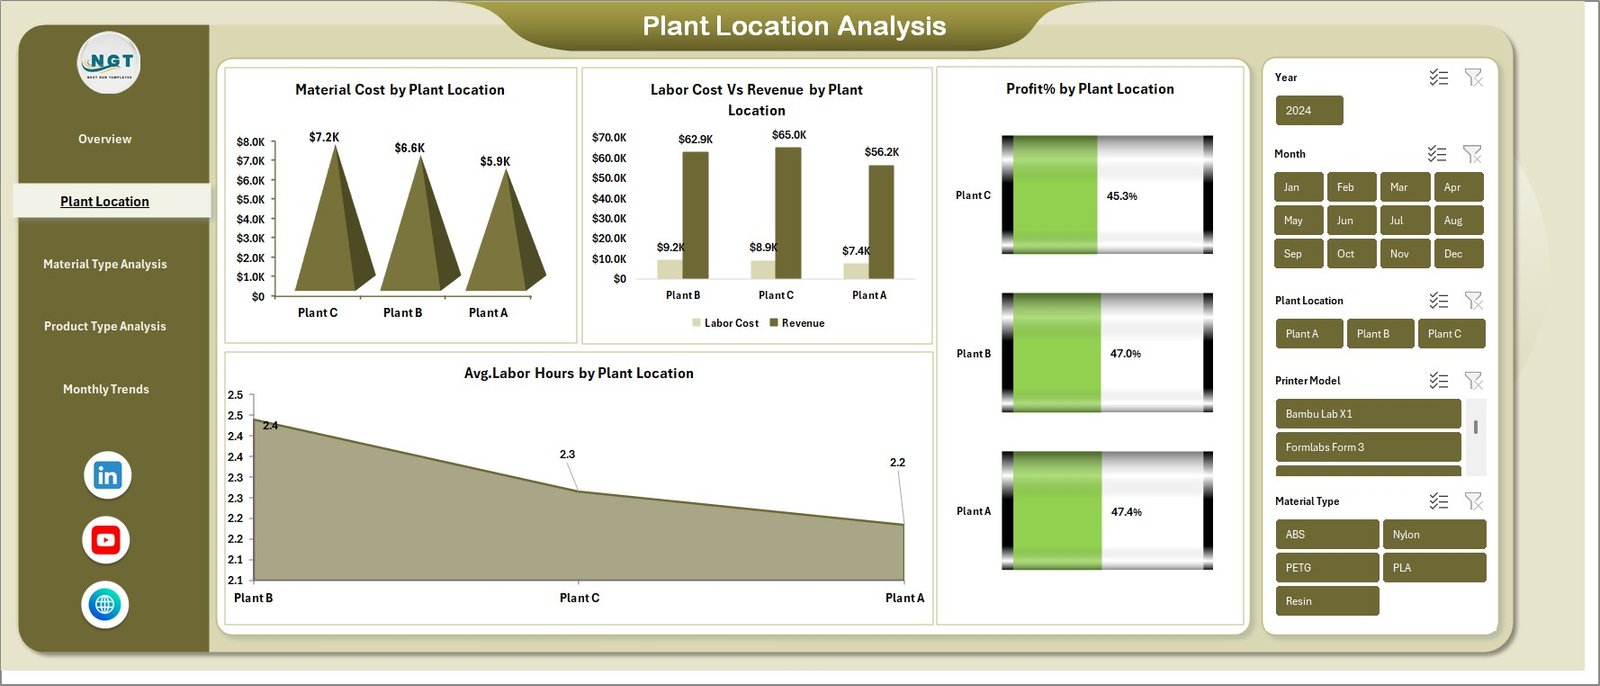
Plant Location Analysis – Which Facility Performs Better?
Manufacturers often operate multiple plants across different locations. However, production efficiency can vary significantly between facilities.
Therefore, the Plant Location Analysis page focuses on comparing plant performance.
Charts Available in This Section
The dashboard provides the following insights:
- Material Cost by Plant Location
Identifies which plant consumes more material resources. - Labor Cost vs Revenue by Plant Location
Helps compare production labor costs with generated revenue. - Profit Percentage by Plant Location
Displays which facility operates most efficiently. - Average Labor Hours by Plant Location
Highlights productivity differences between facilities.
As a result, management can easily identify high-performing plants and underperforming facilities.
Click to buy 3D Printing Manufacturing Dashboard in Excel
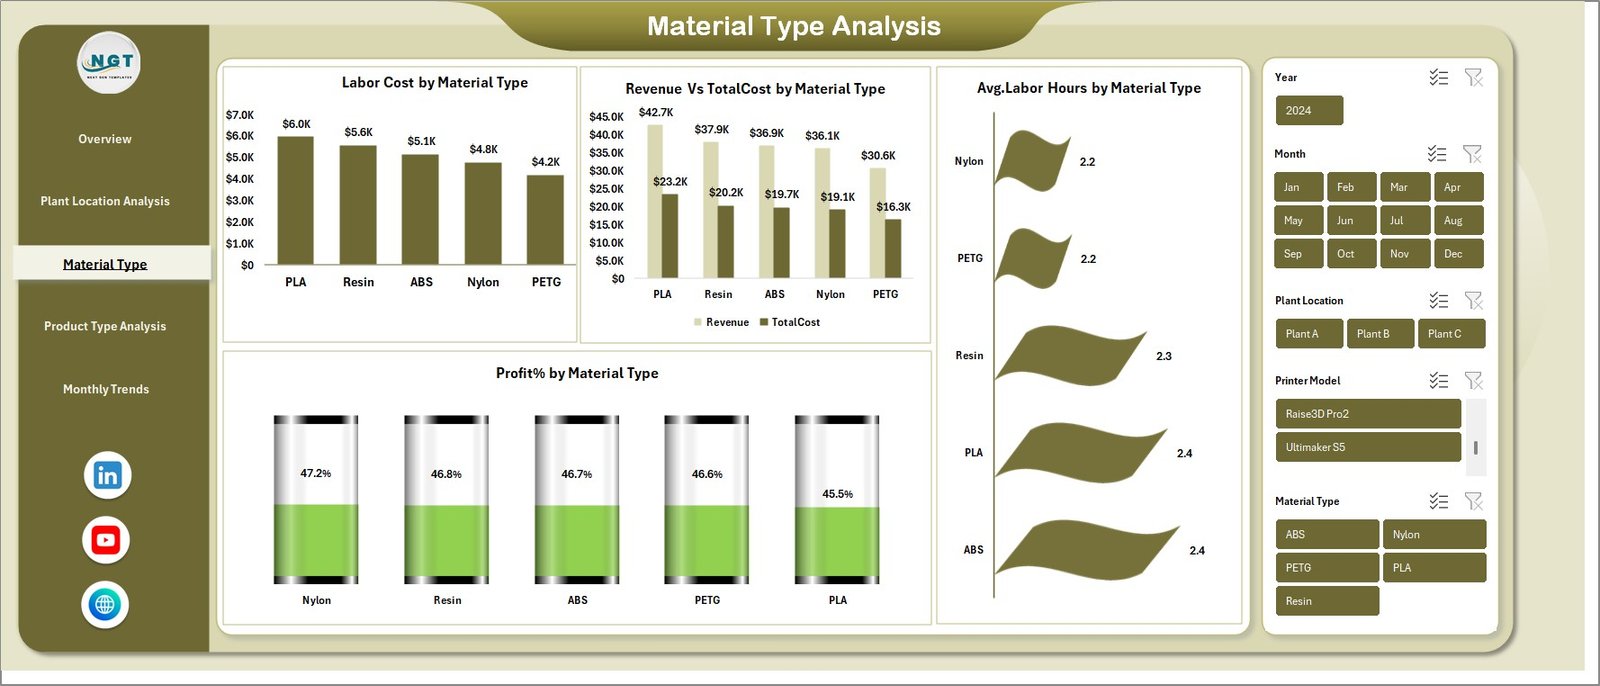
Material Type Analysis – Which Materials Drive Profit?
Different materials impact production cost, machine time, and product quality differently.
Therefore, understanding material-level performance becomes essential.
The Material Type Analysis page provides deep insights into material usage and profitability.
Key Charts Included
- Labor Cost by Material Type
- Revenue vs Total Cost by Material Type
- Average Labor Hours by Material Type
- Profit Percentage by Material Type
These insights help manufacturers determine:
- Which materials produce higher profit margins
- Which materials require more labor hours
- Which materials increase production cost
Consequently, organizations can optimize material selection strategies.
Click to buy 3D Printing Manufacturing Dashboard in Excel
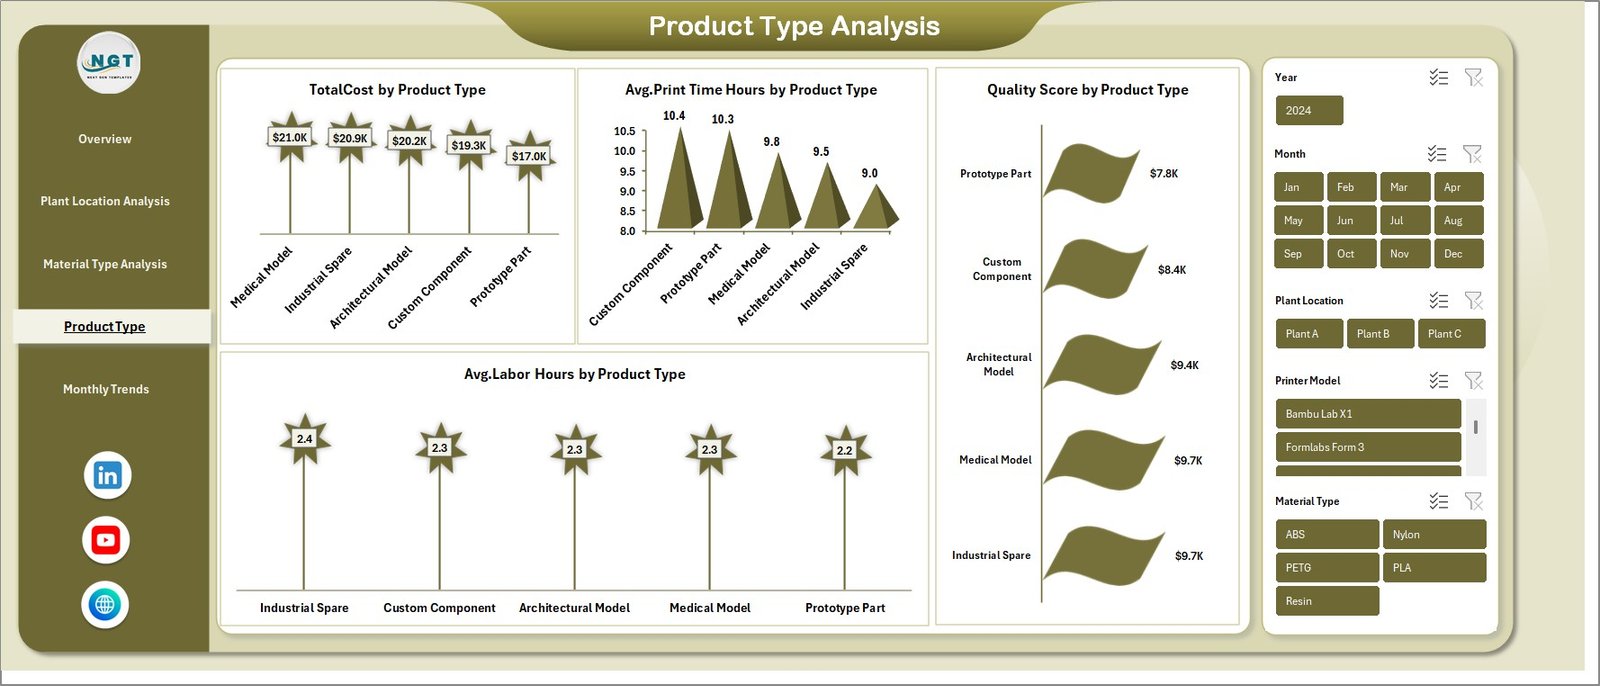
Product Type Analysis – Which Products Are Most Profitable?
In 3D printing manufacturing, companies often produce various product types such as:
- Prototypes
- Industrial components
- Custom tools
- Medical parts
- Consumer goods
However, not all products generate equal profitability.
The Product Type Analysis page evaluates product-level manufacturing performance.
Important Charts
This section includes:
- Total Cost by Product Type
- Average Print Time Hours by Product Type
- Average Labor Hours by Product Type
- Quality Score by Product Type
These insights allow managers to identify:
- High-cost product categories
- Products requiring longer printing time
- Products with higher quality performance
Therefore, companies can focus on high-margin product categories.
Click to buy 3D Printing Manufacturing Dashboard in Excel
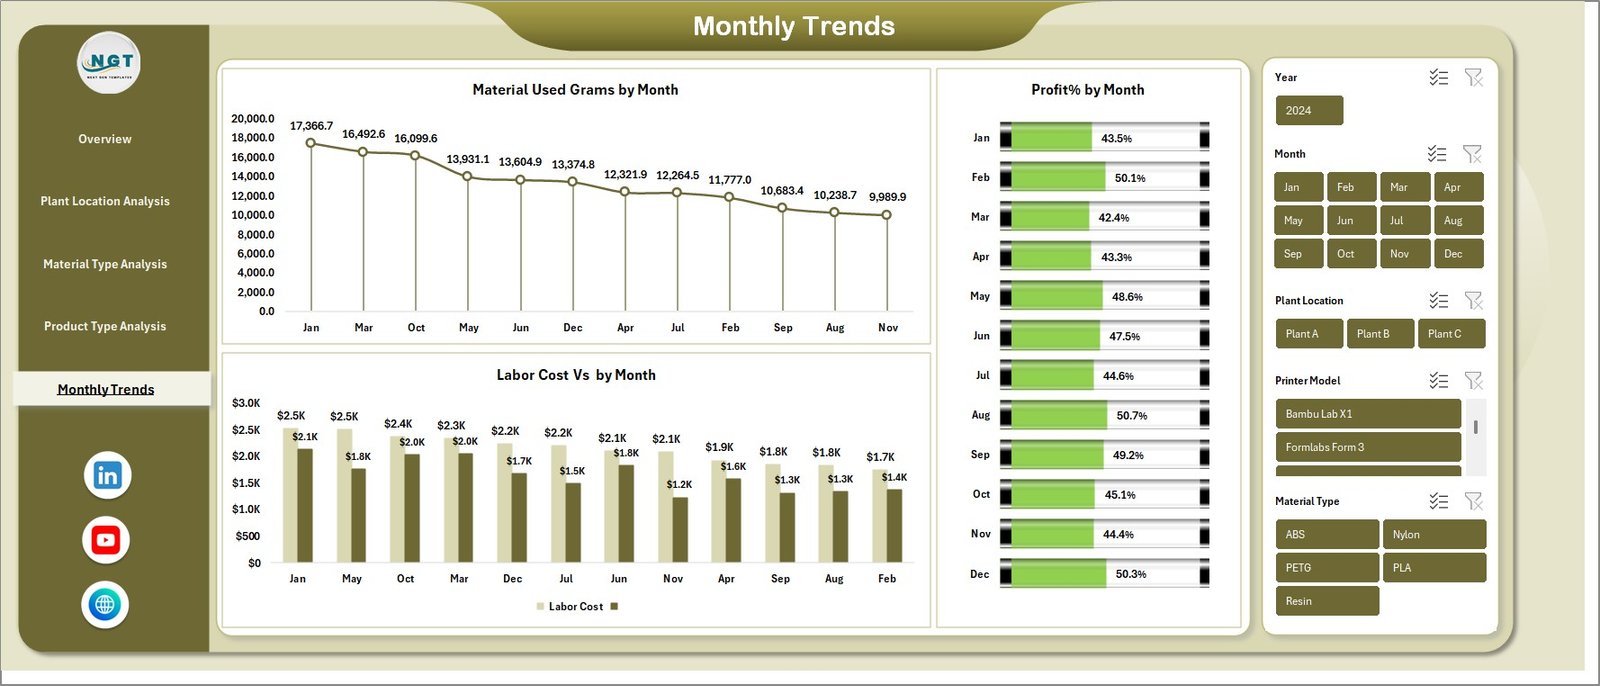
Monthly Trends Analysis – How Does Production Change Over Time?
Manufacturing performance changes throughout the year due to:
- Seasonal demand
- Raw material price fluctuations
- Production volume changes
Therefore, the Monthly Trends page helps analyze production performance over time.
Key Monthly Charts
- Material Used (Grams) by Month
- Labor Cost by Month
- Profit Percentage by Month
These charts help managers identify:
- Seasonal production patterns
- Rising manufacturing costs
- Profit fluctuations across months
Consequently, organizations can improve production forecasting and financial planning.
Click to buy 3D Printing Manufacturing Dashboard in Excel
Advantages of the 3D Printing Manufacturing Dashboard in Excel
Implementing a manufacturing dashboard offers several advantages for production teams.
- Centralized Production Monitoring
- Managers can track all manufacturing metrics from one dashboard instead of reviewing multiple reports.
- Faster Decision Making
- Visual charts simplify complex data. Therefore, managers can identify trends quickly.
- Cost Control
- The dashboard highlights labor, machine, and material costs clearly. As a result, companies can control unnecessary expenses.
- Profitability Tracking
- The system continuously monitors profit margins and revenue performance.
- Production Efficiency Improvement
- Managers can analyze labor hours, machine usage, and material consumption to improve productivity.
- Better Resource Planning
- Because the dashboard displays production insights clearly, companies can allocate resources more effectively.
- What KPIs Should a 3D Printing Manufacturing Dashboard Track?
- A well-designed manufacturing dashboard should monitor several key performance indicators.
Important KPIs include:
- Production Cost
- Revenue
- Profit Margin %
- Material Consumption (grams)
- Machine Cost
- Labor Cost
- Average Print Time
- Average Labor Hours
- Quality Score
- Production Volume
Tracking these KPIs ensures data-driven manufacturing decisions.
Best Practices for the 3D Printing Manufacturing Dashboard in Excel
To get the best results from the dashboard, organizations should follow these best practices.
Maintain Accurate Data Entry
Accurate data ensures reliable insights. Therefore, companies must maintain structured production records.
Standardize Manufacturing Data
Use consistent formats for:
- Material types
- Plant locations
- Product categories
This practice improves analysis accuracy.
Update the Dashboard Regularly
Regular data updates ensure that managers always work with latest production insights.
Use Visual Indicators
Conditional formatting and KPI indicators help highlight:
- High costs
- Low profit margins
- Performance improvements
Keep the Dashboard Simple
Clear charts and simple layouts make dashboards easier to understand.
Opportunities for Improvement in 3D Printing Manufacturing Analytics
Even though dashboards provide valuable insights, companies can still improve their analytics systems.
Possible improvements include:
- Integrating real-time production data
- Adding machine utilization tracking
- Monitoring energy consumption
- Tracking print failure rates
- Integrating inventory management systems
These improvements can further enhance manufacturing efficiency.
How Can Companies Implement This Dashboard Successfully?
Organizations should follow a structured approach when implementing a manufacturing dashboard.
Step 1 – Collect Production Data
Gather data related to:
- Material usage
- Labor hours
- Machine costs
- Production revenue
Step 2 – Organize Data in Excel
Create structured data tables with columns such as:
- Plant Location
- Material Type
- Product Type
- Print Time
- Labor Hours
- Cost
- Revenue
Step 3 – Create Pivot Tables
Pivot tables allow dynamic analysis of manufacturing performance.
Step 4 – Build Charts and Visualizations
Use charts such as:
- Bar charts
- Line charts
- Column charts
- KPI indicators
Step 5 – Create Dashboard Layout
Combine all visuals into one structured dashboard sheet.
Conclusion
3D printing manufacturing continues to transform modern production systems. However, companies must monitor production data carefully to maintain efficiency and profitability.
The 3D Printing Manufacturing Dashboard in Excel provides a powerful analytical solution that converts raw manufacturing data into meaningful insights.
Because the dashboard includes analysis for plant locations, materials, product types, and monthly trends, managers can quickly identify operational opportunities and optimize production strategies.
Therefore, organizations that implement structured manufacturing dashboards gain a significant advantage in operational efficiency, cost control, and data-driven decision making.
Frequently Asked Questions (FAQs)
What is a 3D Printing Manufacturing Dashboard?
A 3D Printing Manufacturing Dashboard is a visual analytics system that tracks production performance, costs, labor hours, and profitability for additive manufacturing operations.
Why should manufacturers use an Excel dashboard?
Excel dashboards help manufacturers organize production data, analyze trends, and make faster operational decisions using charts and KPI indicators.
What data is required to create this dashboard?
The dashboard requires production data such as:
- Material usage
- Labor hours
- Machine costs
- Revenue
- Product type
- Plant location
Can this dashboard track multiple production plants?
Yes. The dashboard supports multi-plant analysis, allowing managers to compare performance across different manufacturing facilities.
Can small manufacturers use this dashboard?
Absolutely. Because Excel is widely available, both small and large manufacturing companies can use this dashboard effectively.
Visit our YouTube channel to learn step-by-step video tutorials
Watch the step-by-step video tutorial:
Click to buy 3D Printing Manufacturing Dashboard in Excel