The manufacturing industry has entered a new technological era with the rise of 3D printing, also known as additive manufacturing. Companies across aerospace, automotive, healthcare, electronics, and consumer products increasingly rely on 3D printing to produce complex parts faster and more efficiently.
However, while 3D printing offers incredible flexibility and speed, manufacturers still face several challenges. They must monitor production costs, material consumption, machine utilization, labor hours, product performance, and profitability. When teams store this information in scattered reports or multiple spreadsheets, managers struggle to understand the overall performance of the manufacturing process.
Therefore, organizations require a centralized analytics solution that transforms production data into clear insights. This is exactly where the 3D Printing Manufacturing Dashboard in Power BI becomes extremely valuable.
The 3D Printing Manufacturing Dashboard in Power BI is a ready-to-use analytics solution that helps manufacturers track production metrics, monitor operational efficiency, analyze material consumption, and evaluate financial performance. Because Power BI provides powerful visualization, filtering, and data modeling capabilities, decision-makers can easily transform raw manufacturing data into interactive dashboards.
In this comprehensive guide, you will learn everything about the 3D Printing Manufacturing Dashboard in Power BI, including its features, structure, advantages, best practices, and how manufacturers can use it to improve operational efficiency.
Click to buy 3D Printing Manufacturing Dashboard in Power BI
What is a 3D Printing Manufacturing Dashboard in Power BI?
A 3D Printing Manufacturing Dashboard in Power BI is an interactive business intelligence tool that helps organizations monitor the performance of their additive manufacturing operations.
Instead of reviewing multiple spreadsheets or disconnected reports, manufacturers can visualize all important performance indicators in a single dashboard.
The dashboard tracks several operational and financial indicators such as:
- Production cost
- Revenue generated
- Material consumption
- Labor hours
- Machine operating cost
- Product performance
- Profit margins
Because Power BI connects data from multiple sources, the dashboard continuously transforms production data into meaningful insights. As a result, managers quickly identify inefficiencies, reduce operational costs, and improve overall production performance.
Furthermore, the dashboard allows users to filter and analyze data by plant location, material type, product type, and month. Consequently, manufacturers gain deeper visibility into their operations.
Why Do Manufacturers Need a 3D Printing Dashboard?
3D printing involves many variables. Each printed component requires specific materials, machine time, labor hours, and energy consumption. If organizations do not track these variables carefully, production costs increase and profitability declines.
Therefore, manufacturers need a structured monitoring system.
A 3D Printing Manufacturing Dashboard helps organizations:
- Monitor production efficiency
- Track machine costs and material consumption
- Identify high-cost manufacturing processes
- Analyze profitability across product categories
- Improve operational planning
- Support better decision-making
Moreover, the dashboard provides real-time insights, which allow managers to react quickly to production issues.
Key Features of the 3D Printing Manufacturing Dashboard in Power BI
The 3D Printing Manufacturing Dashboard in Power BI includes five interactive pages that analyze manufacturing performance from different perspectives.
These pages include:
- Overview Page
- Plant Location Analysis
- Material Type Analysis
- Product Type Analysis
- Month Analysis
Each page focuses on specific operational insights.
Let’s explore each page in detail.
Overview Page – How Does It Summarize Manufacturing Performance?
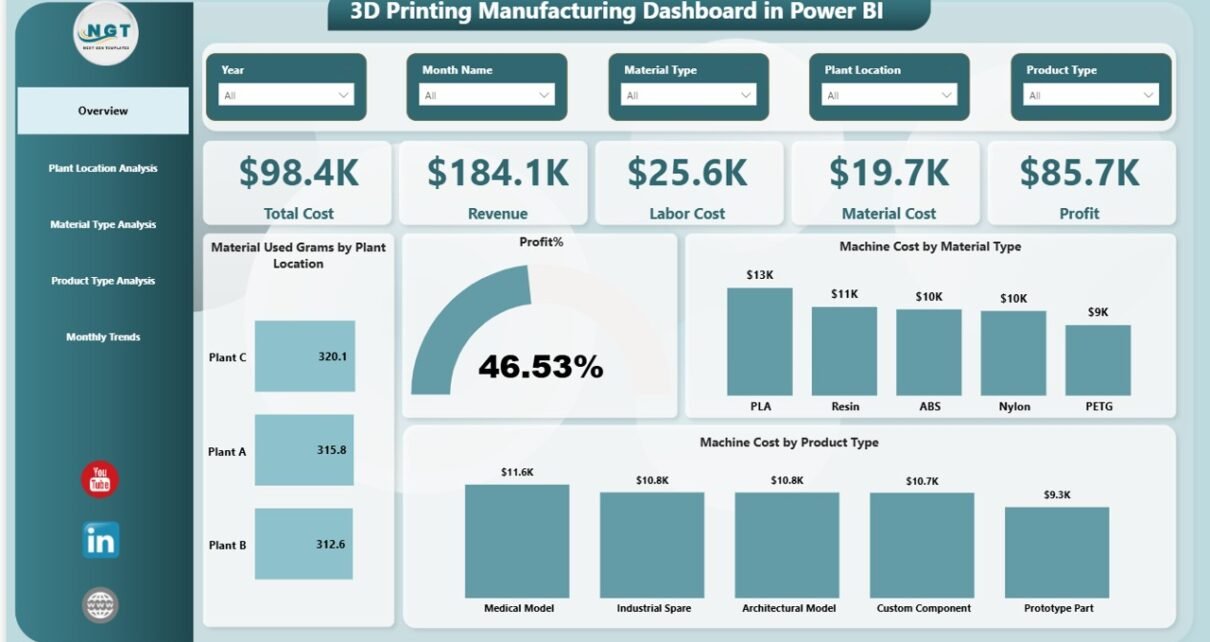
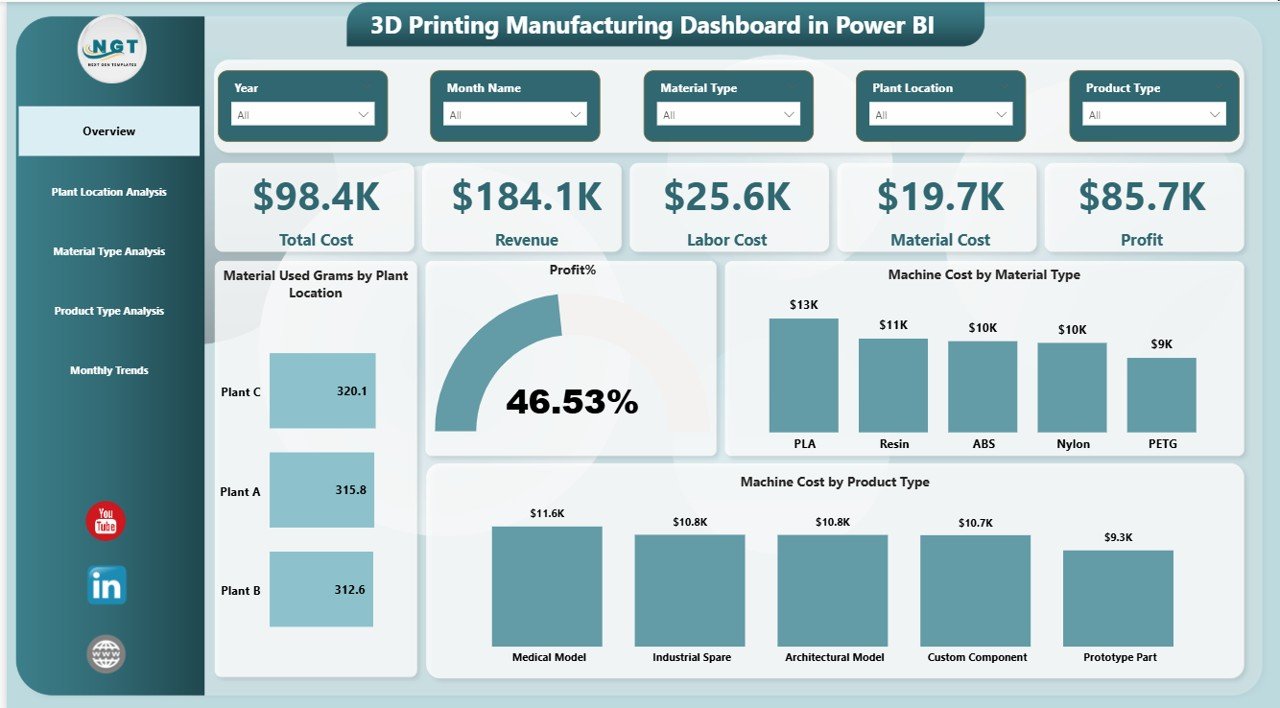
The Overview Page acts as the main page of the dashboard. It provides a quick snapshot of the entire 3D printing operation.
This page includes interactive slicers, which allow users to filter the dashboard data easily.
KPI Cards
The dashboard displays five important KPI cards:
- Total Cost – Total production cost across all manufacturing activities
- Revenue – Total revenue generated from printed products
- Labor Cost – Total labor expenses related to manufacturing
- Material Cost – Cost of raw materials used in printing
- Profit – Net profit after deducting manufacturing costs
These KPI cards allow decision-makers to quickly evaluate the overall financial health of the manufacturing process.
Charts in the Overview Page
The Overview Page also includes four analytical charts:
- Material Used (Grams) by Plant Location
This chart shows how much raw material each plant location consumes.
As a result, manufacturers easily identify which plant uses the most material.
- Profit Percentage
This visualization highlights the overall profitability of the manufacturing process.
Therefore, managers quickly evaluate whether production operations remain financially sustainable.
- Machine Cost by Material Type
Different printing materials often require different machine settings and processing time.
This chart helps manufacturers understand how machine costs vary across material types.
- Machine Cost by Product Type
This visualization highlights the cost associated with producing different product categories.
Consequently, managers can identify high-cost products and optimize production strategies.
Click to buy 3D Printing Manufacturing Dashboard in Power BI
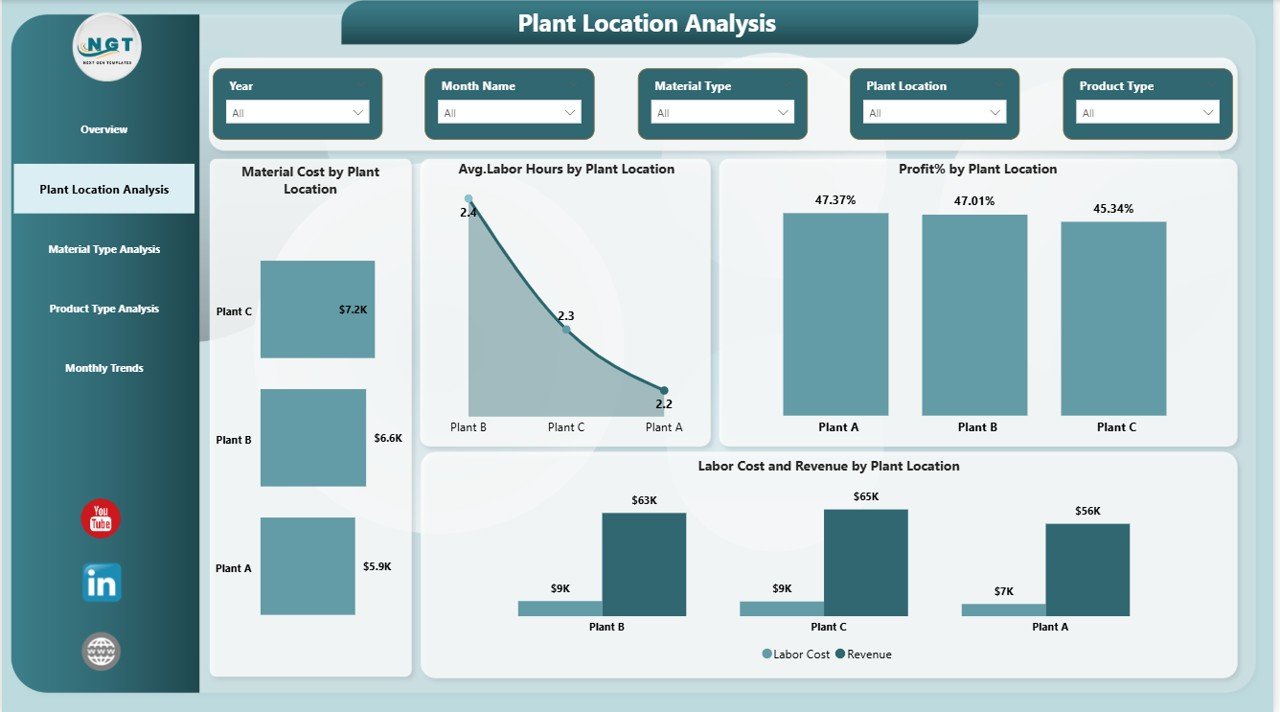
Plant Location Analysis – How Do Different Plants Perform?
Manufacturers often operate multiple production facilities across different locations. Each facility may have unique operating conditions, equipment, and workforce.
Therefore, comparing plant performance becomes extremely important.
The Plant Location Analysis Page helps decision-makers analyze operational efficiency across different manufacturing plants.
Charts Available on This Page
Material Cost by Plant Location
This chart compares material consumption costs across manufacturing plants.
Managers can quickly detect which plant operates more efficiently.
Average Labor Hours by Plant Location
This visualization shows the average labor hours required for production.
If a plant requires significantly more labor hours, managers can investigate operational inefficiencies.
Profit Percentage by Plant Location
This chart highlights profitability levels across plants.
Therefore, organizations can identify high-performing facilities.
Labor Cost and Revenue by Plant Location
This combined visualization helps managers compare production costs and revenue generation across locations.
As a result, decision-makers gain a clear understanding of plant-level financial performance.
Click to buy 3D Printing Manufacturing Dashboard in Power BI
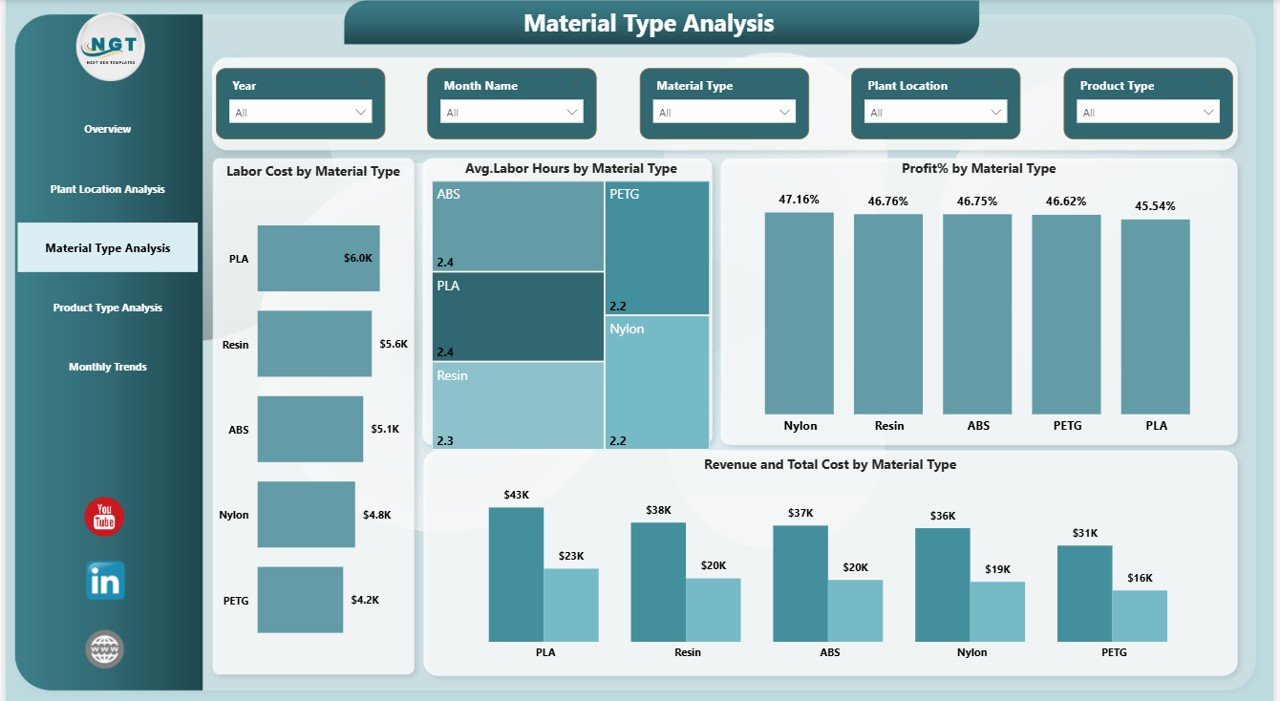
Material Type Analysis – Which Materials Drive Production Costs?
3D printing uses different materials such as plastics, metals, resins, and composites. Each material affects production cost, machine usage, and product quality.
The Material Type Analysis Page focuses on understanding the impact of material selection on manufacturing performance.
Charts Available on This Page
Labor Cost by Material Type
Some materials require more preparation and finishing work.
This chart helps manufacturers understand labor cost differences between materials.
Average Labor Hours by Material Type
This visualization highlights the average production time required for each material.
Therefore, managers can determine which materials slow down production.
Profit Percentage by Material Type
This chart reveals which materials generate the highest profitability.
Consequently, organizations can prioritize high-margin materials.
Click to buy 3D Printing Manufacturing Dashboard in Power BI
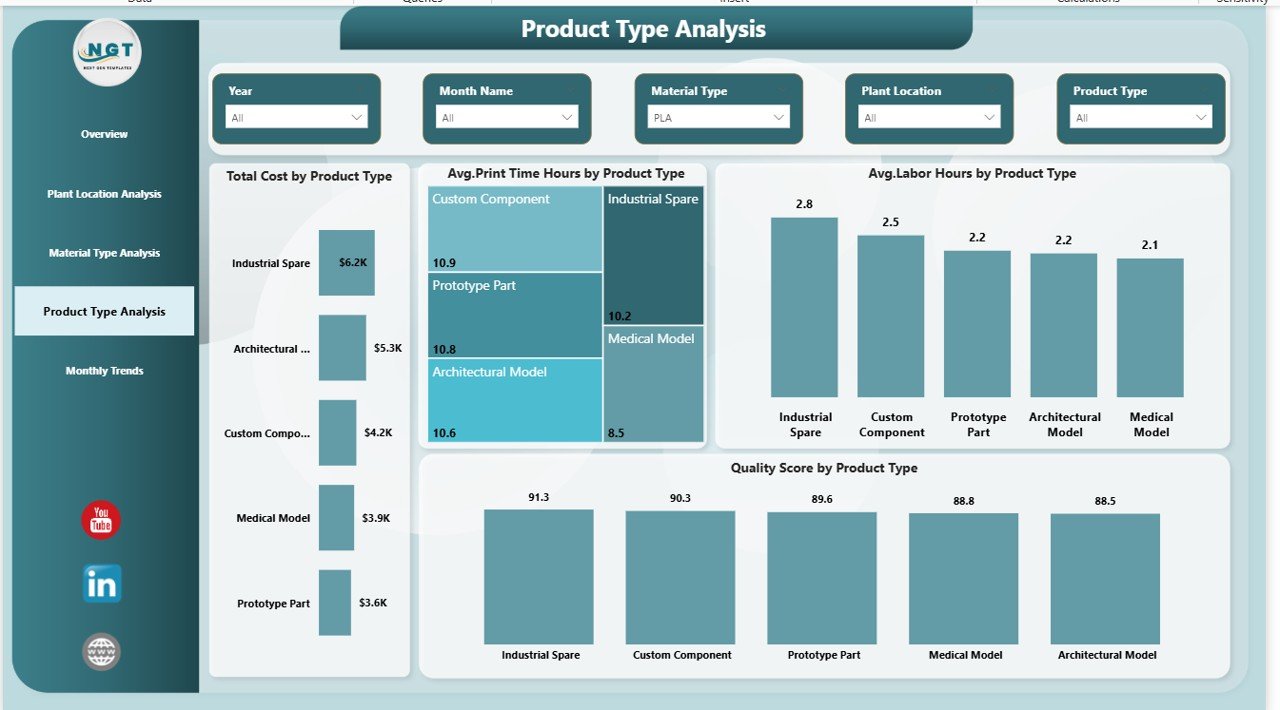
Product Type Analysis – Which Products Perform Best?
Manufacturers produce different types of products using 3D printing.
However, not all products deliver equal performance. Some products may require longer printing time or higher labor hours.
The Product Type Analysis Page helps manufacturers analyze product performance.
Charts Available on This Page
Total Cost by Product Type
This chart highlights the production cost associated with each product category.
Managers can identify expensive products and optimize manufacturing processes.
Average Print Time (Hours) by Product Type
This visualization shows how long each product takes to print.
Therefore, production managers can optimize machine scheduling.
Average Labor Hours by Product Type
This chart highlights labor requirements across product categories.
Consequently, organizations can improve workforce planning.
Quality Score by Product Type
Product quality remains a critical factor in manufacturing success.
This chart evaluates product quality performance across different product types.
Click to buy 3D Printing Manufacturing Dashboard in Power BI
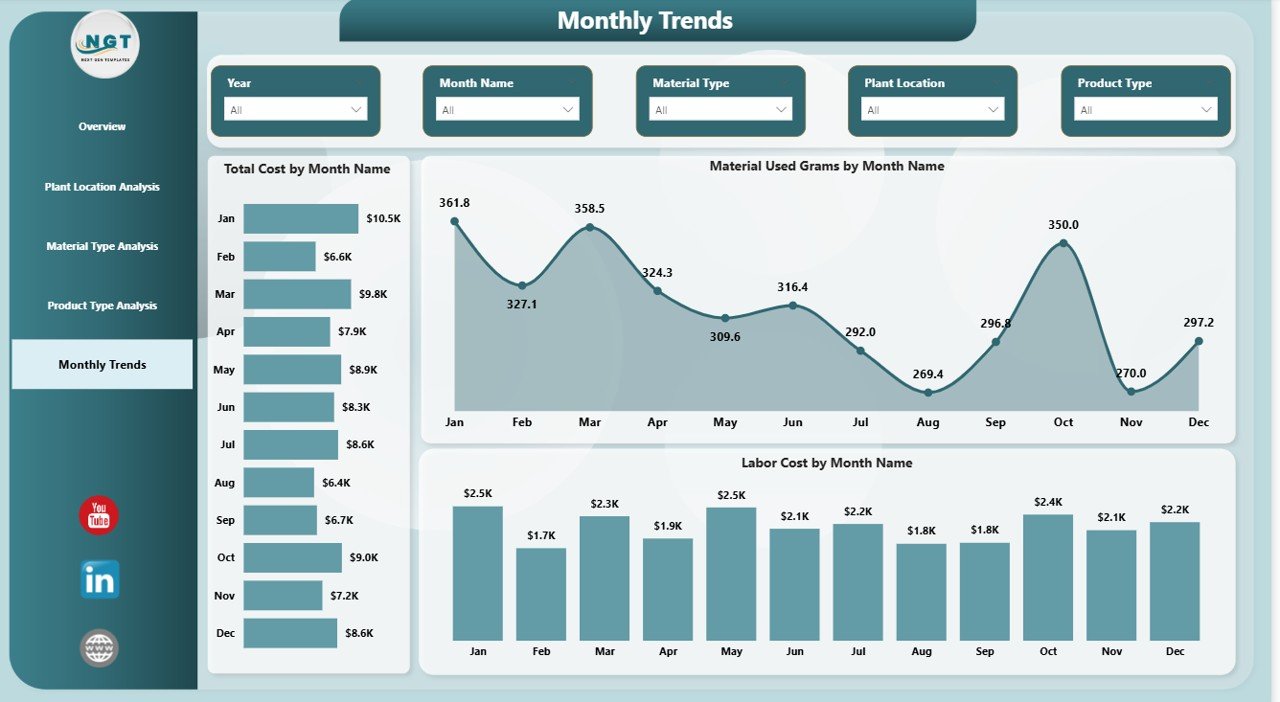
Month Analysis – How Does Production Change Over Time?
Manufacturing performance often changes over time due to seasonal demand, supply chain issues, or operational improvements.
The Month Analysis Page helps organizations monitor performance trends across months.
Charts Available on This Page
Total Cost by Month
This chart highlights monthly manufacturing costs.
Managers can easily track cost trends over time.
Material Used (Grams) by Month
This visualization shows how material consumption changes throughout the year.
Consequently, organizations can improve material procurement planning.
Labor Cost by Month
This chart tracks monthly labor expenses.
Therefore, managers can control workforce costs more effectively.
Click to buy 3D Printing Manufacturing Dashboard in Power BI
Advantages of the 3D Printing Manufacturing Dashboard in Power BI
Organizations gain numerous benefits when they implement a 3D Printing Manufacturing Dashboard.
Centralized Performance Monitoring
The dashboard consolidates production data into a single analytical platform.
Therefore, managers no longer need to review multiple reports.
Better Decision-Making
Interactive visualizations allow managers to analyze data quickly.
As a result, they make faster and more informed decisions.
Cost Optimization
Manufacturers can monitor machine costs, labor costs, and material consumption.
Consequently, organizations identify cost reduction opportunities.
Improved Production Planning
The dashboard highlights production trends and operational bottlenecks.
Therefore, production teams plan their manufacturing schedules more efficiently.
Enhanced Profitability Analysis
By comparing cost, revenue, and profit metrics, companies can optimize their product portfolio.
Best Practices for the 3D Printing Manufacturing Dashboard
To maximize the effectiveness of the 3D Printing Manufacturing Dashboard, organizations should follow certain best practices.
Maintain Accurate Data Sources
Accurate dashboards require reliable data.
Therefore, manufacturers must maintain clean and well-structured datasets.
Update Data Regularly
Frequent data updates ensure that the dashboard reflects the latest production performance.
Consequently, managers always work with accurate insights.
Standardize KPI Definitions
Organizations must clearly define each KPI.
For example:
- Profit percentage
- Machine cost
- Material usage
- Labor hours
Standard definitions ensure consistency across reports.
Use Filters and Slicers Effectively
Power BI slicers allow users to filter data by plant location, product type, and material type.
Therefore, users can explore deeper insights.
Train Teams to Interpret Dashboard Insights
Even the best dashboards provide value only when teams understand them.
Therefore, organizations should train managers to interpret dashboard insights correctly.
How Can Businesses Implement This Dashboard?
Organizations can implement the 3D Printing Manufacturing Dashboard using the following steps:
Step 1 – Collect Manufacturing Data
Gather production data such as:
- Material consumption
- Machine cost
- Labor hours
- Production volume
- Revenue
Step 2 – Structure the Data
Organize the data in a structured format.
For example:
- Date
- Plant location
- Material type
- Product type
- Cost metrics
Step 3 – Import Data into Power BI
Load the dataset into Power BI Desktop.
Step 4 – Create Data Relationships
Establish relationships between tables.
This step ensures accurate analysis.
Step 5 – Build Visualizations
Create interactive charts and KPI cards.
Step 6 – Publish the Dashboard
Publish the dashboard to Power BI Service so that teams can access it easily.
Future of 3D Printing Analytics
The future of manufacturing analytics looks extremely promising.
Companies increasingly combine 3D printing with AI, IoT sensors, and predictive analytics.
In the coming years, dashboards will provide:
- Real-time machine monitoring
- Predictive maintenance insights
- Automated production optimization
- Advanced cost forecasting
Therefore, manufacturers that adopt data-driven dashboards today will gain a strong competitive advantage.
Conclusion
The 3D Printing Manufacturing Dashboard in Power BI provides a powerful solution for monitoring and optimizing additive manufacturing operations.
Instead of relying on scattered spreadsheets and manual reports, manufacturers can analyze cost, revenue, labor hours, material usage, and profitability within a single interactive dashboard.
Because the dashboard includes Overview, Plant Location Analysis, Material Type Analysis, Product Type Analysis, and Month Analysis, decision-makers gain a complete view of their production performance.
As a result, organizations improve efficiency, reduce operational costs, and increase profitability.
Therefore, any company involved in additive manufacturing should consider implementing a 3D Printing Manufacturing Dashboard in Power BI to support smarter and more efficient production management.
Frequently Asked Questions (FAQs)
What is a 3D Printing Manufacturing Dashboard?
A 3D Printing Manufacturing Dashboard is an analytics tool that helps manufacturers monitor production costs, material usage, labor hours, and profitability using visual reports.
Why should manufacturers use Power BI for 3D printing analytics?
Power BI provides powerful visualization tools, interactive filters, and real-time data analysis. Therefore, it allows manufacturers to gain deeper insights into production performance.
What KPIs are commonly used in a 3D printing dashboard?
Common KPIs include:
- Total cost
- Revenue
- Profit
- Material consumption
- Labor hours
- Machine cost
- Print time
Can small manufacturers use this dashboard?
Yes. Small manufacturers can also benefit from a structured dashboard because it helps them monitor costs and improve production planning.
How often should manufacturers update the dashboard data?
Manufacturers should update the data daily or weekly depending on their production volume. Frequent updates ensure accurate insights.
Visit our YouTube channel to learn step-by-step video tutorials
Watch the step-by-step video tutorial:
Click to buy 3D Printing Manufacturing Dashboard in Power BI