Freshwater scarcity continues to grow worldwide. Many countries now depend on water desalination plants to convert seawater into drinkable water. However, managing a desalination facility involves monitoring multiple operational and financial metrics such as energy consumption, water production, system efficiency, operational cost, and plant performance.
Therefore, organizations require a clear and structured analytical system that converts desalination plant data into meaningful insights. This is exactly where the Water Desalination KPI Dashboard in Excel becomes extremely useful.
The Water Desalination KPI Dashboard in Excel is a ready-to-use performance monitoring template designed to track key performance indicators (KPIs) related to desalination plant operations. Because Excel provides powerful analytical features like charts, conditional formatting, and automated KPI calculations, organizations can easily monitor performance trends and compare results with targets.
In this detailed guide, we will explore the Water Desalination KPI Dashboard in Excel, including its structure, features, advantages, best practices, and how organizations can use it to improve water treatment efficiency.
Click to Purchases Water Desalination KPI Dashboard in Excel
What is a Water Desalination KPI Dashboard in Excel?
A Water Desalination KPI Dashboard in Excel is a performance monitoring system that tracks critical operational indicators of desalination plants. It converts raw plant data into visual insights using charts, KPI indicators, and trend analysis.
Instead of manually reviewing large datasets, plant managers can instantly view performance indicators such as:
-
Water production efficiency
-
Energy consumption per cubic meter
-
Operational cost
-
Plant utilization
-
Maintenance performance
-
Water recovery rate
-
System downtime
As a result, decision-makers gain a clear understanding of plant performance and can take corrective actions quickly.
Why Do Desalination Plants Need a KPI Dashboard?
Water desalination facilities operate complex treatment systems involving reverse osmosis, filtration, pumps, and energy-intensive processes. Therefore, managers must constantly monitor plant performance.
Without a structured dashboard, organizations often face several challenges:
-
Difficulty tracking plant performance
-
Limited visibility into operational efficiency
-
Lack of comparison between targets and actual results
-
Poor monitoring of monthly and yearly performance trends
-
Inefficient decision-making due to scattered reports
However, when organizations use a Water Desalination KPI Dashboard in Excel, they gain a centralized performance monitoring system that simplifies plant management.
Click to Purchases Water Desalination KPI Dashboard in Excel
Key Features of the Water Desalination KPI Dashboard in Excel
The Water Desalination KPI Dashboard in Excel includes several worksheets designed to monitor performance indicators and track KPI trends effectively.
This Excel dashboard contains seven worksheets, each performing a specific analytical function.
1. Home Sheet – Easy Navigation Across the Dashboard
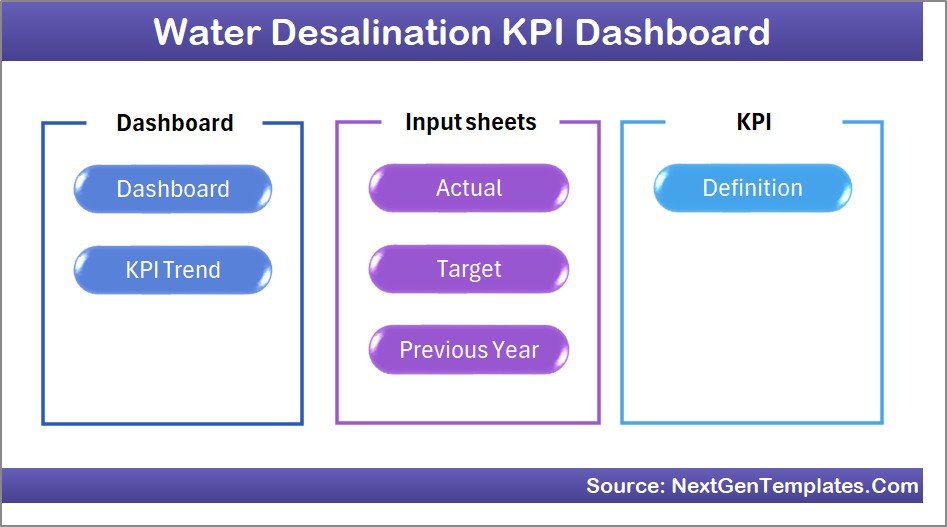
The Home Sheet acts as the dashboard index page.
It includes six navigation buttons that allow users to quickly jump to different worksheets within the dashboard.
Because of this navigation system, users can easily explore different sections of the dashboard without manually searching through sheets.
Click to Purchases Water Desalination KPI Dashboard in Excel
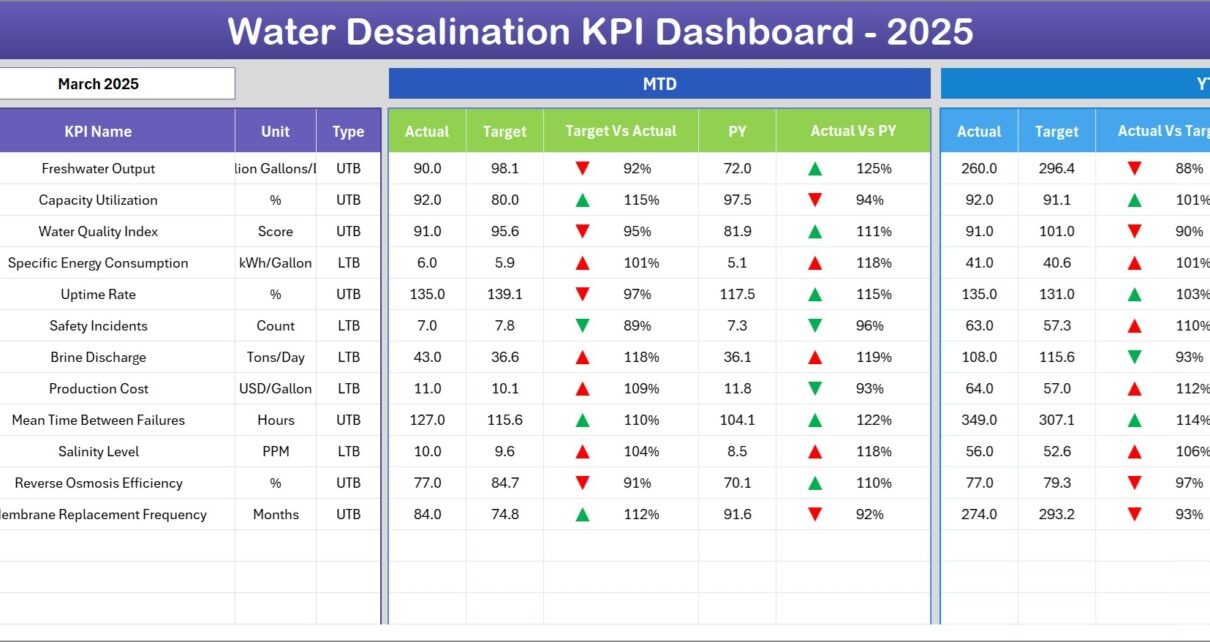
2. Dashboard Sheet – Central KPI Monitoring Page
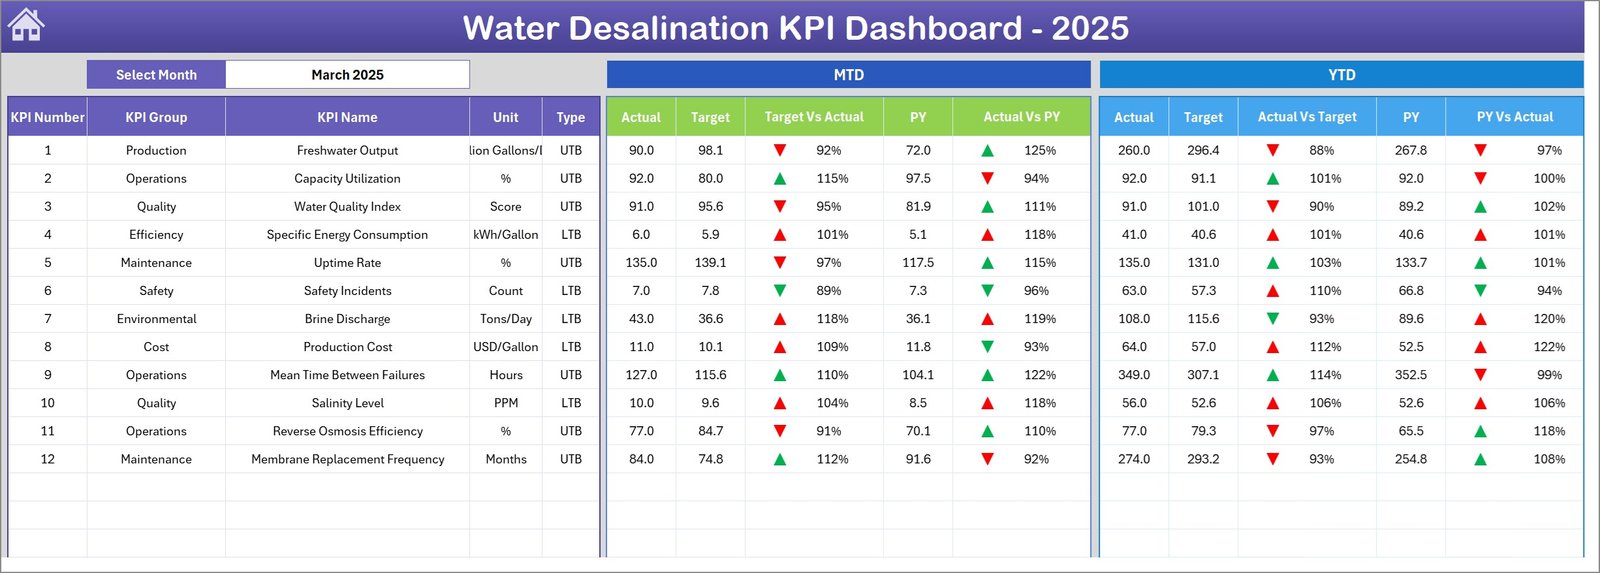
The Dashboard Sheet serves as the main monitoring interface where users can view all KPI performance indicators.
On cell D3, users can select the month from a drop-down menu, which automatically updates the entire dashboard.
KPI Metrics Displayed on the Dashboard
The dashboard displays multiple KPI indicators including:
-
MTD Actual (Month-to-Date actual performance)
-
Target Values
-
Previous Year Performance
Additionally, the dashboard compares these metrics using:
-
Target vs Actual
-
Previous Year vs Actual
Conditional Formatting Indicators
To improve visibility, the dashboard uses conditional formatting arrows:
-
Up arrows for positive performance
-
Down arrows for underperformance
Because of these indicators, users can quickly identify performance improvements or declines.
Click to Purchases Water Desalination KPI Dashboard in Excel
3. KPI Trend Sheet – Track KPI Performance Over Time
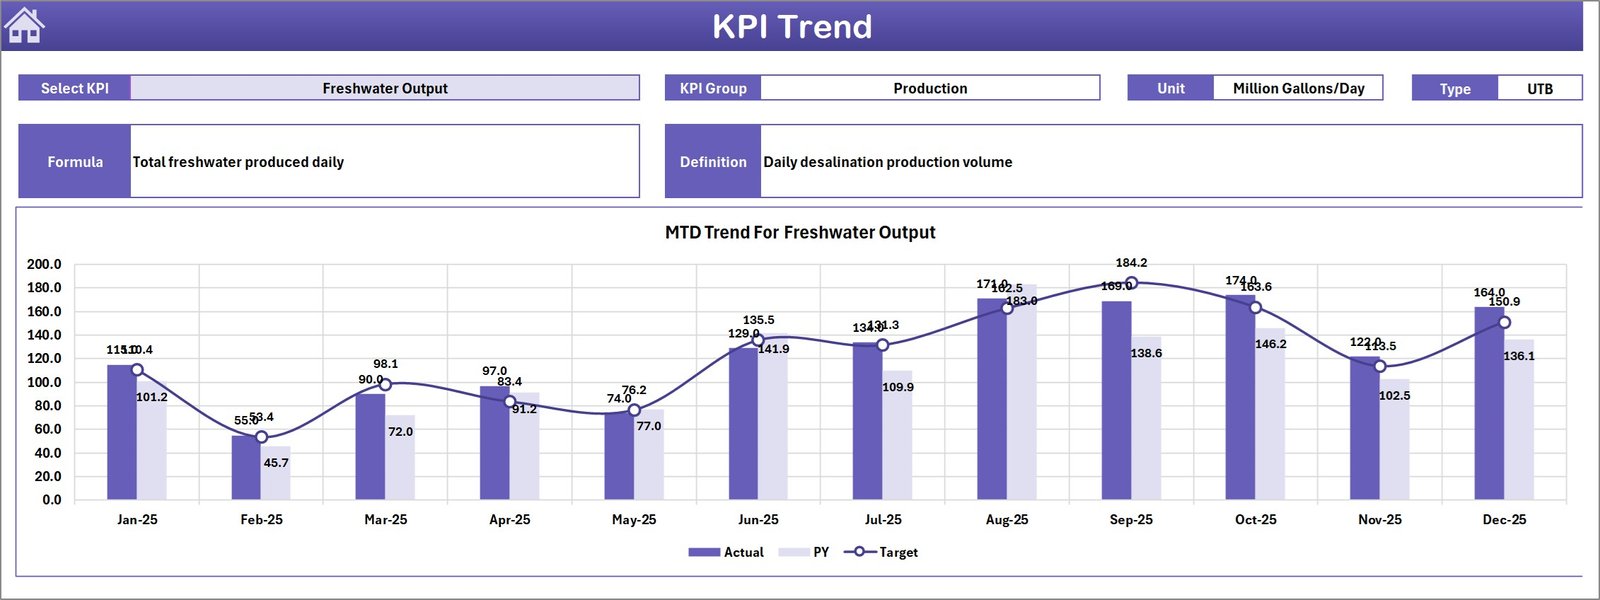
The KPI Trend Sheet provides detailed trend analysis for each KPI.
Users can select a specific KPI from the drop-down menu located in cell C3.
Once a KPI is selected, the dashboard automatically displays the following information:
-
KPI Group
-
KPI Unit
-
KPI Type (Lower the Better or Higher the Better)
-
KPI Formula
-
KPI Definition
Trend Charts Included
This sheet also includes MTD and YTD trend charts showing:
-
Actual values
-
Target values
-
Previous year performance
These charts help users analyze KPI performance trends over time.
Click to Purchases Water Desalination KPI Dashboard in Excel
4. Actual Numbers Input Sheet – Enter Current Performance Data
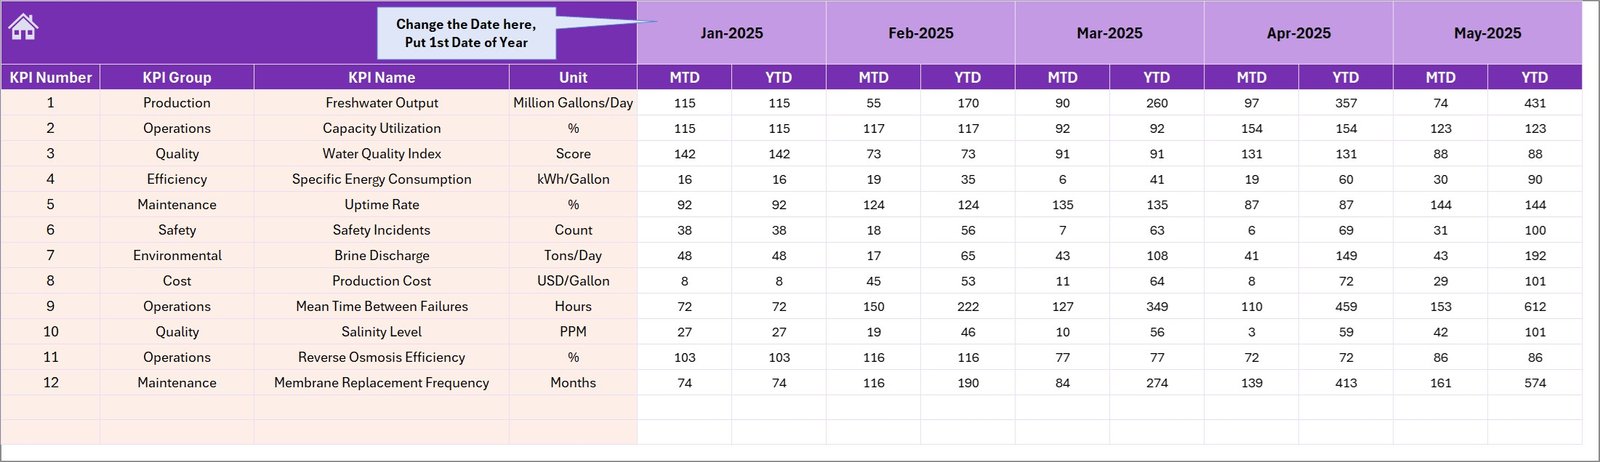
The Actual Numbers Input Sheet allows users to enter the current year’s KPI performance data.
Users must input:
-
Month-to-Date (MTD) values
-
Year-to-Date (YTD) values
Users can select the starting month of the year in cell E1.
After entering the first month, Excel automatically adjusts calculations for the remaining months.
5. Target Sheet – Set Monthly KPI Targets
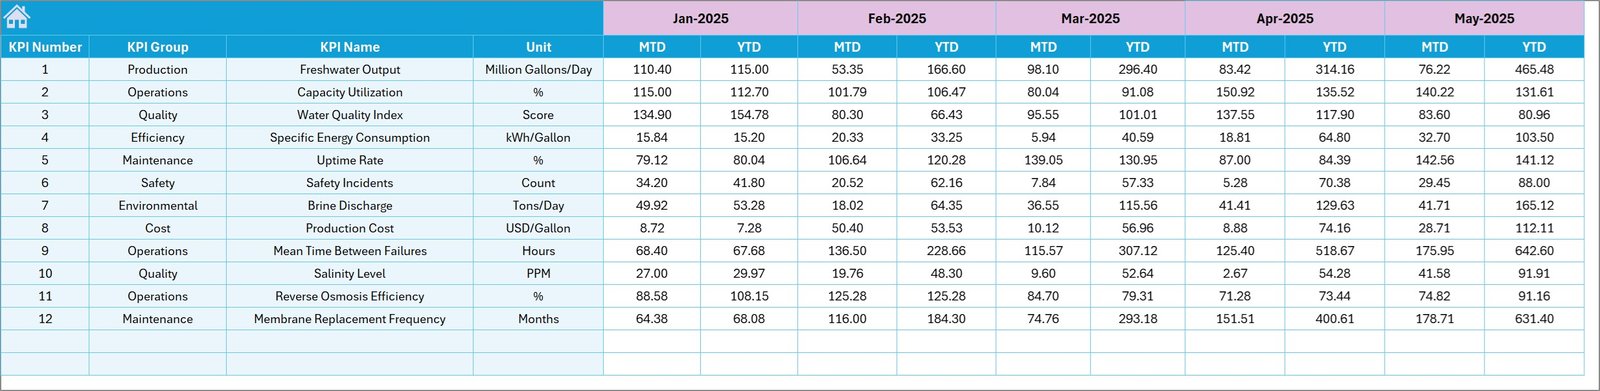
The Target Sheet stores the planned performance targets for each KPI.
Users must enter target values for:
-
MTD targets
-
YTD targets
These targets allow organizations to compare planned performance against actual results.
Click to Purchases Water Desalination KPI Dashboard in Excel
6. Previous Year Number Sheet – Historical Performance Data
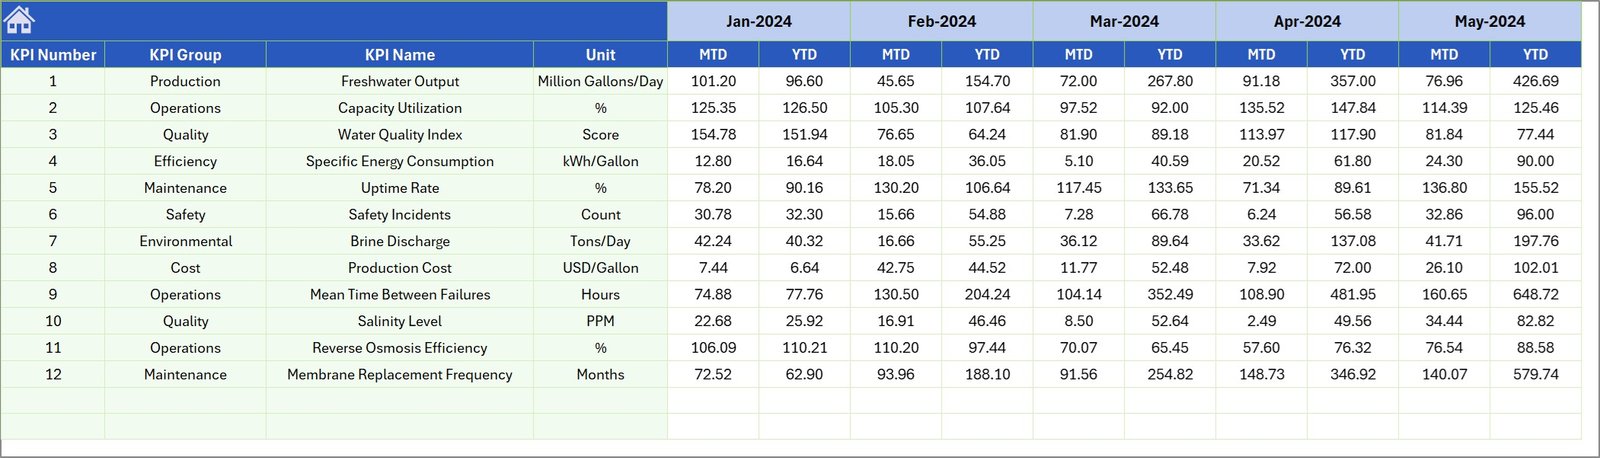
The Previous Year Number Sheet stores KPI performance data from the previous year.
Users must enter the historical numbers similar to how they enter current-year values.
Because of this data, the dashboard can perform year-over-year comparisons.
7. KPI Definition Sheet – KPI Reference Library
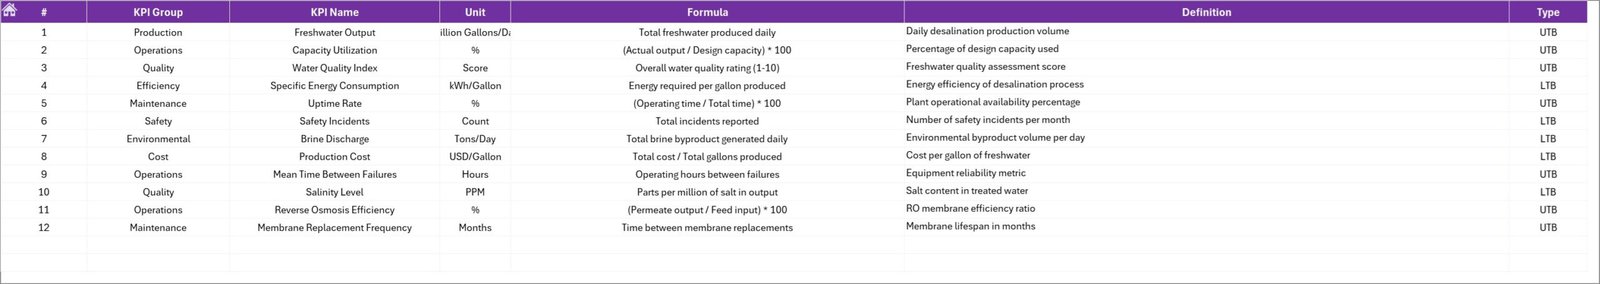
The KPI Definition Sheet acts as a reference library for all performance indicators.
Users must define the following fields:
-
KPI Name
-
KPI Group
-
Unit of Measurement
-
KPI Formula
-
KPI Definition
This section ensures that every KPI has a clear explanation and calculation method.
Click to Purchases Water Desalination KPI Dashboard in Excel
Advantages of the Water Desalination KPI Dashboard in Excel
Organizations gain several benefits when they implement this dashboard.
1. Centralized Plant Performance Monitoring
Managers can track all desalination KPIs in a single location.
2. Faster Performance Evaluation
The dashboard quickly highlights performance gaps using conditional formatting indicators.
3. Better Decision Making
Managers can analyze trends and take corrective actions immediately.
4. Target vs Actual Comparison
The dashboard compares actual performance against targets.
5. Year-over-Year Analysis
Previous year comparisons help identify long-term performance improvements.
6. Improved Operational Efficiency
Tracking KPIs helps managers optimize plant operations.
7. Easy Implementation
Since the dashboard uses Excel, organizations can deploy it without complex software.
Opportunities for Improvement in Desalination Plant Analytics
Although Excel dashboards provide powerful insights, organizations can further improve their analytics systems.
Integration with IoT Sensors
Modern desalination plants collect operational data from sensors. Integrating this data into the dashboard can improve real-time monitoring.
Energy Consumption Analysis
Since desalination consumes large amounts of energy, advanced energy monitoring can improve cost efficiency.
Predictive Maintenance
Adding predictive analytics can help detect equipment failures before they occur.
Click to Purchases Water Desalination KPI Dashboard in Excel
Best Practices for Using the Water Desalination KPI Dashboard
Organizations should follow several best practices to maximize dashboard effectiveness.
Maintain Accurate Data Entry
Ensure that actual numbers and target values are entered correctly.
Update KPI Data Regularly
Managers should update KPI values monthly to maintain accurate insights.
Standardize KPI Definitions
Ensure that KPI definitions remain consistent across departments.
Monitor Performance Trends
Regularly review KPI trend charts to identify performance changes.
Protect Important Formulas
Lock important Excel formulas to prevent accidental modification.
Train Operational Teams
Ensure that staff members understand how to use the dashboard properly.
Why Excel is Ideal for Water Desalination KPI Monitoring
Excel remains one of the most powerful tools for operational analytics.
It offers several advantages:
-
Interactive charts
-
Conditional formatting indicators
-
Flexible KPI calculations
-
Easy customization
-
Wide accessibility
Because of these features, Excel dashboards provide a practical solution for desalination plant performance monitoring.
Click to Purchases Water Desalination KPI Dashboard in Excel
How Does This Dashboard Improve Desalination Plant Management?
The dashboard improves plant management in several ways.
First, it provides clear visibility into plant performance indicators.
Second, it allows managers to compare actual results with targets.
Third, the trend analysis helps detect operational inefficiencies.
Finally, year-over-year comparisons enable organizations to track long-term improvements.
Conclusion
Water desalination plays a critical role in solving global water shortages. However, desalination plants must operate efficiently to manage energy consumption, operational costs, and water production.
The Water Desalination KPI Dashboard in Excel provides a structured solution for monitoring plant performance. With interactive KPI indicators, trend charts, and comparison metrics, organizations can quickly analyze operational efficiency and identify improvement opportunities.
Therefore, desalination plant operators, water utilities, and infrastructure managers should implement this dashboard to enhance performance monitoring and improve decision-making.
Click to Purchases Water Desalination KPI Dashboard in Excel
Frequently Asked Questions (FAQs)
What is a Water Desalination KPI Dashboard in Excel?
A Water Desalination KPI Dashboard in Excel is a performance monitoring tool that tracks desalination plant KPIs such as water production, operational efficiency, and energy consumption.
Who should use this dashboard?
This dashboard is useful for:
-
Desalination plant operators
-
Water utility companies
-
Environmental engineers
-
Infrastructure managers
-
Government water authorities
What KPIs can be tracked in this dashboard?
Common desalination KPIs include:
-
Water production volume
-
Energy consumption per cubic meter
-
Plant utilization rate
-
System downtime
-
Operational cost
Can this dashboard track historical performance?
Yes. The dashboard includes previous year data for year-over-year performance comparison.
Can organizations customize the dashboard?
Yes. Since it is built in Excel, users can customize KPIs, charts, and calculations based on their operational needs.
Click to Purchases Water Desalination KPI Dashboard in Excel
Visit our YouTube channel to learn step-by-step video tutorials