In today’s competitive business environment, organizations must monitor financial performance, valuation metrics, and strategic indicators regularly. Business valuation professionals, financial analysts, investors, and consulting firms depend on accurate performance tracking to evaluate business worth and identify improvement opportunities.
However, many organizations still rely on manual spreadsheets, scattered reports, and time-consuming calculations to analyze valuation performance. As a result, decision-makers often struggle to understand trends, compare targets with actual performance, and monitor financial indicators efficiently.
Click to Purchases Business Valuation KPI Dashboard in Power BI
Therefore, companies increasingly adopt data-driven dashboards to simplify valuation monitoring and improve financial analysis.
One of the most effective tools for this purpose is the Business Valuation KPI Dashboard in Power BI.
The Business Valuation KPI Dashboard in Power BI is a ready-to-use analytical dashboard designed to help organizations track, monitor, and analyze key performance indicators related to business valuation. Because Power BI provides interactive visuals, slicers, and automated calculations, this dashboard transforms raw financial data into clear and meaningful insights.
Moreover, the dashboard enables users to compare Actual vs Target performance, evaluate current year vs previous year metrics, and monitor valuation indicators using structured visual reports.
In this comprehensive guide, you will learn everything about the Business Valuation KPI Dashboard in Power BI, including its structure, features, advantages, best practices, and frequently asked questions.
What is a Business Valuation KPI Dashboard in Power BI?
A Business Valuation KPI Dashboard in Power BI is an analytical reporting tool that helps financial professionals monitor performance indicators related to business valuation.
Instead of analyzing multiple spreadsheets or financial reports, the dashboard consolidates valuation data into a centralized Power BI report.
The dashboard allows organizations to:
-
Monitor key valuation metrics
-
Compare actual performance against targets
-
Analyze performance trends
-
Evaluate year-over-year valuation changes
-
Identify financial strengths and weaknesses
-
Support strategic financial decision-making
Because Power BI provides powerful data visualization capabilities, users can easily analyze complex financial information through charts, tables, slicers, and KPI indicators.
As a result, organizations can make faster and more informed valuation decisions.
Why Do Businesses Need a Business Valuation KPI Dashboard?
Business valuation plays an important role in mergers, acquisitions, investments, financial planning, and corporate strategy. However, organizations must continuously monitor valuation-related metrics to maintain financial transparency.
Without structured analytics, companies face several challenges.
For example:
-
Financial data remains scattered across multiple files.
-
Analysts spend excessive time creating reports manually.
-
Decision-makers struggle to identify financial trends.
-
Performance comparisons become difficult.
However, a Business Valuation KPI Dashboard solves these problems.
Because the dashboard centralizes data and automates calculations, users can instantly analyze valuation performance.
Furthermore, Power BI allows organizations to explore insights interactively, which significantly improves financial analysis and reporting.
Key Features of the Business Valuation KPI Dashboard in Power BI
The Business Valuation KPI Dashboard in Power BI includes several powerful features that make performance tracking simple and efficient.
Some of the most important features include:
1. Interactive Power BI Dashboard
The dashboard provides an interactive interface where users can filter and analyze KPIs using slicers.
2. Month Selection Filter
Users can select a specific month using the slicer. Once selected, the entire dashboard updates automatically.
3. KPI Group Filtering
Users can filter KPIs based on their group or category.
4. KPI Performance Indicators
The dashboard uses visual indicators such as green and red arrows to show KPI performance against targets.
5. Target vs Actual Comparison
The dashboard automatically calculates the difference between actual performance and target values.
6. Current Year vs Previous Year Analysis
Users can compare current performance with previous year data to evaluate growth or decline.
7. Trend Analysis Charts
Interactive combo charts allow users to visualize KPI trends across months.
8. Drill-Through KPI Definition Page
Users can drill through to a dedicated page that explains the KPI formula and definition.
9. Excel Data Integration
The dashboard connects to an Excel file that stores actual, target, and KPI definition data.
Dashboard Pages Explanation
Click to Purchases Business Valuation KPI Dashboard in Power BI
The Business Valuation KPI Dashboard in Power BI consists of three main pages that help users analyze valuation performance effectively.
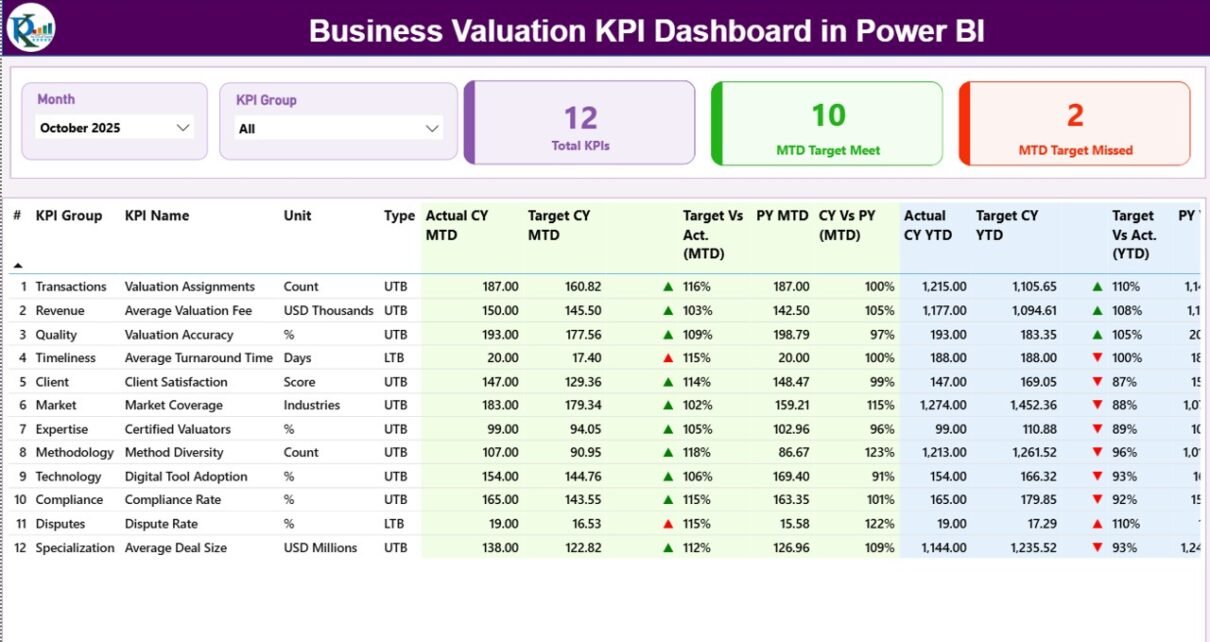
1. Summary Page – Main Dashboard Overview
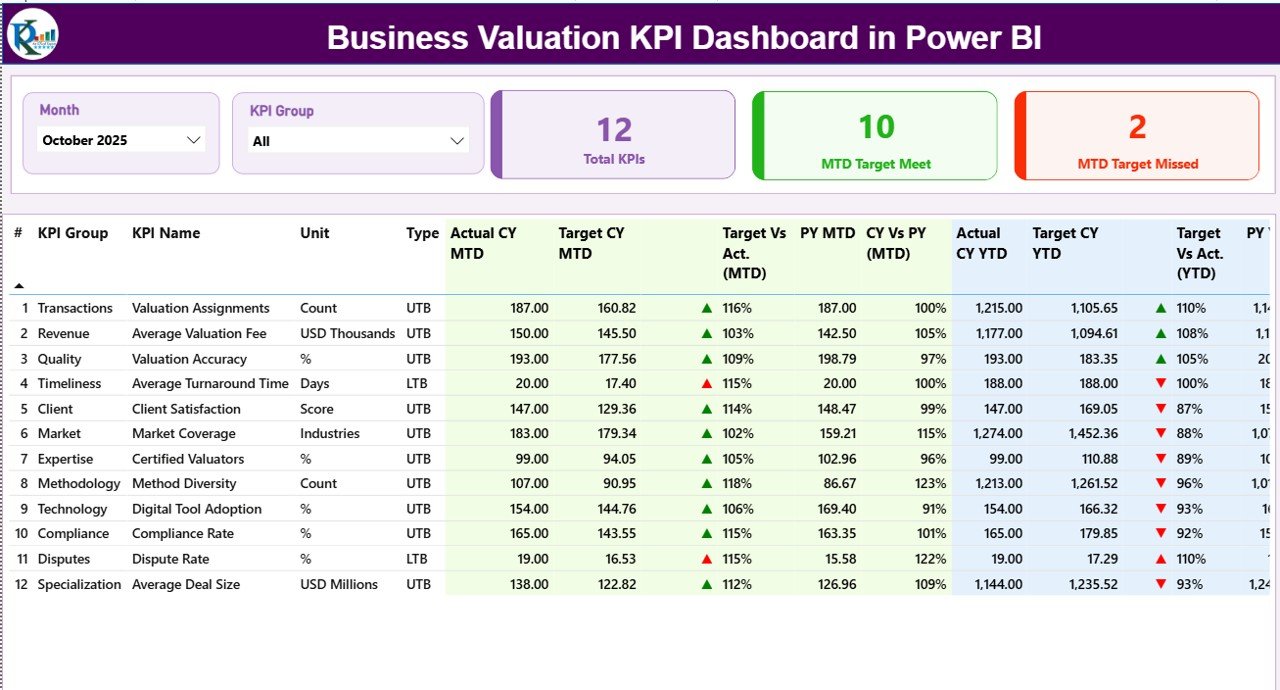
The Summary Page serves as the main dashboard where users can view all KPI performance indicators.
At the top of the page, users can find two slicers:
-
Month Slicer
-
KPI Group Slicer
These slicers allow users to filter the dashboard dynamically.
Additionally, the page displays three important KPI cards:
-
Total KPIs Count
-
MTD Target Meet Count
-
MTD Target Missed Count
These summary cards help users quickly understand overall performance.
Below the cards, the dashboard displays a detailed KPI performance table.
KPI Table Information
The KPI table includes the following fields:
KPI Number
This represents the unique sequence number assigned to each KPI.
KPI Group
This identifies the category to which the KPI belongs.
KPI Name
This shows the name of the performance indicator.
Unit
This defines the unit of measurement used for the KPI.
Type
This indicates whether the KPI follows:
-
UTB – Upper the Better
-
LTB – Lower the Better
Actual CY MTD
This shows the Current Year Month-to-Date actual value of the KPI.
Target CY MTD
This displays the target value for the current year MTD.
MTD Icon
The dashboard shows:
-
▲ Green arrow when the KPI meets or exceeds the target
-
▼ Red arrow when the KPI falls below the target
Target vs Actual (MTD)
This field shows the percentage comparison between actual and target values.
Click to Purchases Business Valuation KPI Dashboard in Power BI
Formula used:
Actual MTD / Target MTD
PY MTD
This shows the previous year’s MTD value for the same period.
CY vs PY (MTD)
This field compares current performance with the previous year.
Formula used:
Current Year MTD / Previous Year MTD
YTD Performance Metrics
The dashboard also tracks Year-to-Date performance.
The following fields appear:
-
Actual CY YTD
-
Target CY YTD
-
YTD Icon
-
Target vs Actual (YTD)
-
PY YTD
-
CY vs PY (YTD)
These metrics help organizations evaluate performance throughout the year rather than focusing only on monthly data.
2. KPI Trend Page – Performance Trend Analysis
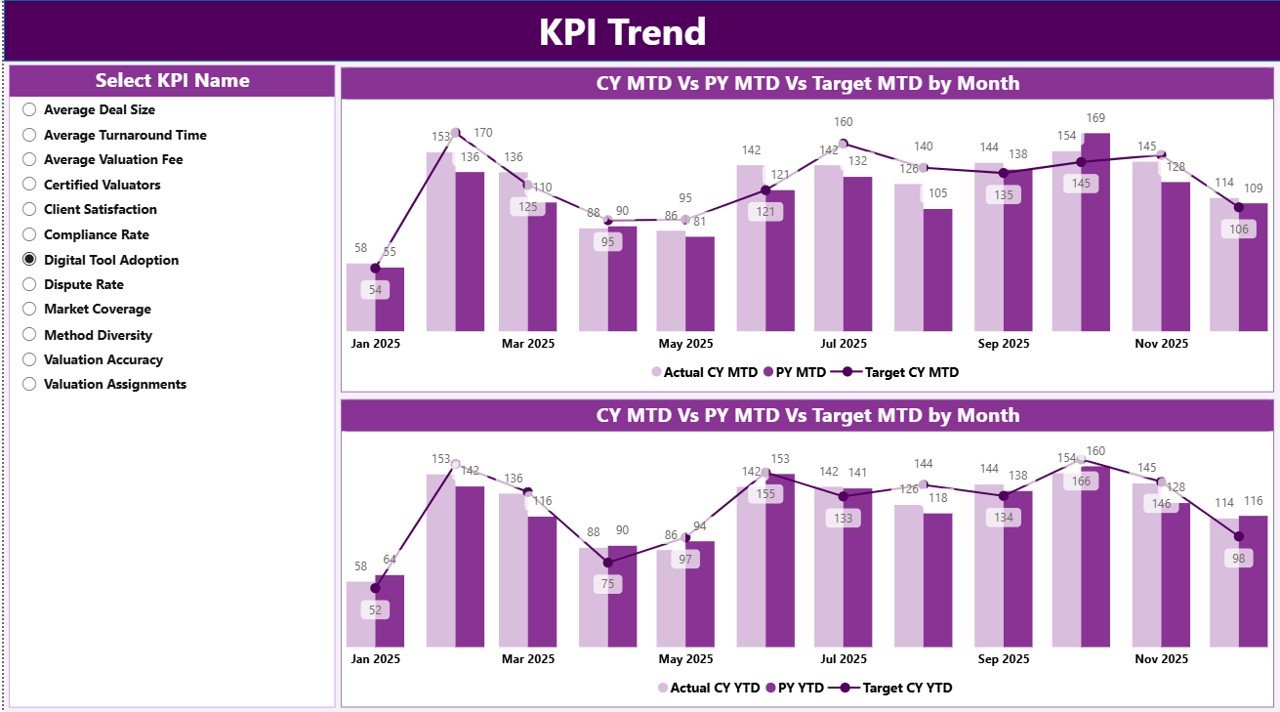
The KPI Trend Page helps users analyze how each KPI performs over time.
On this page, users can select a specific KPI using a slicer located on the left side.
The page displays two combo charts:
MTD Trend Chart
This chart compares:
-
Current Year Actual MTD
-
Target MTD
-
Previous Year MTD
YTD Trend Chart
This chart compares:
-
Current Year Actual YTD
-
Target YTD
-
Previous Year YTD
These charts allow users to identify:
-
Growth patterns
-
Performance fluctuations
-
Seasonal trends
-
Target achievement levels
Because Power BI updates visuals instantly, users can easily analyze performance trends with just one click.
3. KPI Definition Page – Detailed KPI Information
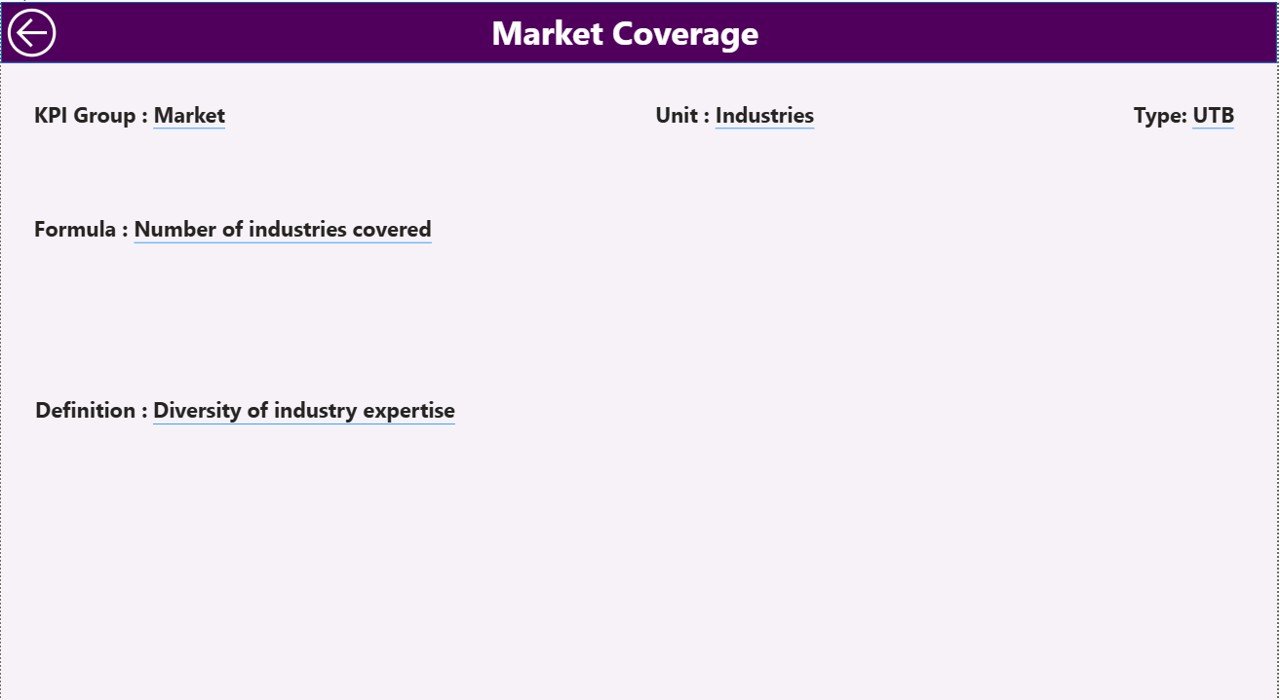
The KPI Definition Page provides additional information about each KPI.
This page includes:
-
KPI Formula
-
KPI Definition
-
KPI Unit
-
KPI Group
-
KPI Type
Users can access this page using the drill-through feature from the summary page.
Once users finish reviewing the KPI details, they can click the Back Button located at the top-left corner to return to the main dashboard.
Click to Purchases Business Valuation KPI Dashboard in Power BI
Excel Data Source Used in the Dashboard
The dashboard uses an Excel file as the primary data source.
Users must fill data in three worksheets inside the Excel file.
1. Input_Actual Sheet
In this sheet, users must enter the actual performance values.
Required fields include:
-
KPI Name
-
Month (use the first date of the month)
-
MTD Value
-
YTD Value
This sheet stores the actual KPI performance data.
2. Input_Target Sheet
In this worksheet, users must enter the target KPI values.
Required columns include:
-
KPI Name
-
Month
-
Target MTD
-
Target YTD
The dashboard uses this data to compare actual performance against targets.
3. KPI Definition Sheet
This sheet contains detailed information about each KPI.
Users must fill the following fields:
-
KPI Number
-
KPI Group
-
KPI Name
-
Unit
-
Formula
-
KPI Definition
-
KPI Type (LTB or UTB)
Power BI uses this sheet to provide KPI explanations in the drill-through page.
Advantages of Business Valuation KPI Dashboard in Power BI
Organizations gain several benefits when they use a Business Valuation KPI Dashboard.
1. Centralized Financial Monitoring
The dashboard consolidates valuation metrics into a single platform.
2. Faster Decision Making
Managers can analyze financial performance instantly.
3. Improved Data Visualization
Power BI converts complex financial data into easy-to-understand visuals.
4. Automated KPI Calculations
The dashboard automatically calculates comparisons and percentages.
5. Better Performance Tracking
Users can track both MTD and YTD performance.
6. Year-over-Year Analysis
Organizations can compare current performance with previous years.
7. Interactive Reporting
Users can filter KPIs and explore insights using slicers.
Opportunities for Improvement in Business Valuation KPI Dashboards
Although the dashboard offers powerful analytics, organizations can improve its capabilities further.
Possible improvements include:
-
Integrating data directly from accounting systems
-
Adding predictive valuation analysis
-
Including scenario modeling
-
Implementing automated data refresh
-
Expanding KPI categories
These improvements can enhance financial analysis and forecasting capabilities.
Best Practices for the Business Valuation KPI Dashboard in Power BI
Click to Purchases Business Valuation KPI Dashboard in Power BI
Organizations should follow certain best practices to maximize the effectiveness of their KPI dashboards.
1. Define Clear KPIs
Ensure each KPI has a clear definition and formula.
2. Maintain Accurate Data
Update actual and target data regularly.
3. Use Consistent KPI Units
Standardize units of measurement across KPIs.
4. Monitor Trends Regularly
Review KPI trends monthly to detect changes early.
5. Keep Dashboards Simple
Avoid clutter and focus on important KPIs.
6. Train Users
Ensure managers understand how to interpret dashboard insights.
7. Validate Data Sources
Verify Excel data regularly to avoid reporting errors.
How Can Organizations Use This Dashboard Effectively?
Organizations can use the Business Valuation KPI Dashboard in several practical ways.
For example:
-
Financial analysts can track valuation metrics.
-
Investment firms can monitor portfolio company performance.
-
Consulting firms can analyze valuation benchmarks.
-
Corporate finance teams can monitor financial growth.
-
Business owners can evaluate company value over time.
Because the dashboard provides real-time visual insights, decision-makers can easily evaluate financial performance.
Conclusion
The Business Valuation KPI Dashboard in Power BI provides a powerful solution for monitoring financial performance and valuation metrics.
Instead of relying on scattered reports and manual analysis, organizations can centralize KPI monitoring within a single interactive dashboard.
The dashboard allows users to analyze MTD and YTD performance, compare actual vs target results, evaluate current vs previous year trends, and explore KPI definitions using drill-through functionality.
Moreover, the integration with Excel data makes the dashboard flexible and easy to maintain.
Therefore, businesses, financial analysts, and consultants can significantly improve valuation analysis and decision-making using this dashboard.
Organizations that adopt structured KPI dashboards gain better financial transparency, stronger strategic insights, and more effective performance management.
Frequently Asked Questions (FAQs)
What is a Business Valuation KPI Dashboard?
A Business Valuation KPI Dashboard is a reporting tool that helps organizations monitor key metrics related to company valuation and financial performance.
Why should businesses use a KPI dashboard for valuation?
A KPI dashboard helps businesses analyze financial data quickly, compare performance with targets, and identify trends that impact company value.
Why is Power BI useful for KPI dashboards?
Power BI provides powerful data visualization, interactive filtering, automated calculations, and real-time analytics.
What data source does the dashboard use?
The dashboard uses an Excel file containing Actual values, Target values, and KPI definitions.
What does MTD and YTD mean in the dashboard?
MTD stands for Month-to-Date, while YTD stands for Year-to-Date.
These metrics help organizations analyze both short-term and long-term performance.
Can users customize the KPIs in the dashboard?
Yes. Users can add, remove, or modify KPIs by updating the KPI Definition sheet in the Excel data source.
Visit our YouTube channel to learn step-by-step video tutorials