Smart city initiatives are transforming how modern cities operate. Governments and municipalities now invest heavily in digital infrastructure, intelligent transportation systems, smart utilities, connected public services, and sustainable urban development. However, managing smart city projects involves handling large contracts, multiple vendors, regional operations, and complex financial data.
When project managers rely only on spreadsheets or disconnected reports, it becomes difficult to monitor implementation costs, revenue generation, vendor performance, and contract profitability.
Therefore, organizations increasingly adopt data-driven dashboards to manage smart city projects effectively.
One of the most powerful tools for this purpose is the Smart Cities Contract Dashboard in Power BI.
The Smart Cities Contract Dashboard in Power BI is an interactive analytics solution designed to track contract performance, implementation costs, revenues, profits, and operational progress of smart city initiatives. Moreover, the dashboard transforms raw project data into visual insights using KPI cards, charts, and interactive slicers.
Because Power BI provides advanced data visualization and business intelligence capabilities, government agencies and project managers can easily monitor contract performance, identify operational risks, and make data-driven decisions.
In this comprehensive guide, you will learn everything about the Smart Cities Contract Dashboard in Power BI, including its features, dashboard structure, benefits, best practices, and frequently asked questions.
Click to Purchases Smart Cities Contract Dashboard in Power BI
Table of Contents
ToggleWhat is a Smart Cities Contract Dashboard in Power BI?
A Smart Cities Contract Dashboard in Power BI is a visual analytics tool used to monitor and analyze the financial and operational performance of smart city contracts.
Instead of reviewing multiple reports, the dashboard centralizes all important project metrics into one interactive interface.
Using this dashboard, organizations can track:
-
Implementation costs of smart city projects
-
Revenue generated from city contracts
-
Project profitability
-
Contract completion percentage
-
Vendor performance
-
Regional contract performance
-
Monthly financial trends
Furthermore, Power BI allows users to filter data using interactive slicers, which makes it easier to analyze contracts across different regions, project managers, vendors, and time periods.
As a result, decision-makers gain better visibility into project performance and financial outcomes.
Why Do Smart City Projects Need Contract Dashboards?
Smart city programs involve multiple stakeholders including government departments, contractors, vendors, technology providers, and financial institutions.
However, without a centralized reporting system, project monitoring becomes complicated.
Organizations often face the following challenges:
-
Difficulty tracking project costs and revenues
-
Limited visibility into contract profitability
-
Lack of insights into vendor performance
-
Delays in identifying overdue payments
-
Poor monitoring of regional project progress
Therefore, organizations require a contract analytics dashboard to manage smart city initiatives effectively.
A contract dashboard helps organizations:
-
Monitor financial performance in real time
-
Track active contracts and completion status
-
Analyze vendor and project manager performance
-
Identify payment delays and risks
-
Improve operational efficiency
Consequently, the Smart Cities Contract Dashboard in Power BI becomes an essential tool for managing urban development projects.
Key Features of the Smart Cities Contract Dashboard in Power BI
The dashboard provides powerful analytics capabilities designed for smart city contract management.
Interactive KPI Cards
Key financial metrics appear in the form of KPI cards for quick analysis.
Dynamic Data Filtering
Users can apply slicers to filter data by different categories.
Multi-page Analytical Structure
The dashboard includes multiple pages to analyze contracts from different perspectives.
Project Performance Monitoring
Users can monitor implementation costs, revenue, and profit.
Vendor Performance Analysis
The dashboard evaluates vendor contributions and payment performance.
Regional Project Monitoring
Users can analyze contract performance across different regions.
Monthly Performance Trends
The dashboard tracks financial performance across months.
Visual Data Insights
Charts and graphs simplify complex contract data.
Click to Purchases Smart Cities Contract Dashboard in Power BI
Structure of the Smart Cities Contract Dashboard in Power BI
The dashboard contains five analytical pages, each designed to provide specific insights into contract performance.
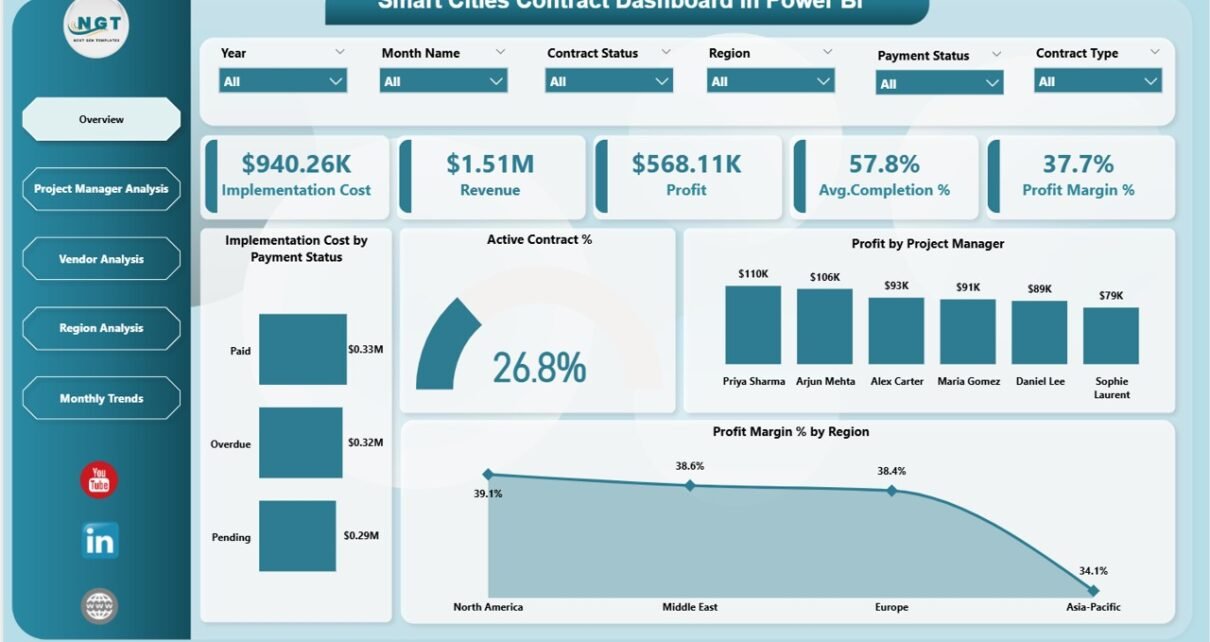
1. Overview Page – Smart City Project Performance Summary
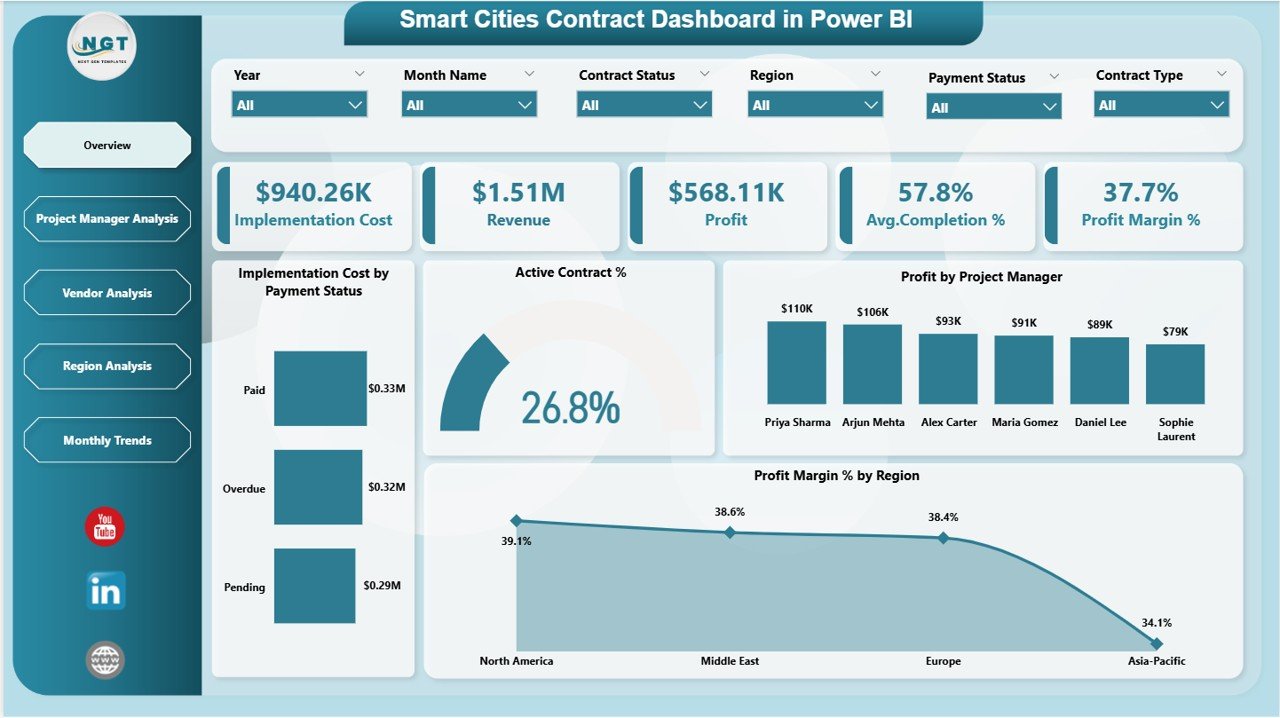
The Overview Page serves as the main dashboard interface where users can quickly evaluate overall contract performance.
At the top of the dashboard, users will find interactive slicers that allow filtering of data.
KPI Cards on the Overview Page
The dashboard displays five important KPI cards.
Implementation Cost
Shows the total cost spent on smart city project implementation.
Revenue
Displays the revenue generated from contracts.
Profit
Represents the difference between revenue and implementation cost.
Average Completion %
Shows the average completion percentage of active contracts.
Profit Margin %
Displays the profitability ratio of smart city projects.
Charts on the Overview Page
The overview page includes four analytical charts.
Implementation Cost by Payment Status
Shows project spending categorized by payment status.
Active Contract %
Displays the percentage of contracts that remain active.
Profit by Project Manager
Shows profit generated by different project managers.
Profit Margin % by Region
Displays profitability across different regions.
These charts help leaders quickly identify project performance and financial outcomes.
2. Project Manager Analysis – Performance by Project Leadership
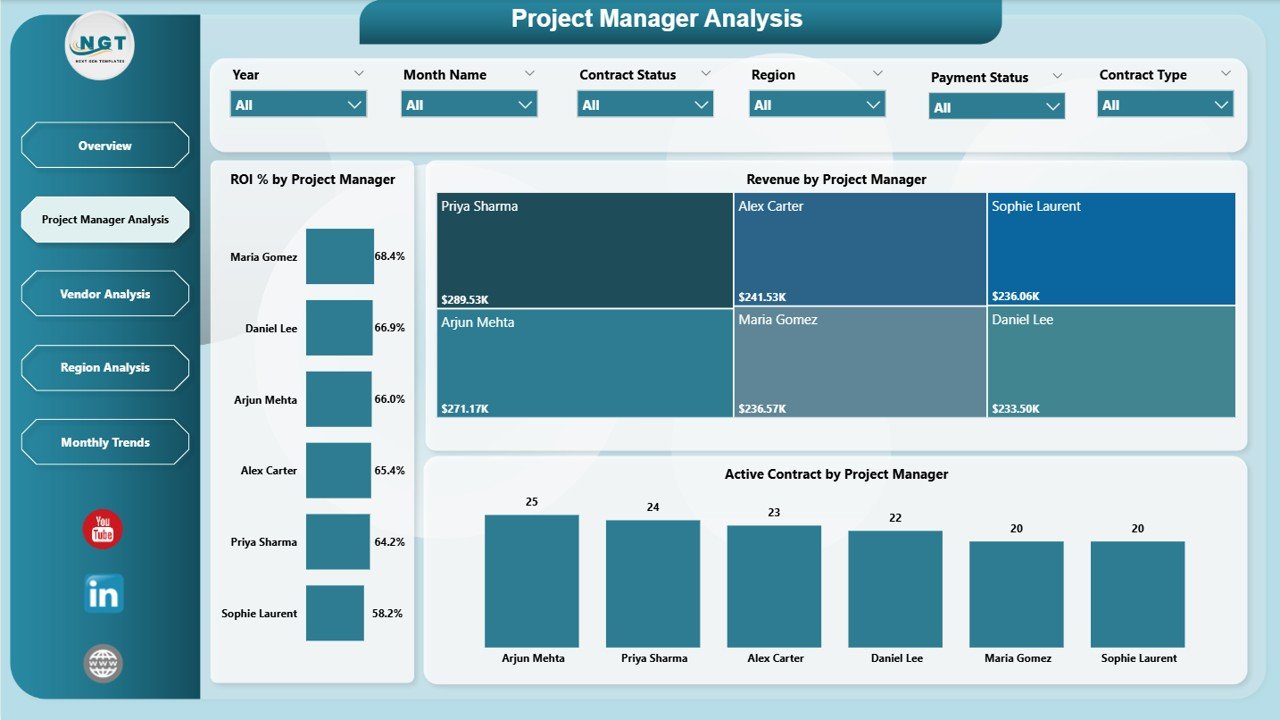
The Project Manager Analysis Page evaluates project performance based on project managers.
This page allows organizations to measure leadership effectiveness.
Charts on This Page
ROI % by Project Manager
Shows the return on investment generated by each project manager.
Revenue by Project Manager
Displays revenue generated from contracts managed by each project manager.
Active Contract by Project Manager
Shows the number of active contracts assigned to each manager.
This analysis helps organizations identify top-performing project leaders.
3. Vendor Analysis – Supplier Performance Insights
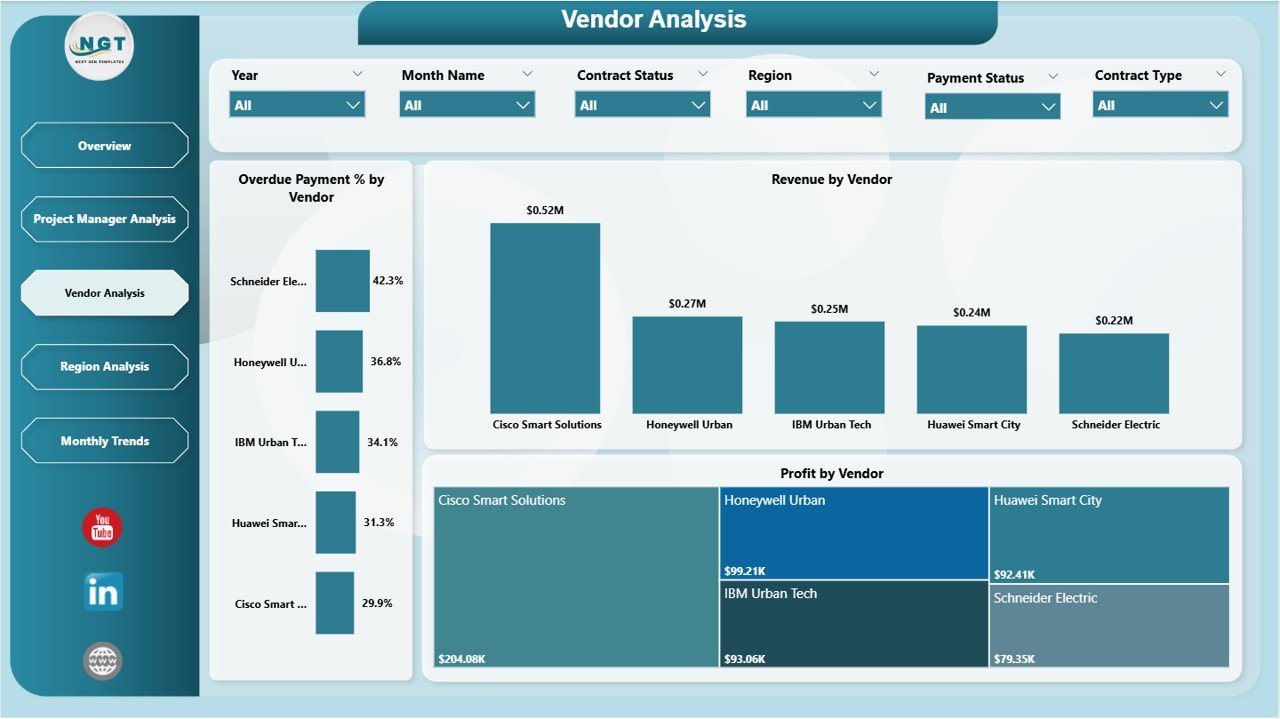
The Vendor Analysis Page focuses on vendor performance across smart city projects.
Vendors play an important role in project implementation, making this analysis critical.
Charts on This Page
Overdue Payment % by Vendor
Displays the percentage of overdue payments associated with each vendor.
Revenue by Vendor
Shows revenue generated from contracts related to specific vendors.
Profit by Vendor
Displays profit contribution from each vendor.
This analysis helps organizations evaluate vendor efficiency and financial impact.
4. Region Analysis – Regional Contract Performance
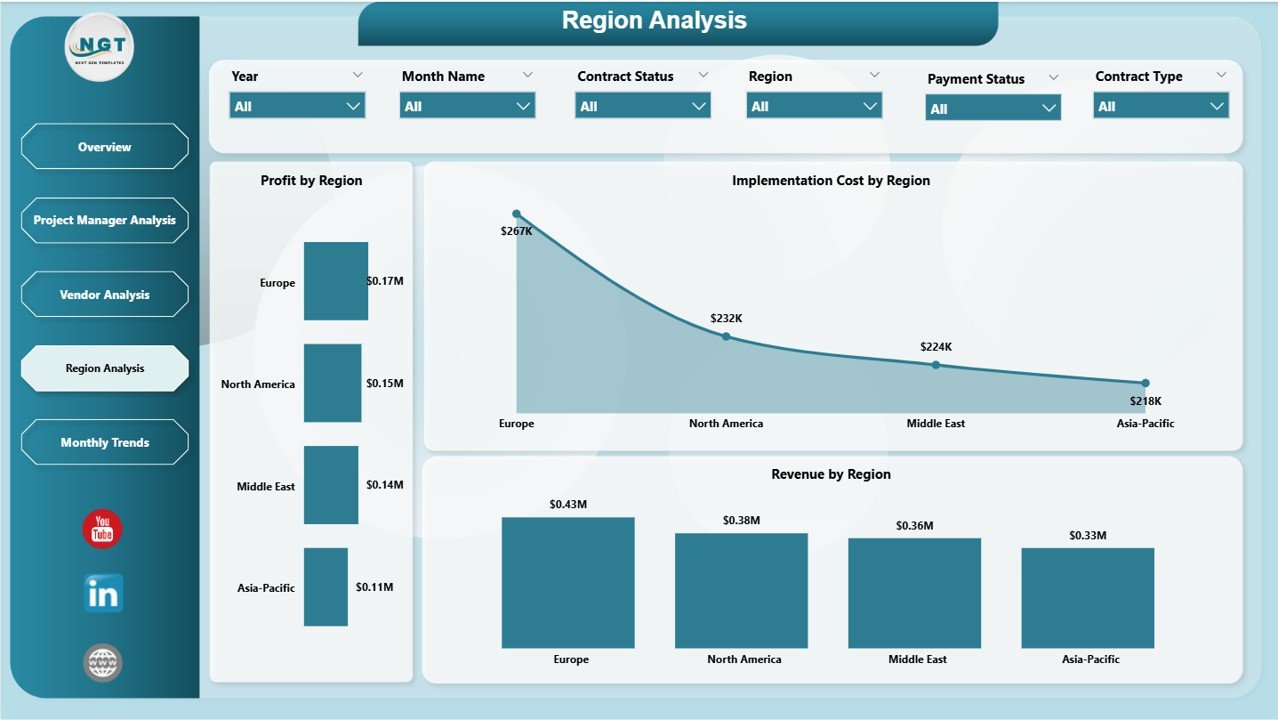
The Region Analysis Page analyzes contract performance across different geographic regions.
Smart city projects often span multiple cities or districts, making regional monitoring essential.
Charts on This Page
Profit by Region
Shows profitability of projects in different regions.
Implementation Cost by Region
Displays spending across regional smart city initiatives.
Revenue by Region
Shows revenue generated from regional contracts.
This analysis allows governments and agencies to allocate resources efficiently.
5. Monthly Trends – Financial Performance Over Time
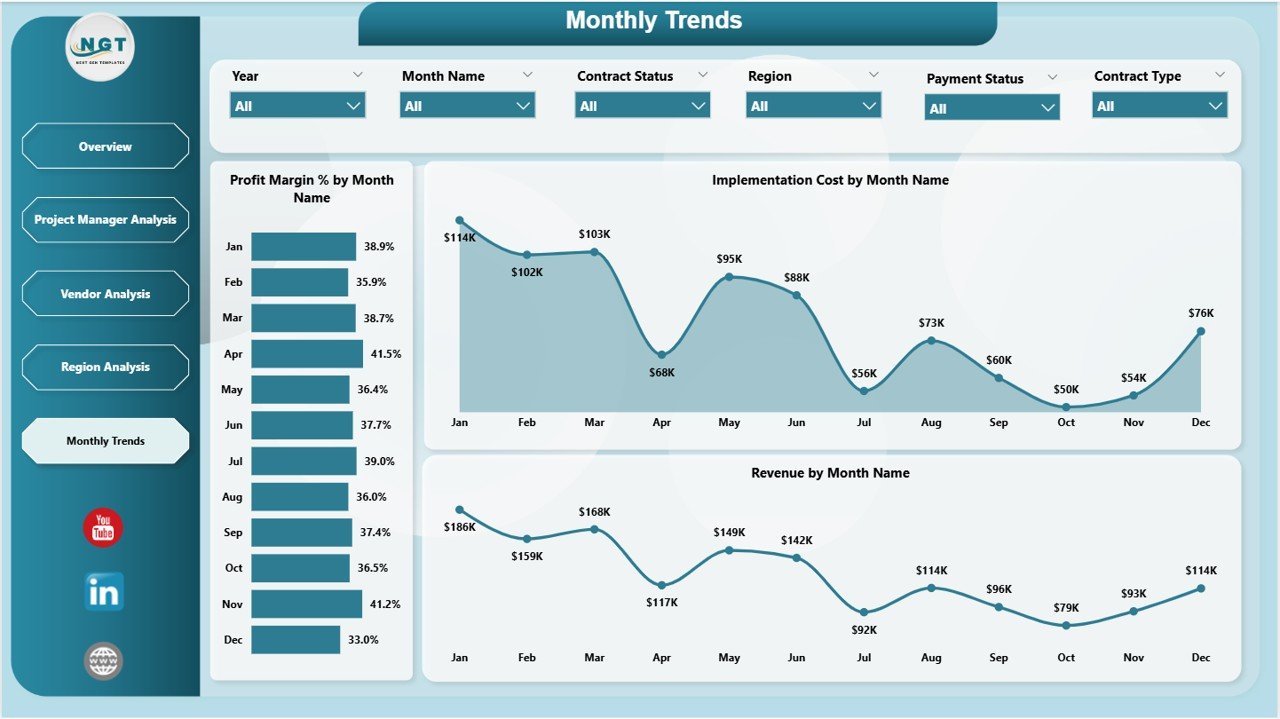
The Monthly Trends Page provides insights into financial performance trends across months.
Understanding these trends helps organizations plan budgets and project schedules effectively.
Charts on This Page
Profit Margin % by Month Name
Displays monthly profitability trends.
Implementation Cost by Month Name
Shows monthly project spending.
Revenue by Month Name
Displays revenue fluctuations throughout the year.
These insights help organizations monitor financial growth and seasonal variations.
Click to Purchases Smart Cities Contract Dashboard in Power BI
Advantages of the Smart Cities Contract Dashboard in Power BI
Using this dashboard offers several operational and strategic advantages.
Centralized Contract Monitoring
All smart city contract data appears in one dashboard.
Improved Financial Visibility
Managers can easily monitor cost, revenue, and profitability.
Better Project Management
Project leaders can track contract performance in real time.
Vendor Performance Insights
Organizations can evaluate vendor contributions and payment behavior.
Regional Performance Monitoring
Decision-makers can analyze project performance across different regions.
Faster Decision Making
Visual analytics simplify complex contract data.
Time-Saving Reporting
The dashboard eliminates the need for manual reporting.
Opportunities for Improvement
Although the dashboard provides powerful insights, organizations can enhance it further.
For example:
-
Add project risk monitoring metrics
-
Track contract timeline delays
-
Include payment aging analysis
-
Integrate IoT project performance data
-
Monitor sustainability KPIs
-
Track vendor reliability scores
These improvements can provide deeper operational insights.
Click to Purchases Smart Cities Contract Dashboard in Power BI
Best Practices for the Smart Cities Contract Dashboard in Power BI
Organizations should follow best practices to maximize the value of the dashboard.
Maintain Accurate Data Sources
Ensure project data remains updated regularly.
Define Clear KPI Metrics
Use consistent formulas for cost, revenue, and profit calculations.
Monitor Contract Performance Regularly
Review dashboard insights frequently.
Focus on Actionable Metrics
Track KPIs that influence project success.
Train Stakeholders
Ensure project teams understand how to interpret dashboard data.
Analyze Long-Term Trends
Evaluate trends instead of focusing only on monthly performance.
Conclusion
The Smart Cities Contract Dashboard in Power BI provides a powerful analytics platform for monitoring smart city project contracts.
Instead of analyzing complex data across multiple reports, organizations can centralize contract monitoring within a single interactive dashboard.
With features such as KPI cards, project manager analysis, vendor insights, regional monitoring, and monthly trend analysis, the dashboard helps governments and organizations manage smart city initiatives effectively.
Moreover, Power BI’s dynamic visualization capabilities allow decision-makers to track performance, control budgets, and improve project outcomes.
Therefore, organizations that adopt this dashboard can significantly enhance contract management and ensure successful smart city development.
Frequently Asked Questions (FAQs)
What is a Smart Cities Contract Dashboard in Power BI?
It is an interactive Power BI dashboard used to track smart city project contracts, financial performance, and operational progress.
Who should use this dashboard?
Government agencies, urban planners, project managers, contractors, and infrastructure development teams can use this dashboard.
What metrics does the dashboard track?
The dashboard tracks implementation cost, revenue, profit, completion percentage, vendor performance, and regional analysis.
Can the dashboard handle multiple projects?
Yes. The dashboard can analyze multiple projects across different regions, vendors, and project managers.
Why is Power BI suitable for smart city analytics?
Power BI provides advanced visualization, interactive filtering, and real-time data analysis.
Can this dashboard integrate with other systems?
Yes. Power BI can connect with databases, Excel files, and enterprise systems for automated data updates.
Click to Purchases Smart Cities Contract Dashboard in Power BI
Visit our YouTube channel to learn step-by-step video tutorials