Introduction
The Chamber of Commerce KPI Dashboard is an essential tool designed to help outsourced accounting teams and chamber management track, analyze, and improve key performance indicators efficiently. This ready-to-use Excel dashboard template brings clarity to complex data and empowers decision-makers with up-to-date insights that drive better business outcomes.
Click to Purchases Chamber of Commerce KPI Dashboard in Excel
Key Features of Chamber of Commerce KPI Dashboard
- Comprehensive tracking of KPIs covering monthly, year-to-date (YTD), and previous year comparisons.
- Dynamic dashboard with selectable months to automatically update all relevant figures.
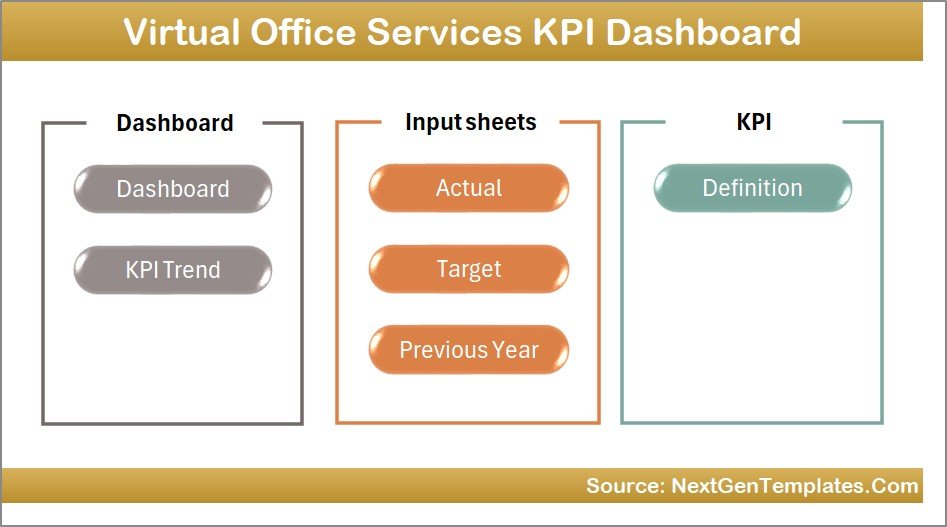
- Seven well-organized worksheets catering to various data inputs, KPI definitions, and visualizations.
- Conditional formatting with intuitive up/down arrows to visualize performance against targets.
- KPI trend analysis through clear charts showcasing actual performance versus targets and previous year benchmarks.
- Simple input sheets to enter actual, target, and previous year numbers ensuring data accuracy and easy updates.
- User-friendly interface with navigation buttons for quick access across sheets.
Dashboard Pages Explanation
1. Home Sheet
The Home Sheet acts as an interactive index with six clickable buttons that redirect users to respective sheets for easy navigation.
Home Page
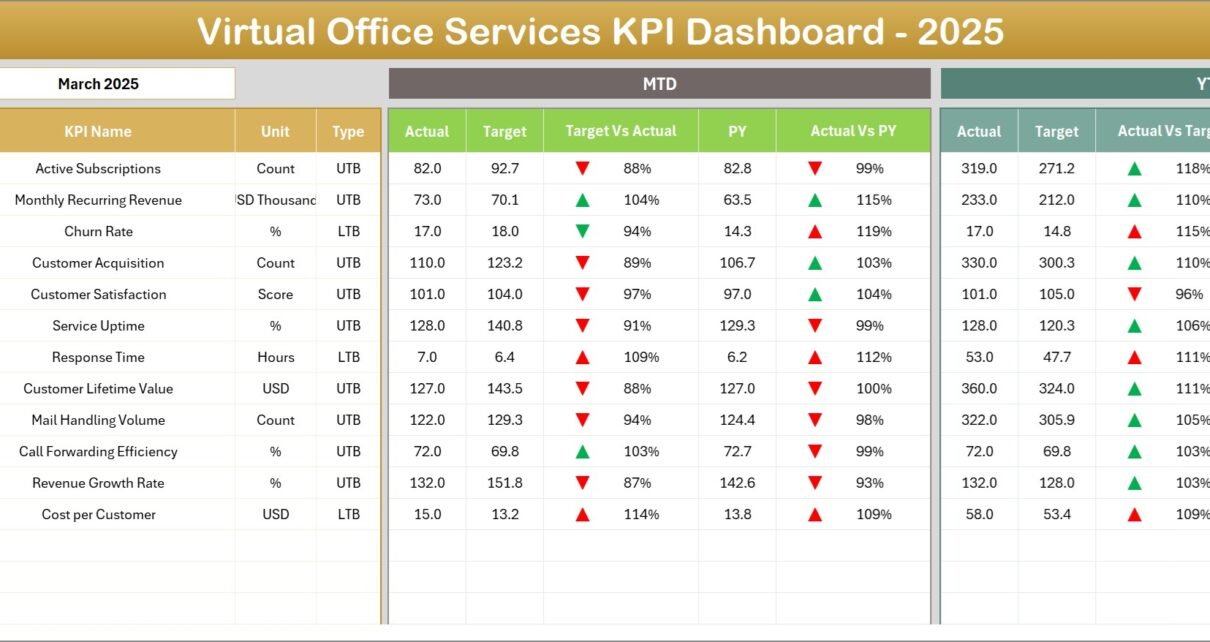
2. Dashboard Sheet
This is the main dashboard where all KPIs are summarized. Users can select a month via a dropdown (located at cell D3) that updates all dashboard figures accordingly.
- Displays Month-to-Date (MTD) Actual, Target, and Previous Year data.
- Includes YTD Actual, Target, and Previous Year comparisons.
- Conditional formatting with up and down arrows highlights performance trends for Target vs Actual and Previous Year vs Actual.
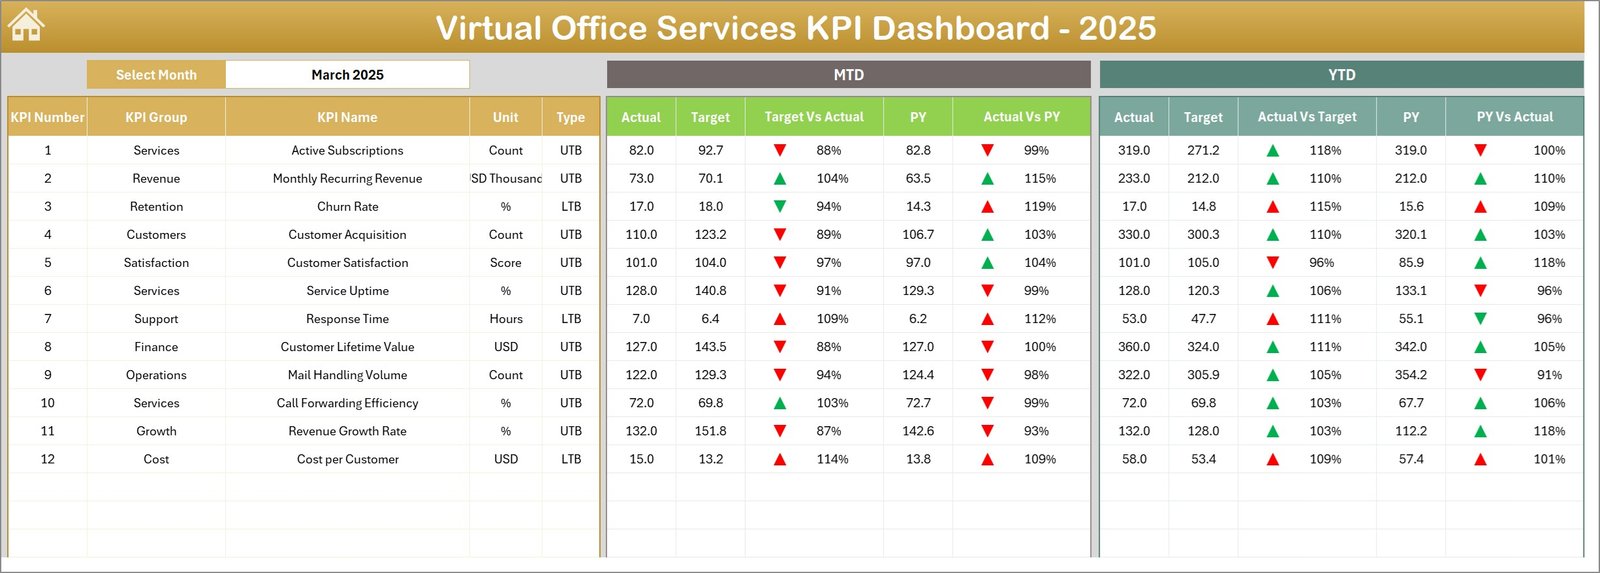
Chamber of Commerce KPI Dashboard
3. KPI Trend Sheet
This sheet enables deep dive into individual KPI trends. By selecting a KPI name from the dropdown in cell C3, the dashboard dynamically updates to show:
- KPI Group
- Unit of KPI
- Type of KPI (Lower the Better or Upper the Better)
- Formula used to calculate the KPI
- KPI Definition
-
Click to Purchases Chamber of Commerce KPI Dashboard in Excel
Additionally, MTD and YTD trend charts visualize Actual, Target, and Previous Year numbers.
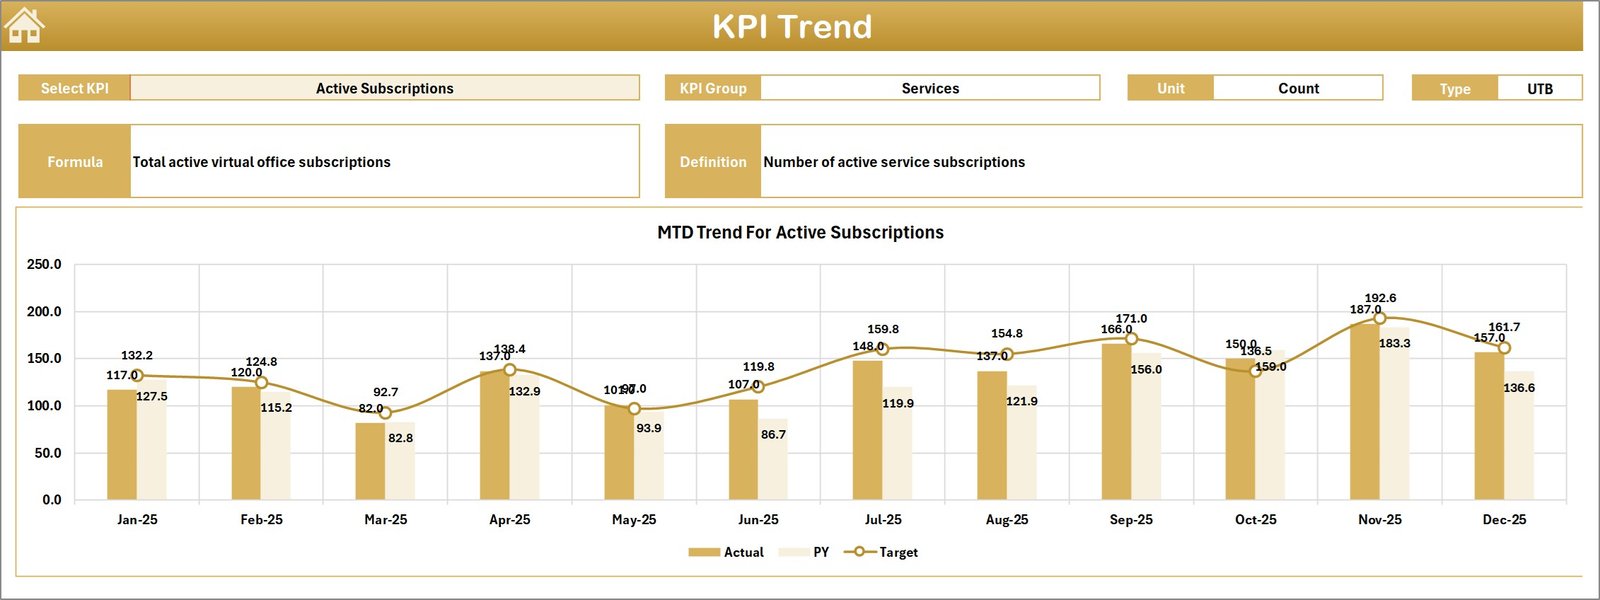
KPI Trend Sheet
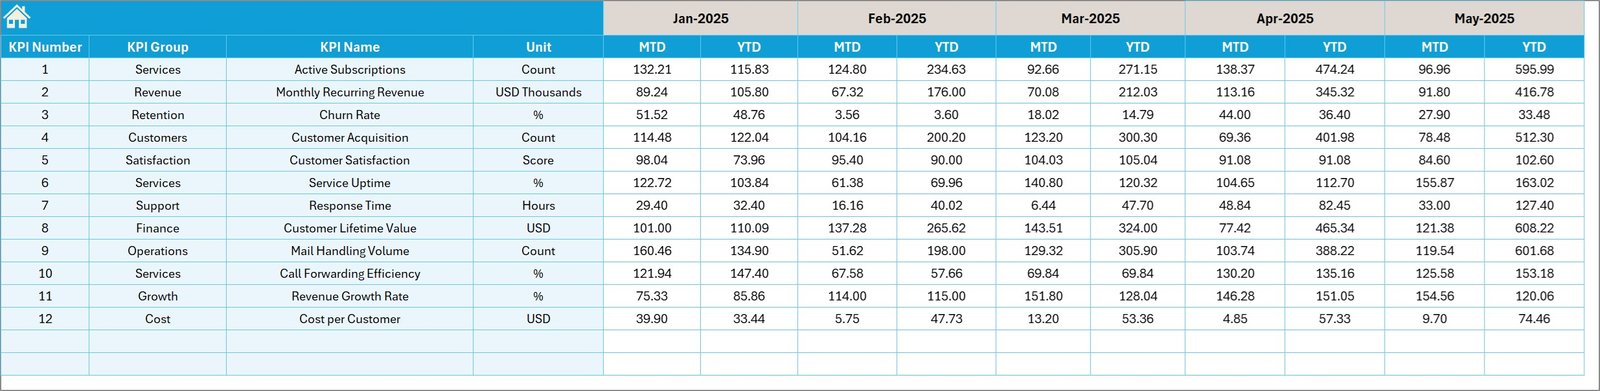
4. Actual Numbers Input Sheet
This sheet is dedicated for entering the actual performance numbers, both MTD and YTD, for each KPI. You can adjust the month by changing the value in cell E1 (first month of the year), which aligns the data accordingly.
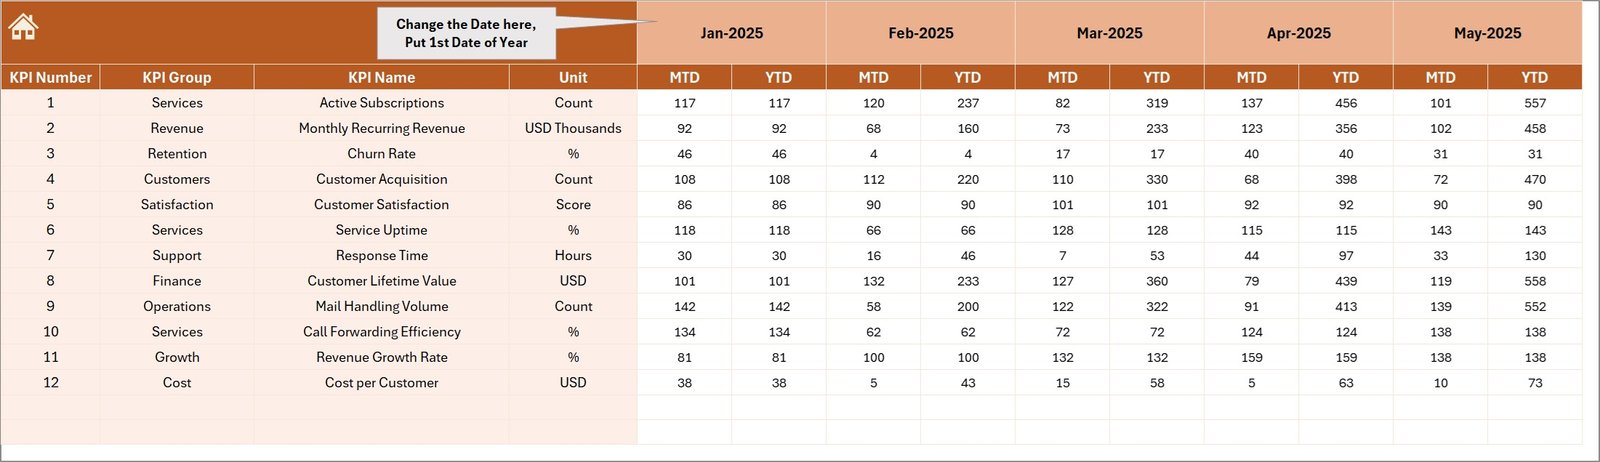
Actual Numbers Input sheet
5. Target Number Input Sheet
In this sheet, you input the target values for each KPI, both for MTD and YTD. Accurate entries here ensure that the dashboard correctly reflects performance versus goals.
Target Number Input sheet
6. Previous Year Number Sheet
To maintain historical context, this sheet lets you enter the previous year’s KPI numbers in a similar fashion to the current year entries.
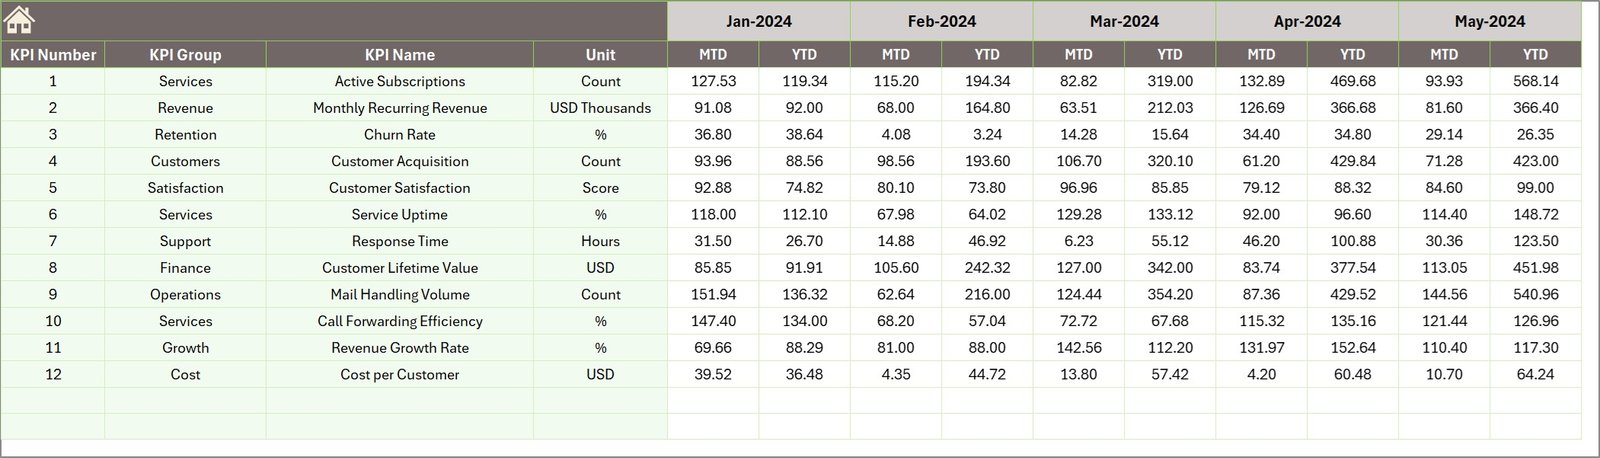
Previous Year Number Input sheet
7. KPI Definition Sheet
This sheet contains the foundational data for the KPIs including:
Click to Purchases Chamber of Commerce KPI Dashboard in Excel
- KPI Name
- KPI Group
- Unit of Measurement
- Formula for calculation
- Definition describing the KPI
- Type indicator (LTB – Lower the Better or UTB – Upper the Better)
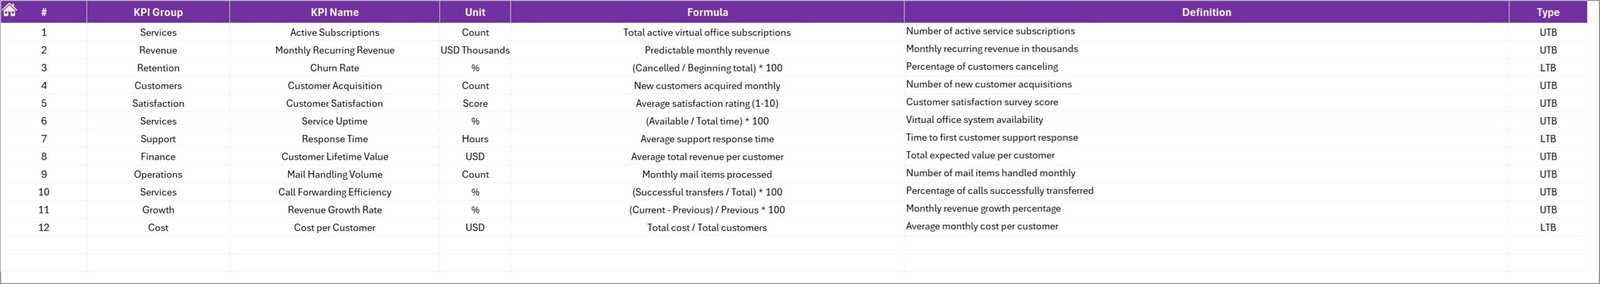
KPI Definition sheet
Advantages of Chamber of Commerce KPI Dashboard
- Ease of Use: Intuitive design with navigation buttons and dropdowns makes it accessible even to users without advanced Excel skills.
- Real-Time Insights: Dynamic month selection ensures the dashboard always reflects the latest data.
- Customization: Easily modify KPI definitions, target values, and actual inputs to suit any chamber or accounting setup.
- Comprehensive Tracking: Monitor trends over time for multiple KPIs in one place, helping identify areas for improvement.
- Visual Appeal: Conditional formatting and trend charts provide instant, clear understanding of performance status.
Opportunities for Improvement
- Integrate automation for data imports from accounting software to minimize manual entries.
- Add forecast capabilities with predictive modeling based on historic data.
- Introduce multi-user collaboration with cloud compatibility.
- Expand KPI library to include external benchmarks for competitive analysis.
Best Practices
- Regularly update actual and target values to keep dashboard data fresh.
- Review KPI definitions to ensure they remain aligned with chamber business goals.
- Use the trend charts for monthly performance reviews and strategy meetings.
- Leverage insights from this dashboard as a communicative tool for stakeholders.
FAQs
What KPIs are included in the Chamber of Commerce KPI Dashboard?
The dashboard is customizable, but typically includes financial, membership growth, event attendance, and engagement metrics relevant to chamber operations.
Can this dashboard integrate with accounting software?
Currently, data input is manual, but future updates may include integration with popular accounting platforms.
Is the dashboard compatible with all versions of Excel?
It is optimized for Excel 2016 and later versions, supporting advanced features like dropdowns and conditional formatting.
Conclusion
The Chamber of Commerce KPI Dashboard is a robust, user-friendly tool that delivers comprehensive insight into an organization’s performance, enabling actionable decisions and strategic growth. By consistently tracking KPIs through this dashboard, chambers can improve operational efficiency, member satisfaction, and overall impact.
To further enhance your understanding, visit Microsoft’s official Excel support page for advanced tips on Excel dashboards.
Visit our YouTube channel to watch the demo: Youtube.com/@NextGenTemplates