Introduction
The Prosthetics Manufacturing KPI Dashboard is an essential tool designed to streamline the monitoring and analysis of key performance indicators within the prosthetics manufacturing industry. This ready-to-use template enables manufacturers to track monthly and yearly performance data efficiently, allowing for actionable insights and strategic decision-making.Hearing Aid, KPI Dashboard, Excel Template, Performance Management, Healthcare Analytics
Key Features of Prosthetics Manufacturing KPI Dashboard
- Comprehensive tracking of Monthly To Date (MTD) and Year To Date (YTD) actuals alongside targets and previous year data.
- Conditional formatting with intuitive up/down arrows to highlight performance trends.
- Seven distinct worksheets catering to different aspects of data input and visualization.
- User-friendly drop-down selections for dynamic data interaction.
- Clear KPI definitions with groups, units, formulas, and performance types.
- Trend charts to visualize KPI progress over time.
- Seamless navigation with a Home sheet featuring direct buttons to all key tabs.
Dashboard Pages Explanation
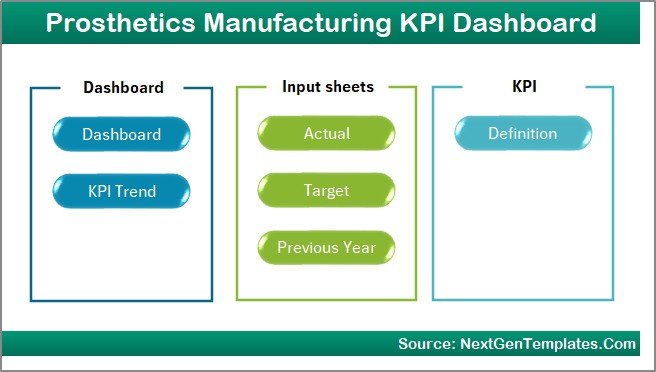
1. Home Sheet
This is the index or landing page designed for seamless navigation across the dashboard. It features six buttons linking to the respective sheets, placing all critical components at your fingertips.
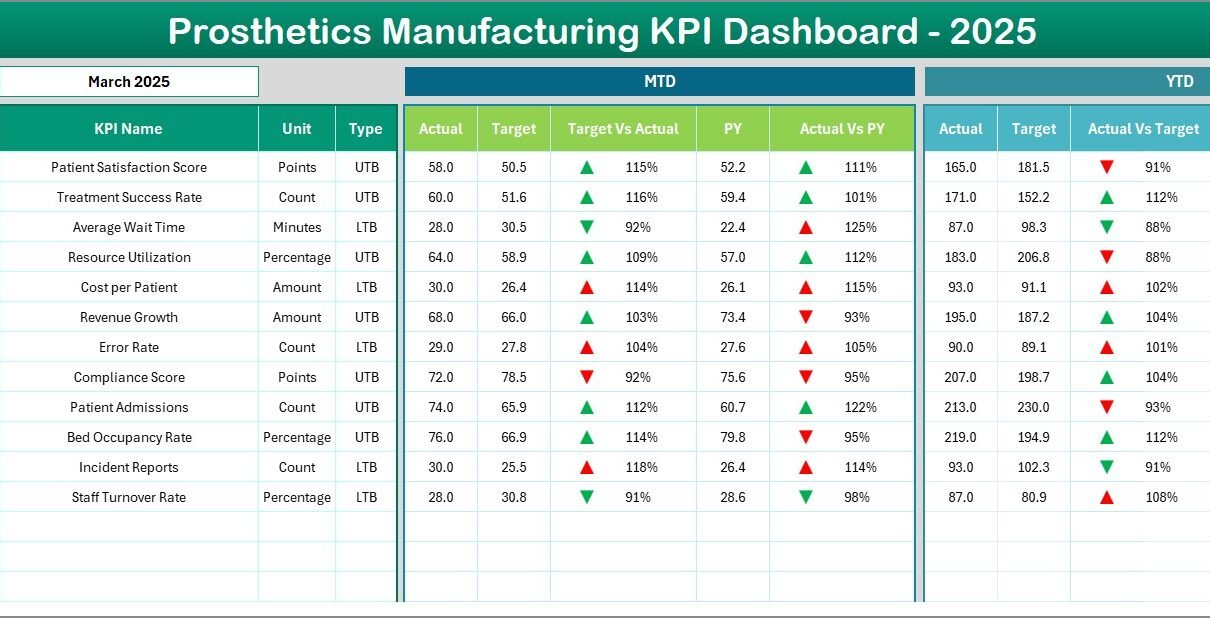
2. Dashboard Sheet
The main analytical hub of the dashboard where you can select a month from the drop-down (D3) to view dynamic KPI metrics. It displays MTD actuals, targets, previous year data, plus comparative insights through conditional formatting using upward and downward arrows. Year To Date (YTD) figures are also presented similarly.

Prosthetics Manufacturing KPI Dashboard
Click to Buy Prosthetics Manufacturing KPI Dashboard in Excel
3. KPI Trend Sheet
This sheet provides deeper insights by allowing you to select any KPI from a drop-down (C3). Here, you will find KPI group classification, units of measurement, performance type (Lower the Better – LTB or Upper the Better – UTB), KPI formulas, and detailed definitions. MTD and YTD trend charts compare actual, target, and previous year statistics graphically.
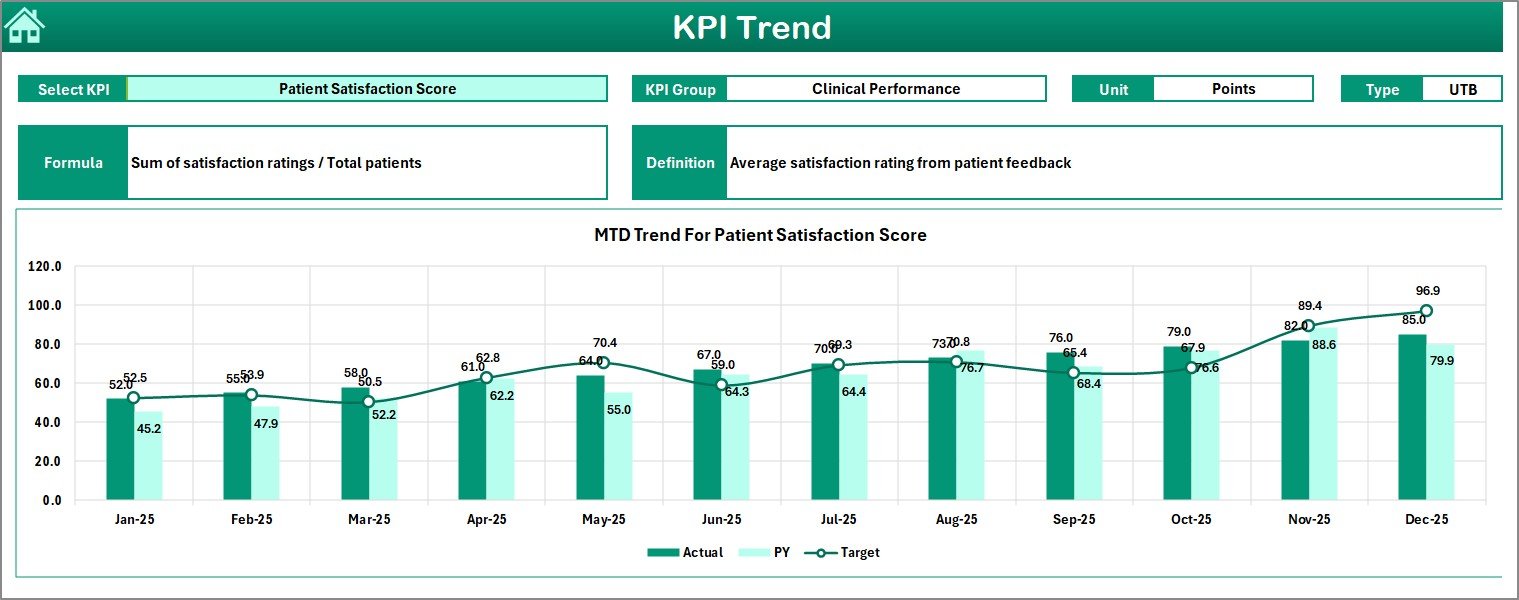
KPI Trend Sheet
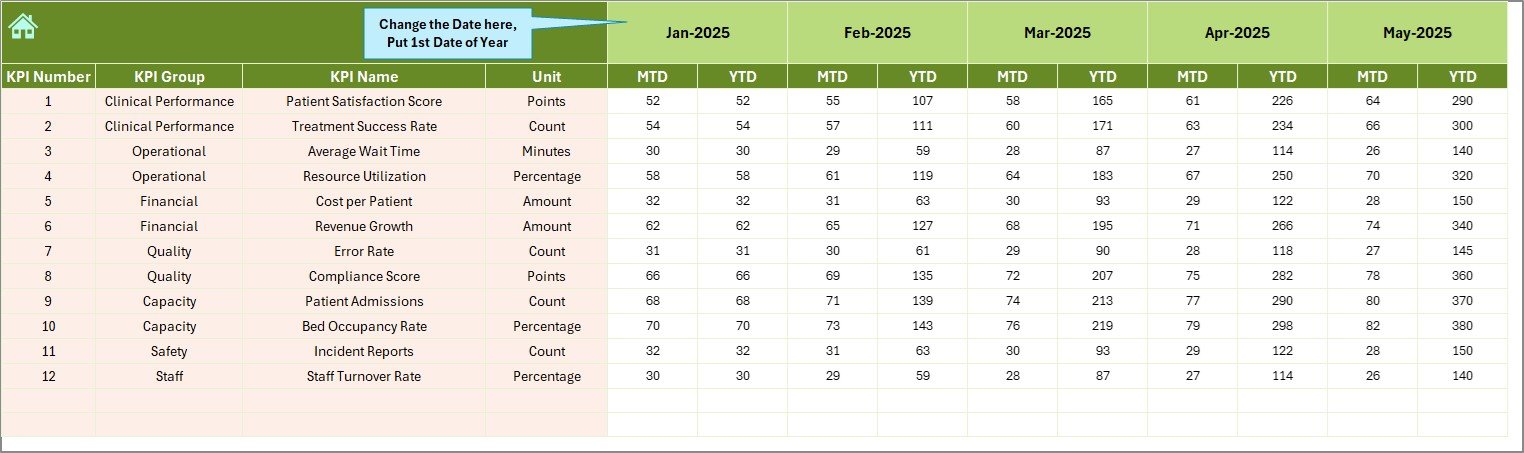
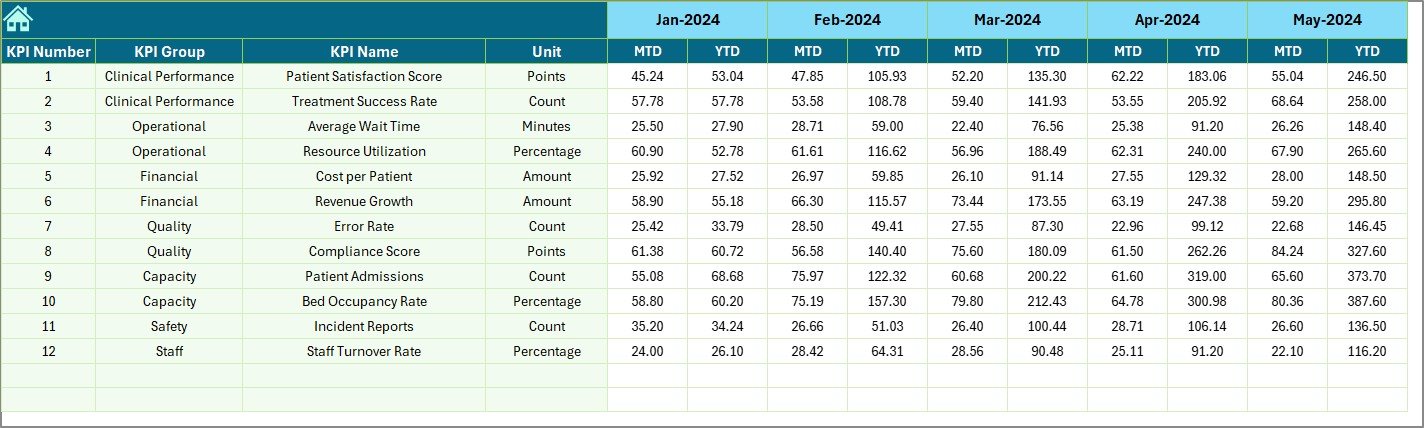
4. Actual Numbers Input Sheet
Input the actual results for MTD and YTD figures in this sheet. You can adjust the months starting point by changing the value in cell E1, which represents the first month of the manufacturing year.
5. Target Number Input Sheet
Enter the monthly target figures for each KPI in this sheet, covering both MTD and YTD goals. This data drives the dashboard’s comparative analyses and conditional formatting visual cues.
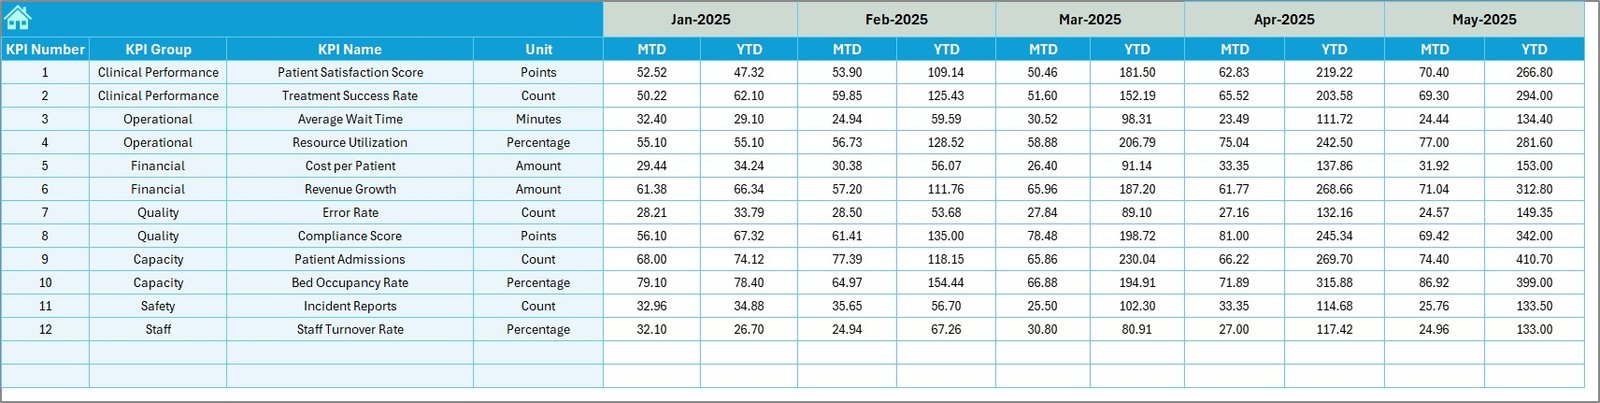
Target Number Input sheet
6. Previous Year Number Sheet
Input the previous year’s performance numbers here, preserving consistency with the current year’s data entry for accurate year-over-year comparisons.
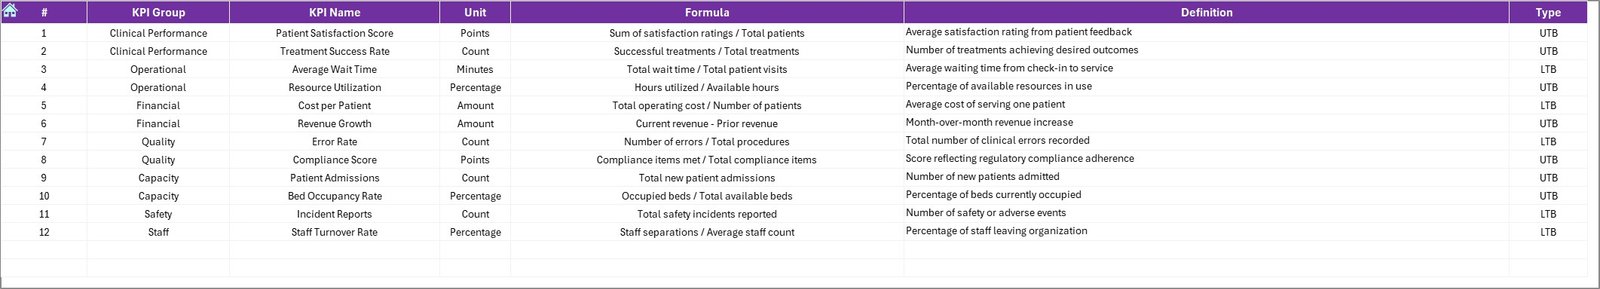
7. KPI Definition Sheet
This sheet houses critical KPI metadata including KPI names, grouping, units, formulas, and clear definitions. Importantly, it categorizes KPIs as LTB (Lower the Better) or UTB (Upper the Better), which is vital for correct dashboard logic and conditional formatting.
KPI Definition sheet
Advantages of Prosthetics Manufacturing KPI Dashboard
- Improved Decision Making: Access to real-time and historic KPI data enables better operational and strategic decisions.
- Time Efficiency: Automated calculations and visuals save time otherwise spent on manual reporting.
- Enhanced Data Accuracy: Defined input sheets reduce errors and ensure consistency across datasets.
- Business Alignment: Targets and trend comparisons keep all departments aligned with company goals.
- Visual-Driven Insights: Conditional formatting and charts provide quick, understandable performance snapshots.
Opportunities for Improvement
Click to Buy Prosthetics Manufacturing KPI Dashboard in Excel
- Integrating real-time data connectivity for live updates.
- Advanced analytics support such as predictive forecasting.
- Mobile-friendly dashboard versions for on-the-go monitoring.
- Custom alert systems based on KPI thresholds.
- Further automation in data import/export processes.
Best Practices
- Regularly update Actual, Target, and Previous Year data to keep the dashboard current.
- Verify KPI definitions and formulas for accuracy and relevance.
- Use the drop-down selectors consistently to avoid errors in data display.
- Train team members on interpreting dashboard visuals and data trends.
- Back up your dashboard file frequently to protect against data loss.
FAQs
Click to Buy Prosthetics Manufacturing KPI Dashboard in Excel
What software is this dashboard designed for?
This KPI dashboard is designed specifically for Microsoft Excel, leveraging its data validation and conditional formatting capabilities.
Can I customize KPIs for my own manufacturing facility?
Yes, the KPI Definition sheet allows you to add or modify KPIs to suit your specific operational needs.
Is this dashboard suitable for non-manufacturing businesses?
While tailored for prosthetics manufacturing, the framework can be adapted to other industries by redefining KPIs and targets.
How often should data be updated?
Monthly input is advised to maintain accurate MTD and YTD reporting, but more frequent updates can enhance responsiveness.
Does the dashboard support multi-user collaboration?
Excel online versions or shared network drives can be used for collaboration, but concurrent editing may require management.
Conclusion
The Prosthetics Manufacturing KPI Dashboard offers an all-encompassing, user-friendly solution to track and analyze vital manufacturing performance indicators. By leveraging this dashboard, prosthetics manufacturers can drive operational efficiency, track progress against targets, and empower data-driven decision making.
Embrace this dashboard to transform your prosthetics manufacturing analytics and stay ahead in a competitive industry.
Learn more about Microsoft Excel
Visit our YouTube channel to watch the demo.
Click to Buy Prosthetics Manufacturing KPI Dashboard in Excel