In today’s fast-paced retail world, aquatic pet stores must manage multiple operations—from product sales and inventory to customer satisfaction and return rates. However, handling all this data manually can quickly become confusing and time-consuming.
Many store owners still depend on disconnected reports and spreadsheets. As a result, they miss valuable insights and struggle to make informed decisions.
That’s exactly where the Aquatic Pet Stores Dashboard in Power BI becomes a powerful solution. 🚀
This ready-to-use dashboard helps you monitor sales, analyze product performance, track customer behavior, and evaluate store performance—all in one interactive platform. Moreover, it converts complex data into clear visuals, so you can make faster and smarter business decisions.
In this detailed guide, you will learn everything about this dashboard, including features, structure, advantages, best practices, and FAQs.
Click to Purchases Aquatic Pet Stores Dashboard in Power BI
📊 What is an Aquatic Pet Stores Dashboard in Power BI?
An Aquatic Pet Stores Dashboard in Power BI is an interactive analytics tool designed to track and analyze retail performance using dynamic charts, KPIs, and filters.
Instead of managing multiple Excel files, you can centralize all your business data into one dashboard. Therefore, you improve efficiency, reduce errors, and gain real-time insights.
This dashboard helps you monitor:
-
🛒 Total Transactions
-
💰 Total Sales Amount
-
📦 Cost of Goods
-
📊 Quantity Sold
-
⭐ Customer Satisfaction
-
🔁 Return Rate
-
📍 Store & Product Performance
Because Power BI provides real-time updates and interactive visuals, you can instantly analyze trends and take action.
🤔 Why Do You Need an Aquatic Pet Store Dashboard in Power BI?
Managing a retail business without proper analytics creates challenges. However, a Power BI dashboard simplifies everything.
✅ Key Reasons:
-
Centralizes all business data
-
Provides real-time insights
-
Improves sales and return tracking
-
Enhances customer analysis
-
Supports better decision-making
As a result, you gain complete control over your store performance.
🧩 Key Features of Aquatic Pet Stores Dashboard in Power BI
This dashboard includes 5 powerful and interactive pages, each designed for specific analysis.
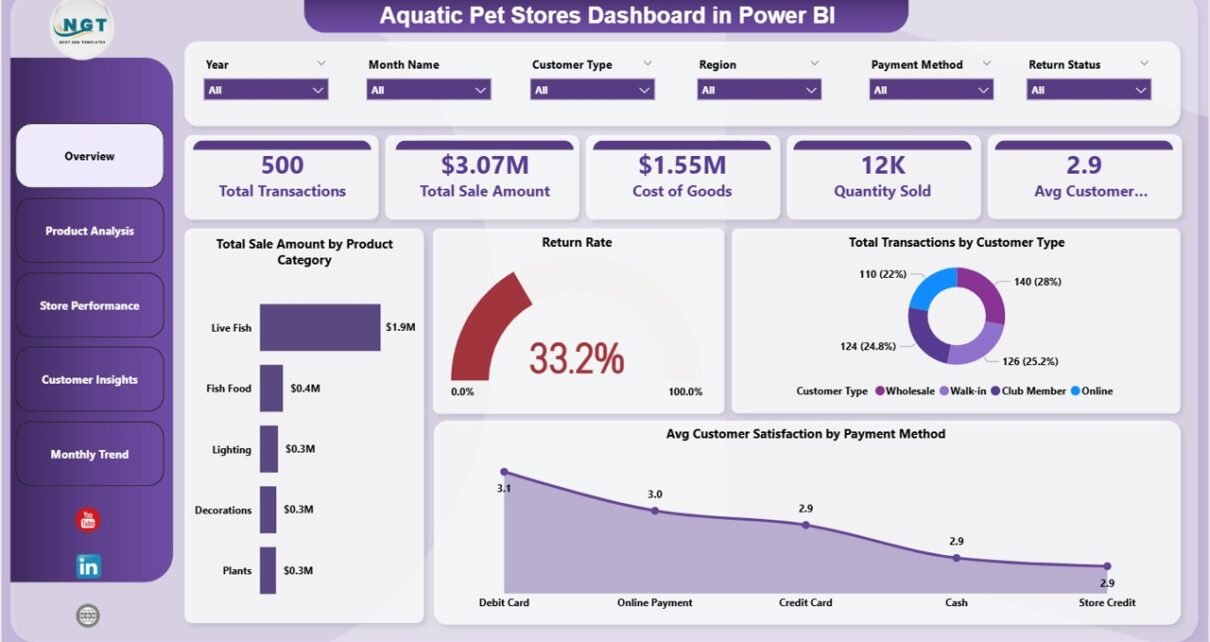
📌 1. Overview Page – Complete Business Snapshot
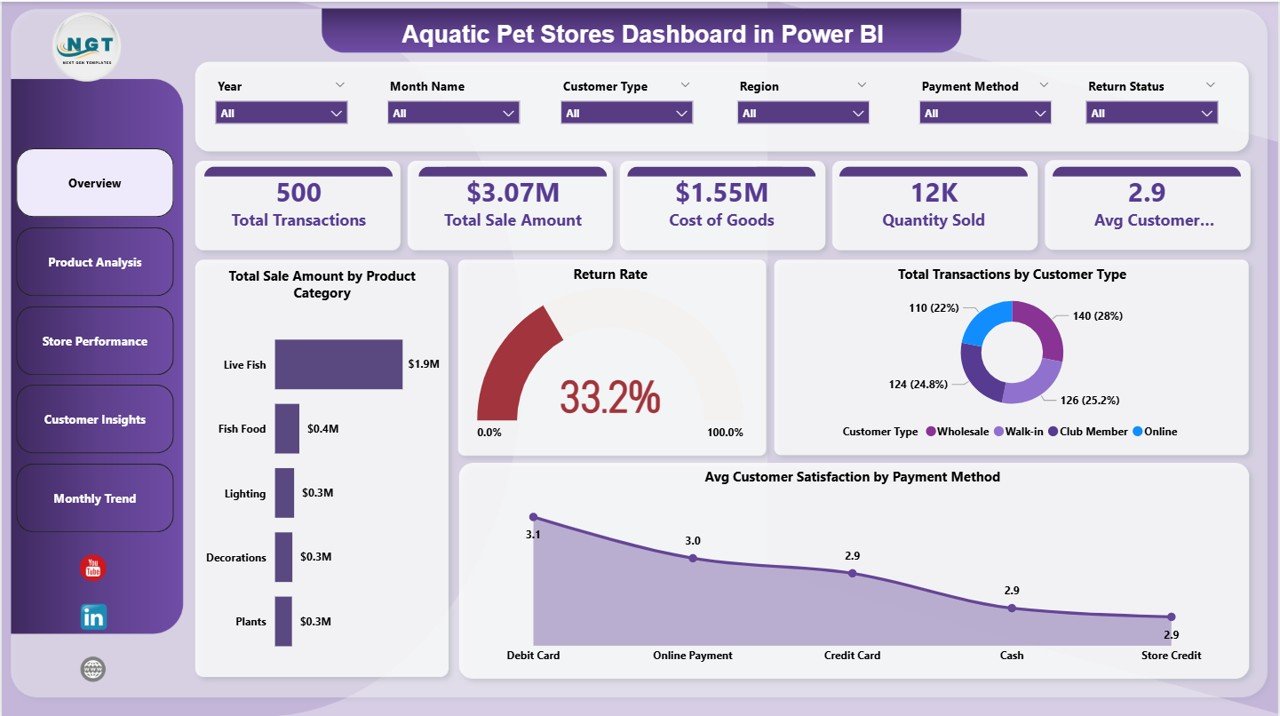
The Overview Page provides a quick summary of your store performance.
🔹 KPI Cards:
-
🛒 Total Transactions
-
💰 Total Sale Amount
-
📦 Cost of Goods
-
📊 Quantity Sold
-
⭐ Avg. Customer Satisfaction
📊 Charts:
-
Total Sale Amount by Product Category
-
Return Rate
-
Total Transactions by Customer Type
-
Avg Customer Satisfaction by Payment Method
👉 Therefore, this page gives a clear overview of your business.
Click to Purchases Aquatic Pet Stores Dashboard in Power BI
📦 2. Product Analysis – Which Products Perform Best?
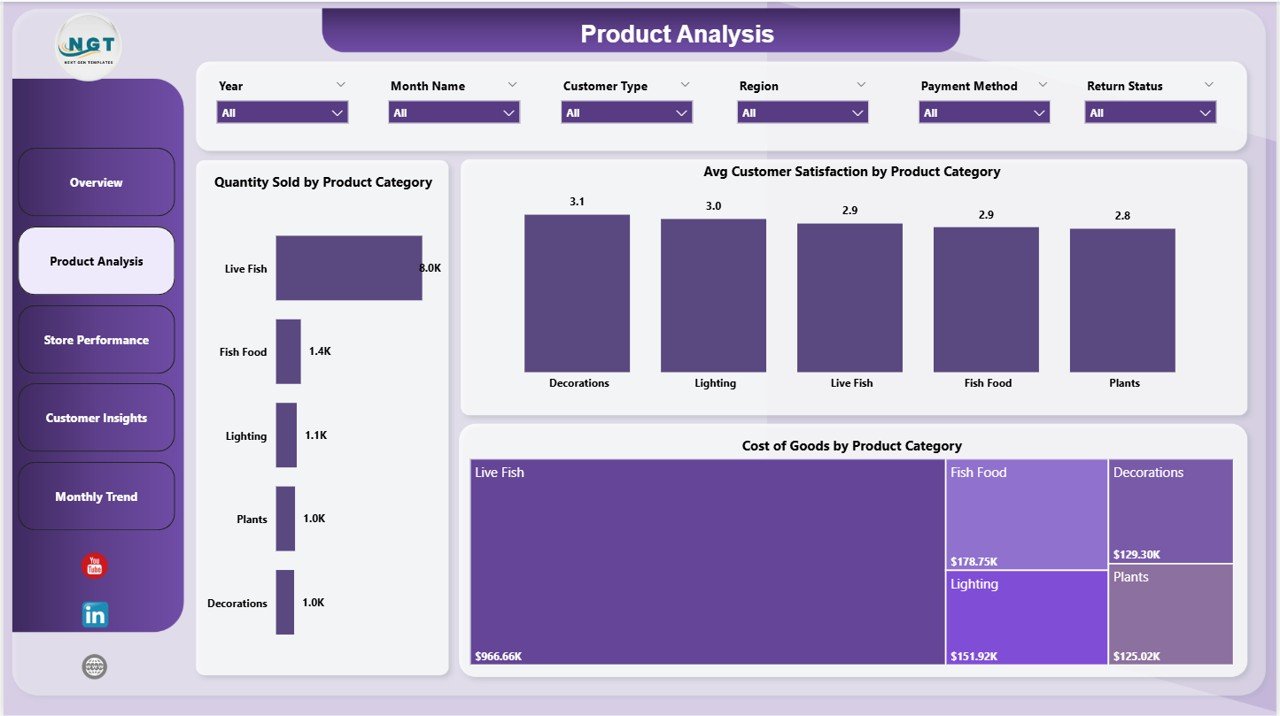
This page focuses on product-level insights.
📊 Charts Included:
-
Quantity Sold by Product Category
-
Avg Customer Satisfaction by Product Category
-
Cost of Goods by Product Category
👉 As a result, you can identify high-performing and low-performing products.
🏬 3. Store Performance – Evaluate Store Efficiency
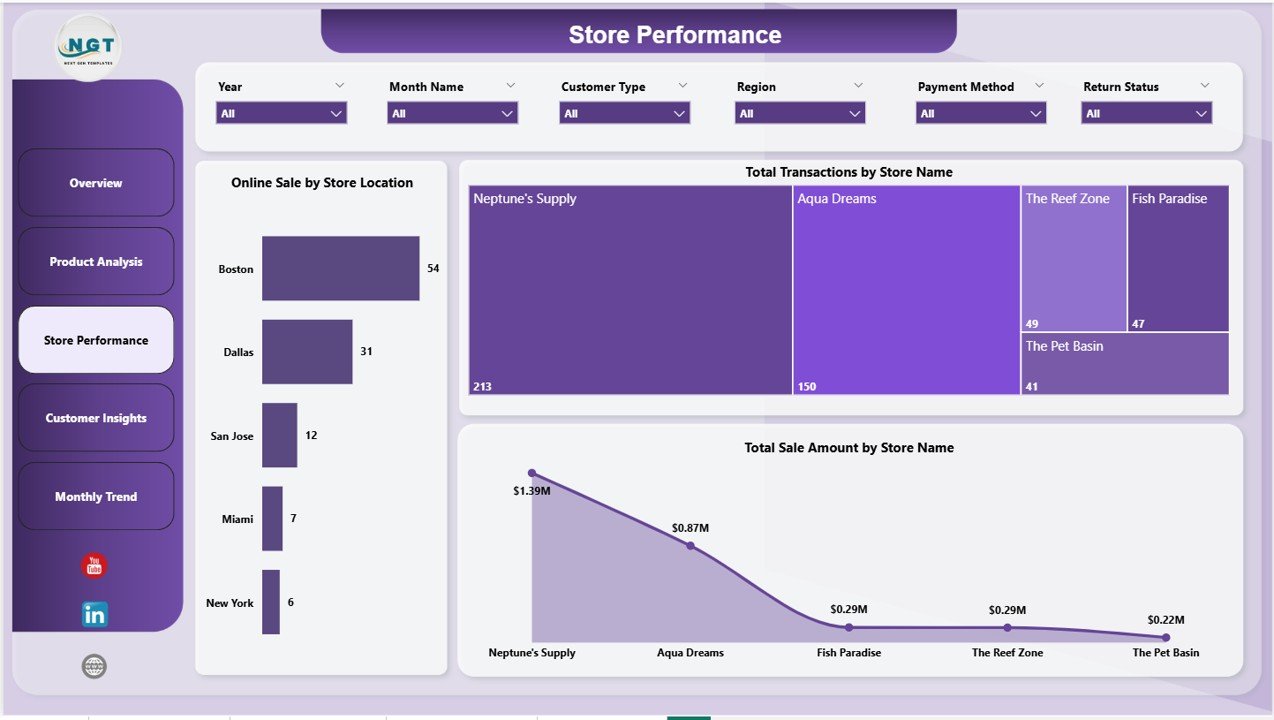
The Store Performance Page helps you analyze how different stores perform.
📊 Charts Included:
-
Online Sale by Store Location
-
Total Transactions by Store Name
-
Total Sale Amount by Store Name
👉 Therefore, you can compare store performance and optimize operations.
👥 4. Customer Insights – Understand Buying Behavior
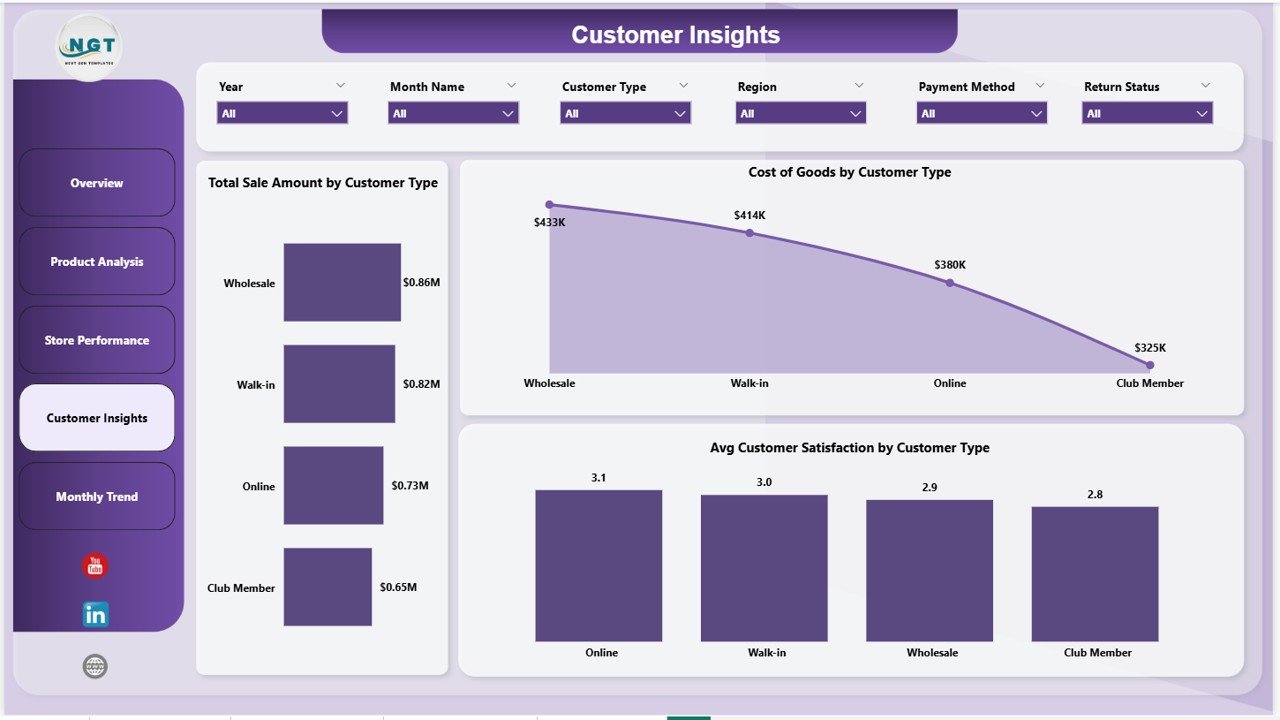
This page provides valuable insights into customer behavior.
📊 Charts Included:
-
Total Sale Amount by Customer Type
-
Cost of Goods by Customer Type
-
Avg Customer Satisfaction by Customer Type
👉 As a result, you can improve customer experience and retention.
📅 5. Monthly Trends – Track Growth & Return Patterns
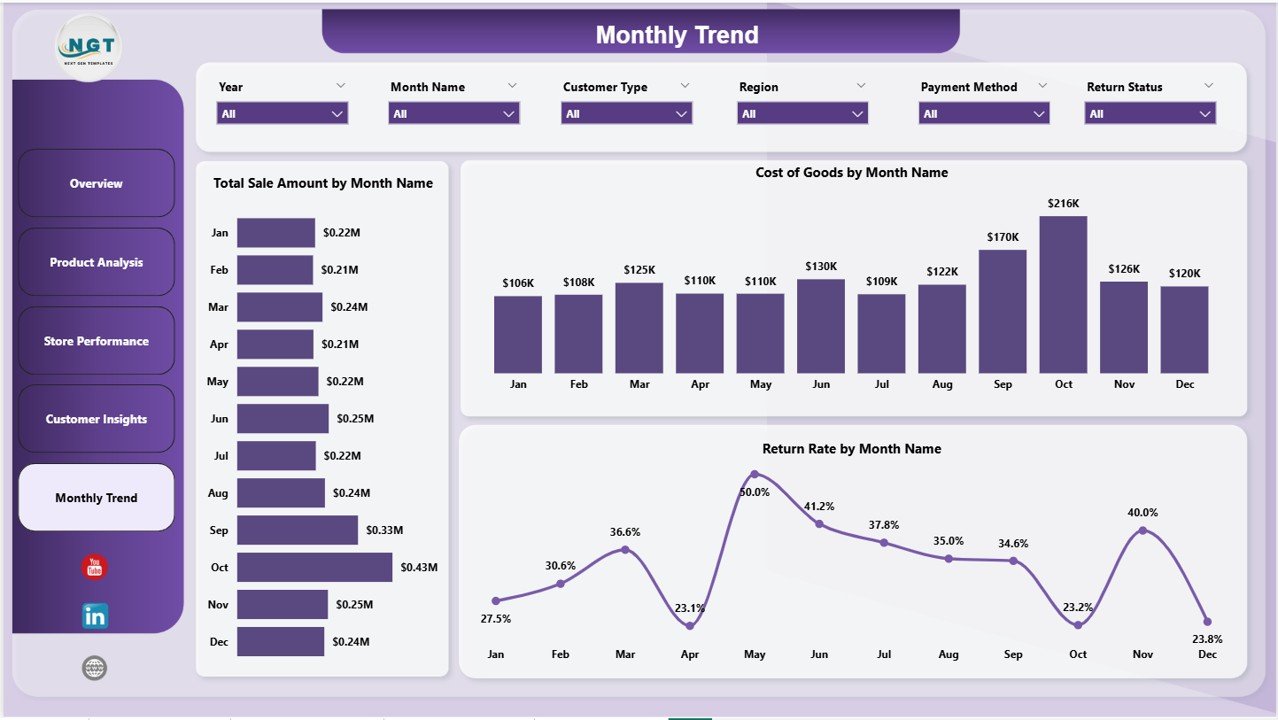
The Monthly Trends Page helps you monitor trends over time.
📊 Charts Included:
-
Total Sale Amount by Month
-
Cost of Goods by Month
-
Return Rate by Month
👉 Therefore, you can identify seasonal patterns and optimize strategies.
🌟 Advantages of Aquatic Pet Stores Dashboard in Power BI
Using this dashboard offers several powerful benefits.
💡 Key Advantages:
-
Real-Time Insights
You get instant data updates. -
Centralized Data Management
You manage everything in one place. -
Improved Sales Tracking
You monitor revenue and transactions easily. -
Better Return Analysis
You track return rates and reduce losses. -
Enhanced Customer Insights
You understand customer preferences clearly. -
Interactive Visuals
You explore data using filters and drill-down features.
⚙️ How to Use the Aquatic Pet Stores Dashboard in Power BI?
Using this dashboard is simple and efficient.
📌 Step-by-Step Guide:
-
Load Your Data
Import sales, product, and customer data into Power BI. -
Connect Data Sources
Link your datasets with the dashboard. -
Use Filters (Slicers)
Analyze data by store, category, or customer type. -
Review KPI Cards
Monitor key business metrics. -
Explore Charts
Drill down into detailed insights. -
Track Trends
Monitor monthly performance changes.
👉 As a result, you can turn data into actionable insights quickly.
📊 Advantages of Aquatic Pet Stores Dashboard
Using this dashboard improves business performance significantly.
💡 Additional Benefits:
-
Helps identify top-selling products
-
Improves inventory planning
-
Enhances customer satisfaction
-
Reduces return rates
-
Supports strategic decision-making
👉 Therefore, your business becomes more efficient and profitable.
Click to Purchases Aquatic Pet Stores Dashboard in Power BI
📊 Best Practices for the Aquatic Pet Stores Dashboard
To get the best results, follow these best practices:
✅ Best Practices:
-
Keep data updated regularly
-
Focus on key KPIs
-
Use filters for deeper insights
-
Monitor return rates closely
-
Compare store performance regularly
-
Keep visuals clean and simple
👉 As a result, you ensure accurate and meaningful insights.
🔍 Opportunities for Improvement in Aquatic Pet Store Analytics
Even with a dashboard, continuous improvement is essential.
💡 Key Improvement Areas:
-
Optimize product pricing strategies
-
Reduce cost of goods
-
Improve customer satisfaction
-
Increase online sales
-
Minimize product returns
👉 Therefore, your business can grow faster and smarter.
👥 Who Can Benefit from This Dashboard?
This dashboard is ideal for various users.
🎯 Ideal Users:
-
Pet Store Owners
-
Retail Managers
-
Business Analysts
-
Inventory Managers
-
Franchise Operators
👉 As a result, anyone managing aquatic pet stores can benefit from this tool.
🔮 Future of Retail Analytics in Pet Stores
Retail analytics continues to evolve. Therefore, dashboards will play a major role.
With Power BI:
-
You can predict customer behavior
-
You can automate reporting
-
You can optimize inventory
-
You can improve profitability
👉 As a result, data-driven retail management will become the standard.
📝 Conclusion
The Aquatic Pet Stores Dashboard in Power BI is a powerful and interactive tool that helps you track sales, monitor costs, analyze customer behavior, and manage returns.
It simplifies complex data and provides actionable insights. Moreover, it improves decision-making and boosts business performance.
If you want to grow your aquatic pet store business and make smarter decisions, this dashboard is the perfect solution. 🚀
Click to Purchases Aquatic Pet Stores Dashboard in Power BI
❓ Frequently Asked Questions (FAQs)
1. What is an Aquatic Pet Stores Dashboard in Power BI?
It is an interactive tool used to track sales, profit, customer insights, and store performance.
2. Who can use this dashboard?
Pet store owners, managers, and analysts can use it.
3. Does Power BI support real-time updates?
Yes, Power BI allows real-time or near real-time updates.
4. Can I customize the dashboard?
Yes, you can modify visuals, KPIs, and filters.
5. What are the key KPIs in this dashboard?
Total transactions, total sales, cost of goods, quantity sold, and customer satisfaction.
6. Is Power BI required to use this dashboard?
Yes, Power BI Desktop or Service is required.
7. How does this dashboard improve decision-making?
It provides clear insights that help you take faster and smarter actions.
Click to Purchases Aquatic Pet Stores Dashboard in Power BI
Visit our YouTube channel to learn step-by-step video tutorials