In today’s fast-evolving technology landscape,Brain-Computer Interfaces Dashboard in Excel
are transforming how humans interact with machines. From healthcare innovations to gaming and neuroscience research, BCI systems generate vast amounts of data every day. However, when this data remains scattered across multiple spreadsheets, it becomes difficult to analyze and act on it effectively.
So, how can you track performance, monitor device efficiency, and gain real-time insights from BCI data?
Click to Purchases Brain-Computer Interfaces Dashboard in Excel
👉 The answer is the Brain-Computer Interfaces Dashboard in Excel.
This powerful, ready-to-use Excel dashboard helps you visualize, analyze, and optimize BCI-related data in one centralized platform. Moreover, it converts complex datasets into meaningful insights using interactive charts, KPIs, and slicers. Therefore, you can make faster and smarter decisions.
In this detailed guide, you will learn everything about this dashboard, including features, benefits, usage, best practices, and FAQs.
📊 What is a Brain-Computer Interfaces Dashboard in Excel?
A Brain-Computer Interfaces Dashboard in Excel is an advanced data visualization tool designed to monitor and analyze key metrics related to BCI systems.
Instead of manually reviewing raw data, you can:
- Track user activity across devices
- Analyze performance metrics like accuracy and latency
- Monitor compliance and system status
- Compare costs across manufacturers and regions
Moreover, this dashboard simplifies complex neurological and technical data into easy-to-understand visuals. As a result, both technical and non-technical users can use it effectively.
Click to Purchases Brain-Computer Interfaces Dashboard in Excel
❓ Why Do You Need a BCI Dashboard?
Managing BCI data manually creates several challenges. For instance, you may face delays, errors, and missed insights.
However, with this dashboard:
- You centralize all data in one place
- You improve decision-making speed
- You identify trends quickly
- You enhance operational efficiency
Therefore, organizations working in neuroscience, healthcare, or AI can benefit greatly from this tool.
🚀 Key Features of Brain-Computer Interfaces Dashboard in Excel
This dashboard includes 5 interactive pages along with structured data sheets. Let’s explore each component in detail.
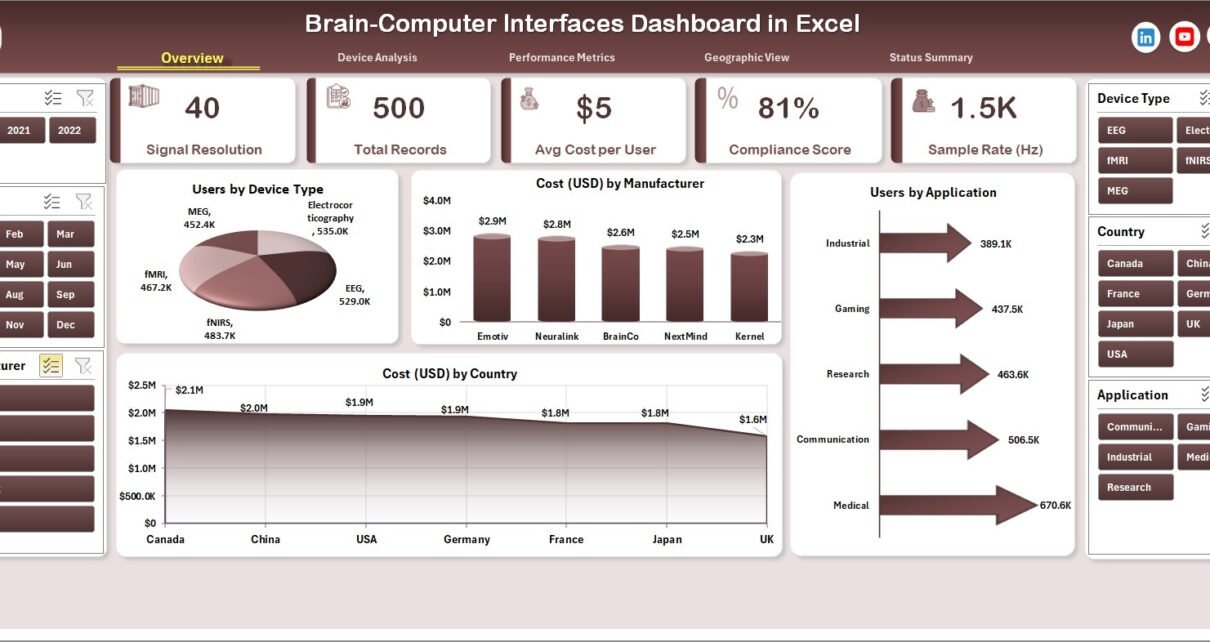
🔹 1. Overview Page – Quick Insights at a Glance
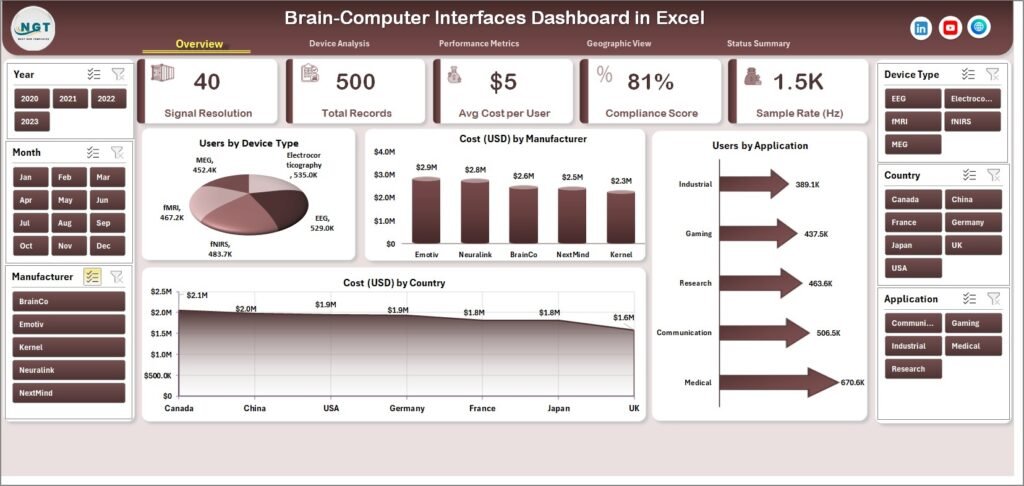
The Overview Page serves as the main dashboard interface. It provides a high-level summary of all critical metrics.
Key Highlights:
- 📌 Right-side slicer for dynamic filtering
- 📌 KPI Cards for quick performance tracking
- 📌 Interactive charts for instant insights
Charts Included:
- Users by Device Type
- Cost by Manufacturer
- Users by Application
- Cost (USD) by Country
👉 As a result, you can instantly understand overall performance and trends.
🔹 2. Device Analysis – Deep Dive into Devices
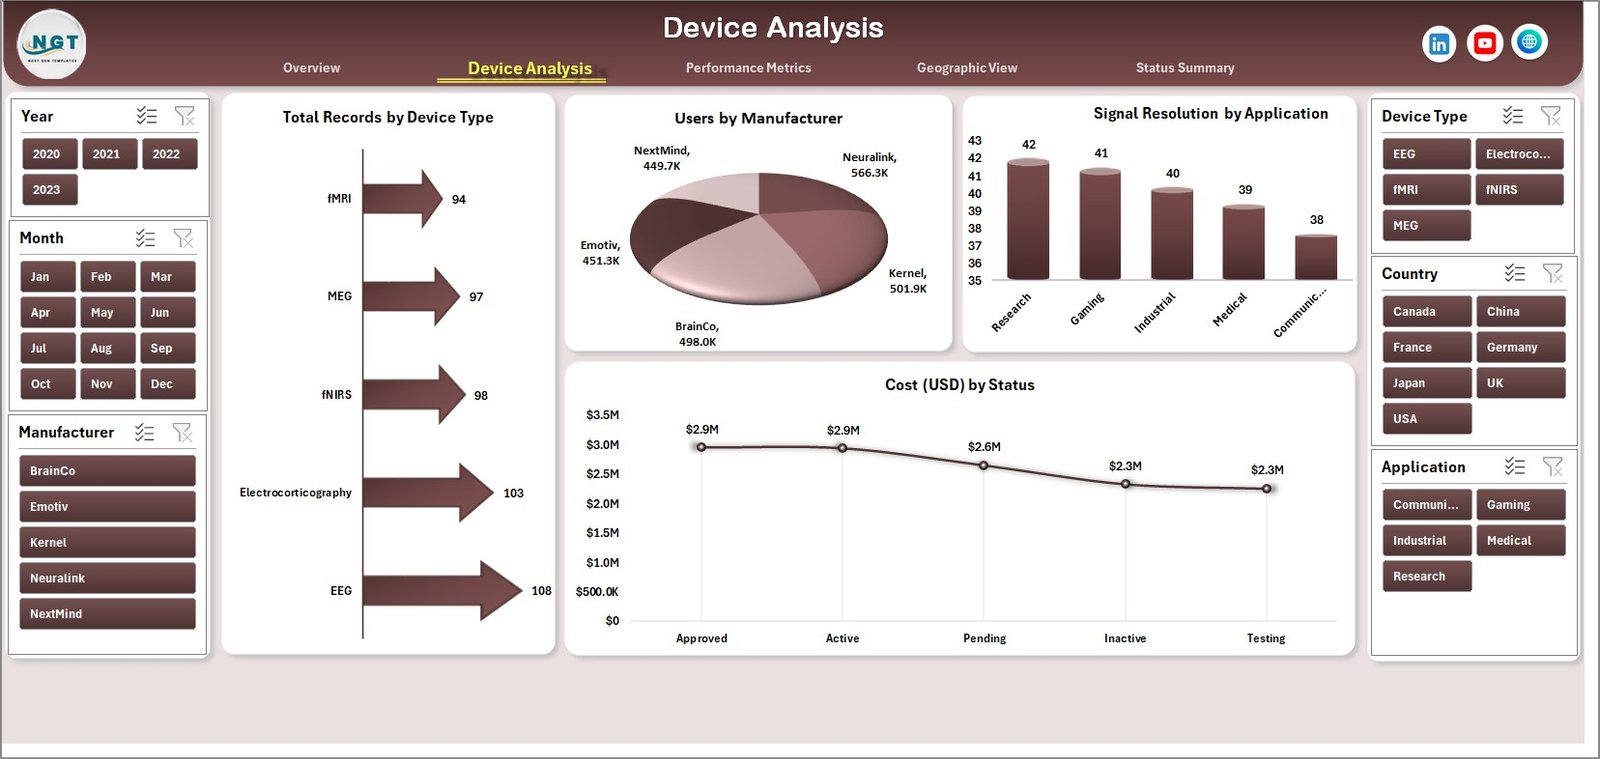
The Device Analysis page helps you evaluate device-level performance and usage.
Key Insights:
- Total Records by Device Type
- Users by Manufacturer
- Signal Resolution by Application
- Cost (USD) by Status
👉 Therefore, you can identify which devices perform best and optimize accordingly.
Click to Purchases Brain-Computer Interfaces Dashboard in Excel
🔹 3. Performance Metrics – Measure Efficiency
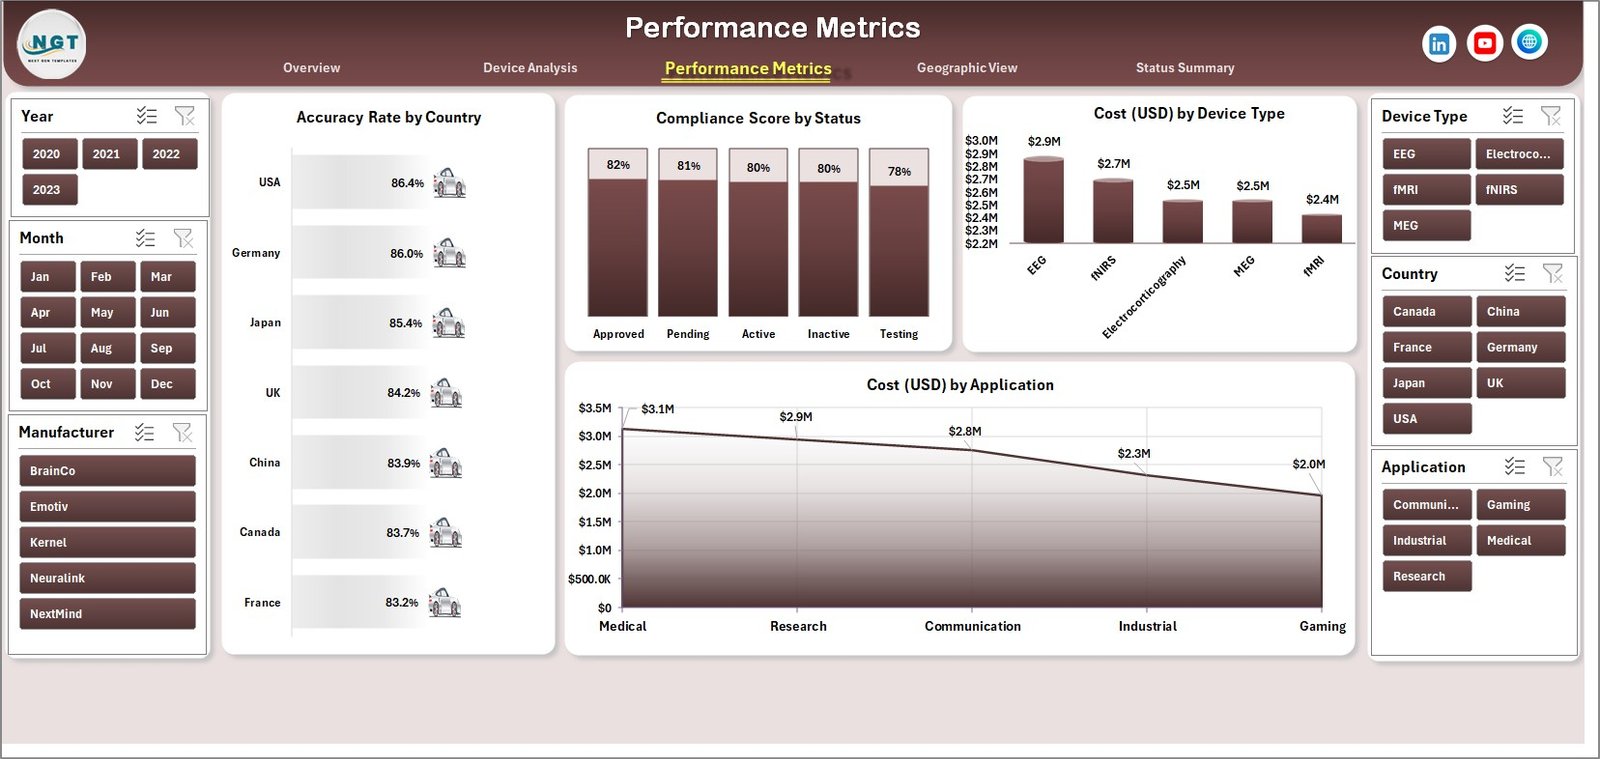
The Performance Metrics page focuses on evaluating system performance.
Metrics Covered:
- Accuracy Rate by Country
- Compliance Score by Status
- Cost by Device Type
- Cost by Application
👉 In addition, this page helps you track efficiency and reliability.
🔹 4. Geographic View – Global Analysis
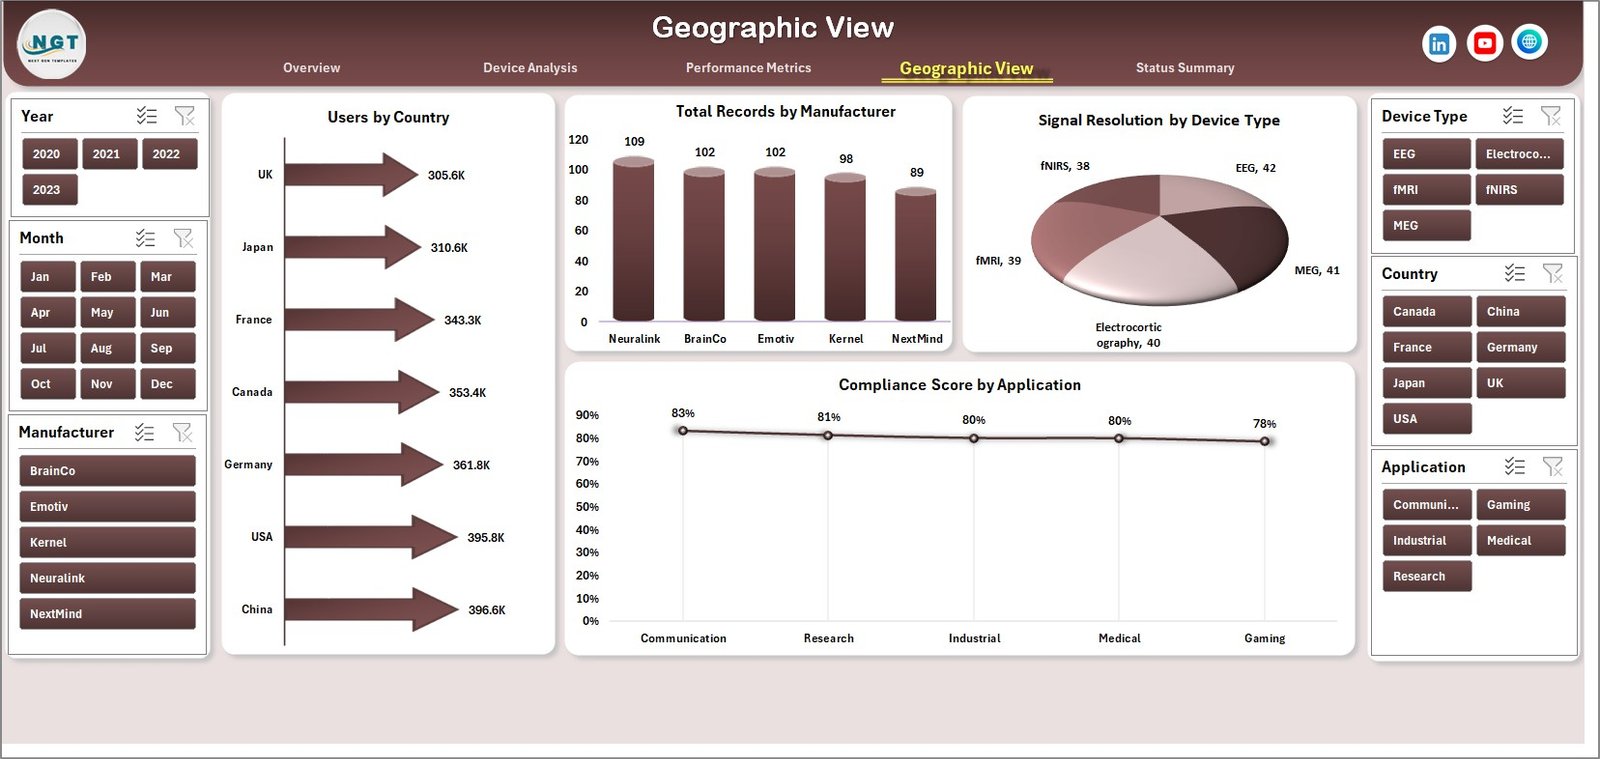
The Geographic View page provides insights based on regions and countries.
Key Charts:
- Users by Country
- Total Records by Manufacturer
- Signal Resolution by Device Type
- Compliance Score by Application
👉 Consequently, you can compare performance across different regions.
🔹 5. Status Summary – Operational Overview
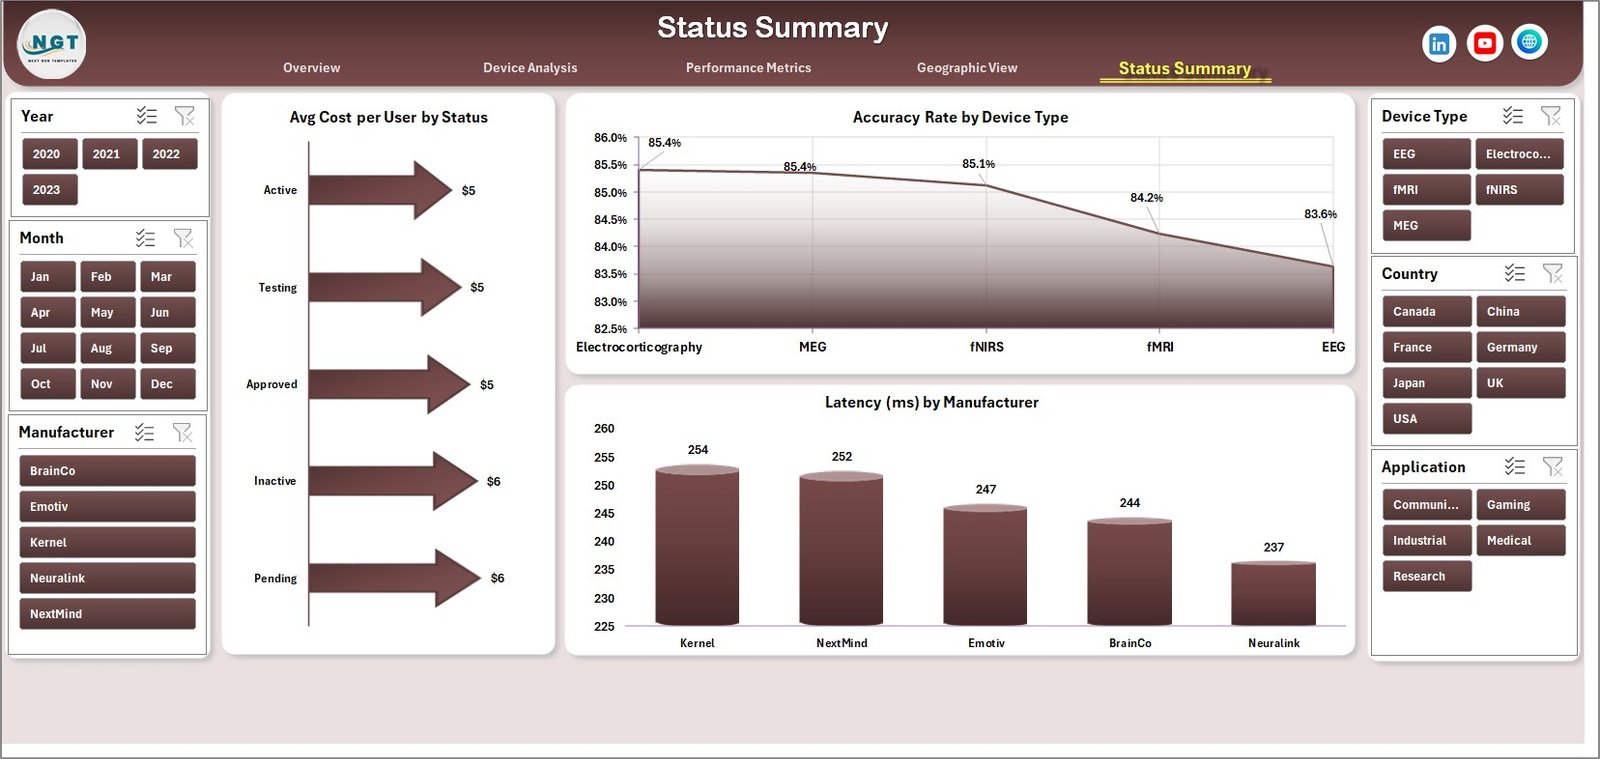
The Status Summary page highlights operational metrics and system status.
Key Metrics:
- Average Cost per User by Status
- Accuracy Rate by Device Type
- Latency by Manufacturer
👉 This page helps you monitor system health and identify issues quickly.
📂 Supporting Sheets
✅ Data Sheet:
- Stores raw data inputs
- Allows easy updates
- Supports dynamic dashboard functionality
✅ Support Sheet:
- Contains helper tables
- Manages dropdowns and slicers
- Ensures smooth calculations
🌟 Advantages of Brain-Computer Interfaces Dashboard in Excel
Click to Purchases Brain-Computer Interfaces Dashboard in Excel
Using this dashboard offers several benefits. Let’s explore them.
✅ 1. Centralized Data Management
You can store and manage all BCI data in one place. Therefore, you reduce confusion and duplication.
✅ 2. Real-Time Insights
The dashboard updates automatically when you refresh data. As a result, you always see the latest information.
✅ 3. Improved Decision-Making
Clear visuals help you understand trends quickly. Hence, you can make better decisions.
✅ 4. User-Friendly Interface
Even non-technical users can navigate the dashboard easily. Moreover, slicers simplify data filtering.
✅ 5. Performance Optimization
You can identify inefficiencies and improve system performance effectively.
✅ 6. Cost Analysis
You can track costs across devices, applications, and regions. Therefore, you can control expenses.
⚙️ How to Use the Brain-Computer Interfaces Dashboard in Excel?
Using this dashboard is simple and straightforward.
Step 1: Input Data
- Enter your data into the Data Sheet
- Ensure correct formatting
Step 2: Refresh the Dashboard
- Click “Refresh All” in Excel
- Update pivot tables and charts
Step 3: Use Slicers
- Filter data by device, country, or status
- Customize your analysis
Step 4: Analyze Insights
- Review charts and KPIs
- Identify trends and patterns
Step 5: Take Action
- Improve device performance
- Optimize costs
- Enhance user experience
📈 Use Cases of BCI Dashboard
This dashboard serves multiple industries and applications.
🏥 Healthcare
- Monitor patient-device interaction
- Track accuracy of brain signals
🎮 Gaming
- Analyze user engagement
- Improve device responsiveness
🧪 Research & Development
- Evaluate experimental results
- Track performance metrics
🤖 AI & Robotics
- Improve human-machine interaction
- Optimize system efficiency
🧠 Key Metrics You Should Track
Tracking the right KPIs ensures better outcomes.
📊 Important Metrics:
- Accuracy Rate
- Latency
- Signal Resolution
- Compliance Score
- Cost per User
- Total Users
👉 These metrics help you understand system effectiveness.
🛠️ Best Practices for the Brain-Computer Interfaces Dashboard in Excel
To get the most out of this dashboard, follow these best practices.
Click to Purchases Brain-Computer Interfaces Dashboard in Excel
✔️ Keep Data Clean
Ensure your data remains accurate and consistent. Otherwise, insights may become unreliable.
✔️ Update Data Regularly
Refresh your data frequently. As a result, your dashboard stays relevant.
✔️ Use Filters Smartly
Apply slicers to focus on specific insights. Therefore, you avoid unnecessary complexity.
✔️ Monitor KPIs Closely
Track important metrics regularly. Hence, you can identify issues early.
✔️ Customize When Needed
Modify charts and metrics based on your requirements. Moreover, this improves usability.
✔️ Train Your Team
Ensure your team understands how to use the dashboard. Consequently, productivity increases.
🔍 Opportunities for Improvement
Although this dashboard offers powerful features, you can enhance it further.
🚀 Add Automation
Integrate Power Query for automatic data updates.
📊 Include Forecasting
Use Excel forecasting tools to predict trends.
🔗 Connect with Power BI
For advanced analytics, integrate with Power BI.
🤖 Add AI Insights
Use AI tools to generate smart recommendations.
🧾 Conclusion
The Brain-Computer Interfaces Dashboard in Excel provides a comprehensive solution for managing and analyzing BCI data efficiently.
It helps you:
- Centralize data
- Visualize insights
- Improve decision-making
- Optimize performance
Moreover, its interactive design ensures ease of use and flexibility. Therefore, whether you work in healthcare, research, or AI, this dashboard can significantly enhance your data analysis capabilities.
👉 If you want to turn complex BCI data into actionable insights, this dashboard is the perfect solution.
Click to Purchases Brain-Computer Interfaces Dashboard in Excel
❓ Frequently Asked Questions (FAQs)
1. What is a Brain-Computer Interfaces Dashboard?
A Brain-Computer Interfaces Dashboard is a tool that helps you track and analyze data related to BCI systems using charts and KPIs.
2. Who can use this dashboard?
Healthcare professionals, researchers, data analysts, and AI developers can use this dashboard effectively.
3. Do I need advanced Excel skills?
No, you do not need advanced skills. The dashboard is user-friendly and easy to use.
4. Can I customize the dashboard?
Yes, you can modify charts, KPIs, and layouts based on your requirements.
5. How often should I update the data?
You should update the data regularly, preferably daily or weekly.
6. Can I integrate this dashboard with other tools?
Yes, you can connect it with Power BI or other tools for advanced analytics.
7. What type of data can I use?
You can use data related to devices, users, performance metrics, costs, and geographic information.
Visit our YouTube channel to learn step-by-step video tutorials
Click to Purchases Brain-Computer Interfaces Dashboard in Excel