In today’s fast-growing digital economy, auction platforms have transformed how buyers and sellers connect. From online bidding marketplaces to enterprise auction systems, businesses generate massive amounts of data daily. Auction Tech Platforms Dashboard in Power BI However, when this data remains scattered across spreadsheets and systems, it becomes difficult to track performance and make smart decisions.
So, how can auction platforms monitor performance, increase revenue, and improve customer satisfaction in real time?
👉 The answer is the Auction Tech Platforms Dashboard in Power BI.
This powerful and interactive dashboard helps you analyze auction data, track KPIs, and gain actionable insights—all in one place. Moreover, it converts complex data into easy-to-understand visuals. Therefore, you can make faster and smarter business decisions.
In this detailed guide, you will learn everything about this dashboard, including features, benefits, best practices, and FAQs.
Click to Purchases Auction Tech Platforms Dashboard in Power BI
📊 What is an Auction Tech Platforms Dashboard in Power BI?
An Auction Tech Platforms Dashboard in Power BI is a dynamic reporting tool designed to monitor and analyze key metrics related to auction marketplaces.
Instead of manually reviewing reports, you can:
- 📈 Track Gross Merchandise Value (GMV) in real time
- 🎯 Monitor platform fee revenue and subscription income
- 📊 Analyze bidding behavior and listing performance
- 😊 Measure customer satisfaction across regions and platforms
As a result, businesses can improve decision-making, optimize operations, and increase profitability.
❓ Why Do Auction Platforms Need a Dashboard?
Auction platforms operate in a highly competitive environment. Therefore, tracking performance becomes essential.
Without a dashboard:
- Data remains scattered
- Decision-making becomes slow
- Revenue opportunities get missed
However, with a Power BI dashboard:
- You get real-time insights
- You can identify trends quickly
- You can improve user experience effectively
👉 In short, it helps you stay ahead of competitors.
🧩 Key Features of Auction Tech Platforms Dashboard in Power BI
This dashboard includes 5 powerful and interactive pages, each designed for specific analysis.
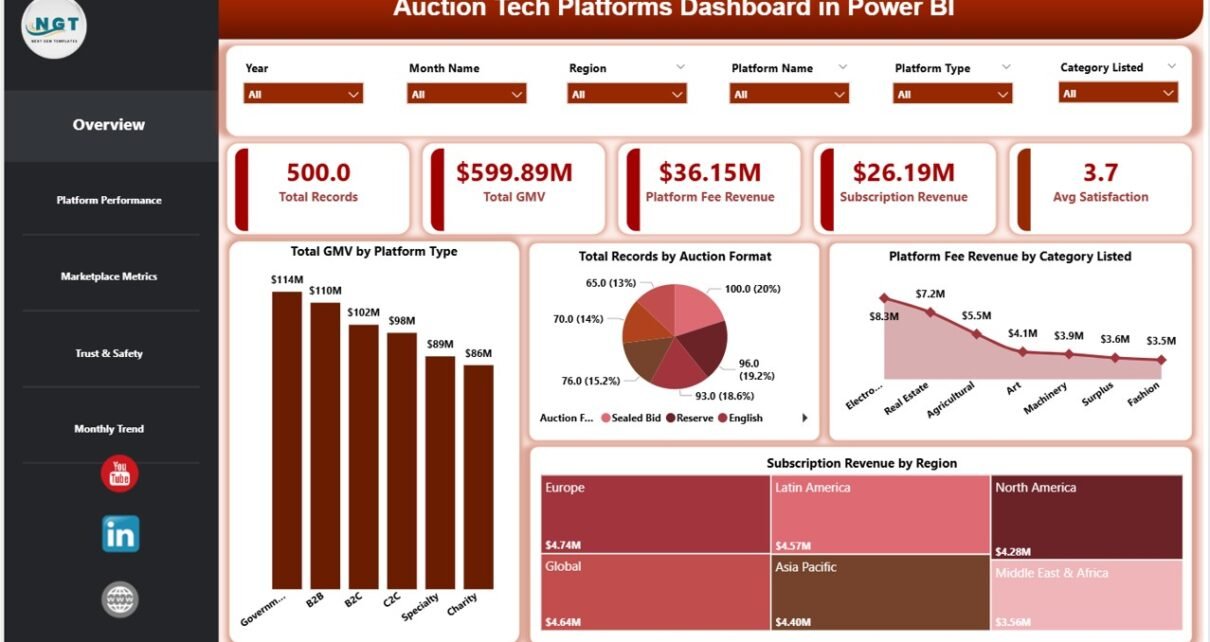
🏠 1. Overview Page – Get a Complete Business Snapshot
The Overview Page acts as the command center of the dashboard. Here, you can quickly understand overall performance.
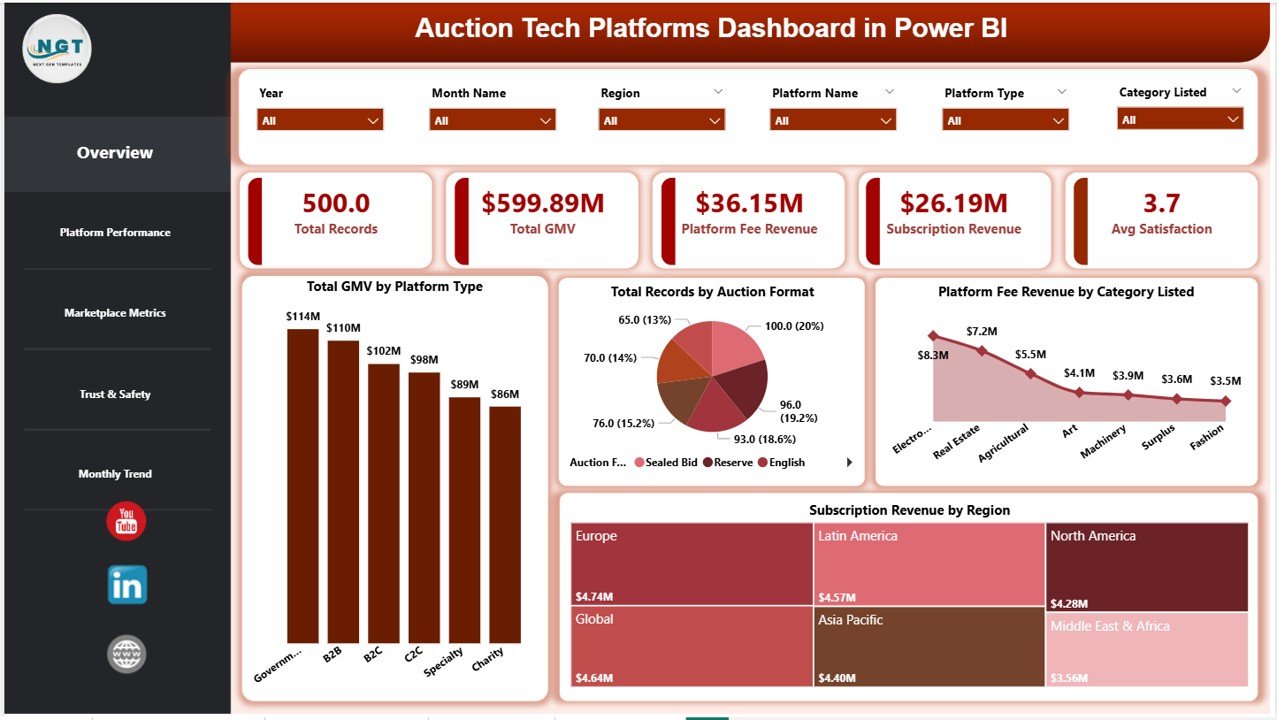
🔑 KPI Cards:
- Total Records
- Total GMV
- Platform Fee Revenue
- Subscription Revenue
- Average Satisfaction
📊 Charts Included:
- Total GMV by Platform Type
- Total Records by Auction Format
- Platform Fee Revenue by Category Listed
- Subscription Revenue by Region
👉 Therefore, you can instantly evaluate business health.
📊 2. Platform Performance – Analyze Platform-Level Insights
This page focuses on individual platform performance.
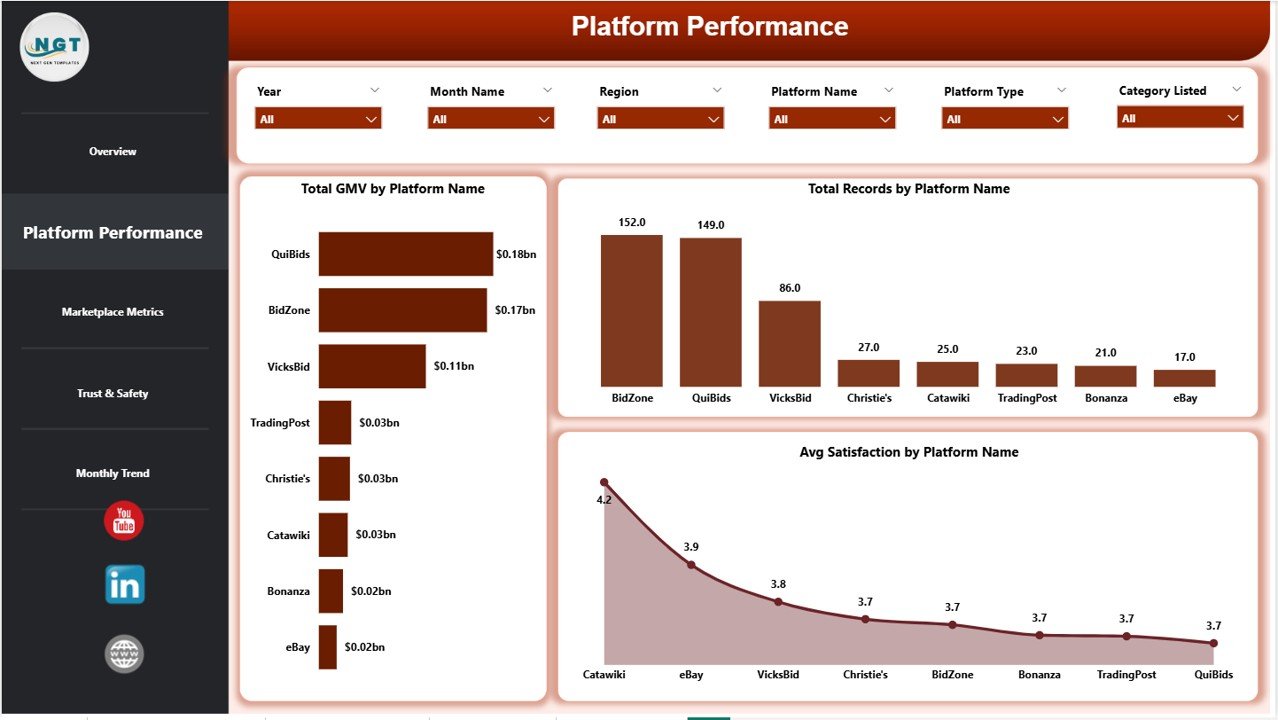
📈 Charts Included:
- Total GMV by Platform Name
- Total Records by Platform Name
- Average Satisfaction by Platform Name
👉 As a result, you can identify top-performing platforms and improve underperforming ones.
🛒 3. Marketplace Metrics – Understand Auction Activity
The Marketplace Metrics Page provides insights into listings and bidding activity.
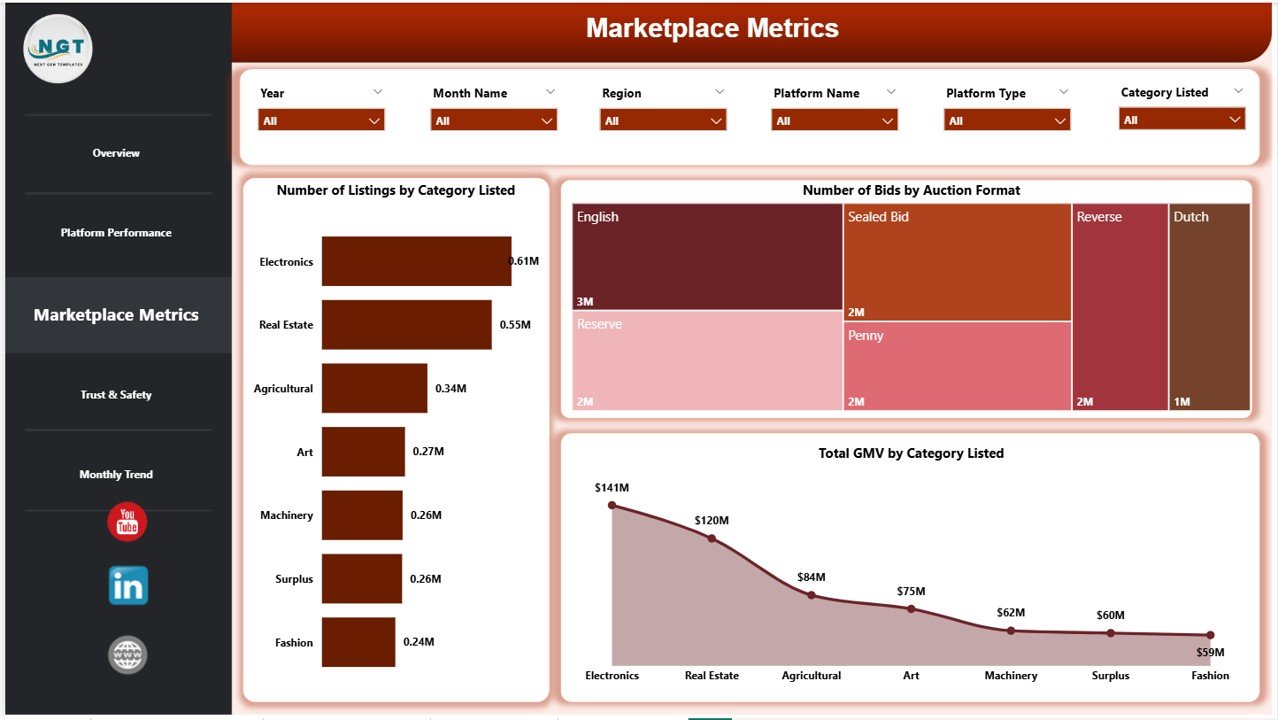
📊 Charts Included:
- Number of Listings by Category Listed
- Number of Bids by Auction Format
- Total GMV by Category Listed
👉 Therefore, you can optimize product categories and auction formats.
🔐 4. Trust & Safety – Monitor Platform Reliability
Trust plays a major role in auction platforms. Hence, this page focuses on reliability and customer satisfaction.
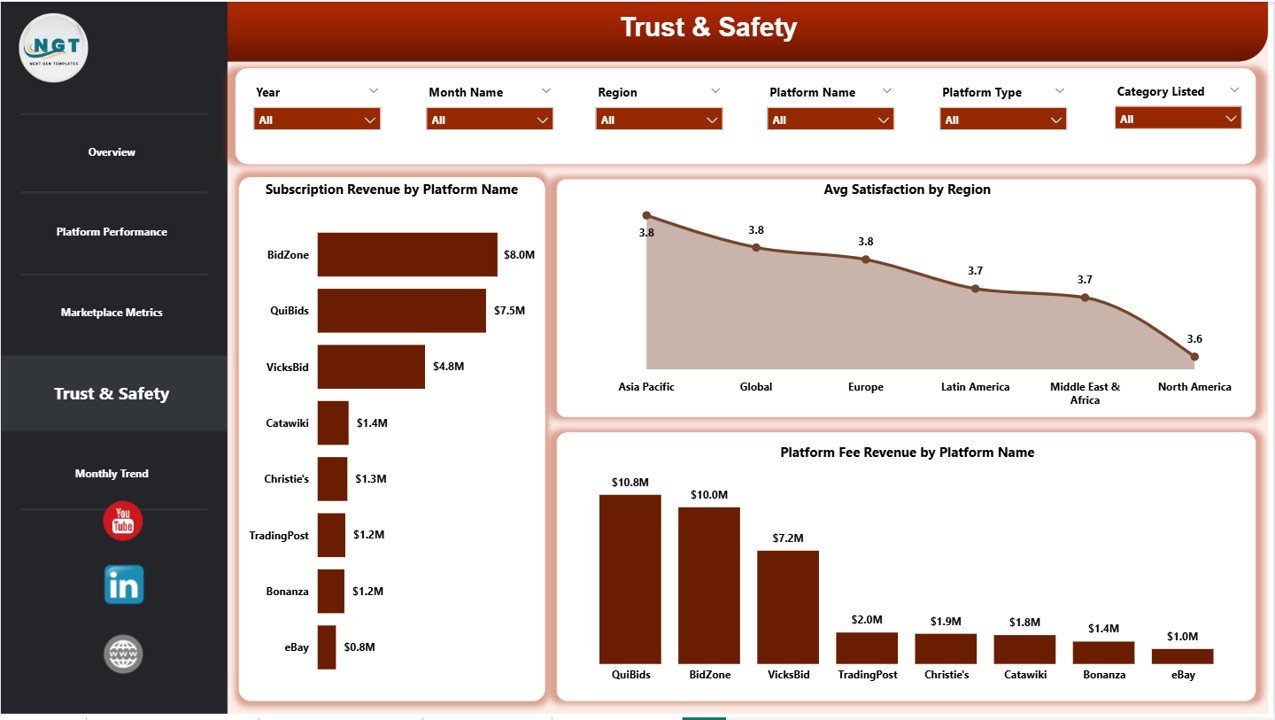
📊 Charts Included:
- Subscription Revenue by Platform Name
- Average Satisfaction by Region
- Platform Fee Revenue by Platform Name
👉 Consequently, you can improve customer trust and platform credibility.
📅 5. Monthly Trends – Track Performance Over Time
This page helps you analyze trends and patterns.
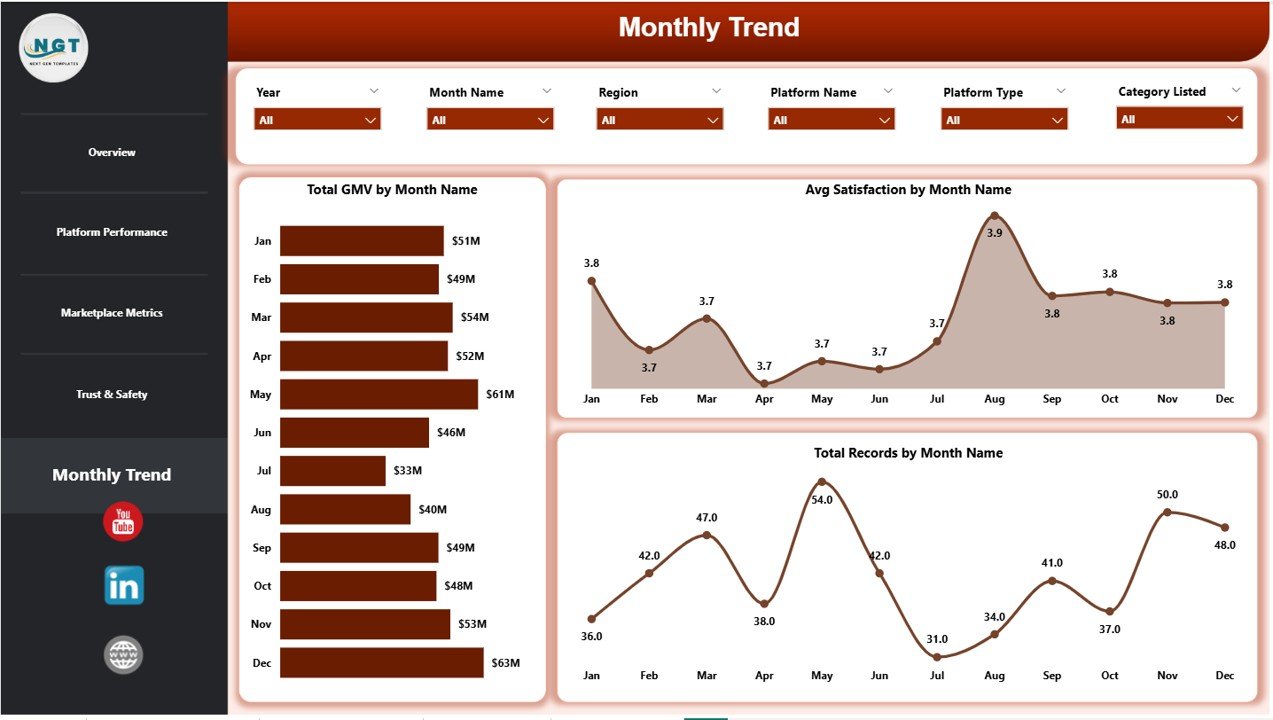
📈 Charts Included:
- Total GMV by Month Name
- Average Satisfaction by Month Name
- Total Records by Month Name
👉 Therefore, you can identify seasonal trends and plan strategies accordingly.
🌟 Advantages of Auction Tech Platforms Dashboard in Power BI
Using this dashboard offers multiple benefits. Let’s explore them:
✅ 1. Real-Time Insights
You can monitor performance instantly. Therefore, you can make quick decisions.
✅ 2. Improved Revenue Tracking
It helps you track GMV, subscription income, and platform fees efficiently.
✅ 3. Better Customer Understanding
You can analyze satisfaction scores and improve user experience.
✅ 4. Enhanced Decision-Making
Visual data makes it easier to identify trends and opportunities.
✅ 5. Centralized Data Management
All your data stays in one place, which improves efficiency.
✅ 6. Scalable for Growing Businesses
As your platform grows, the dashboard can handle more data easily.
Click to Purchases Auction Tech Platforms Dashboard in Power BI
🛠️ How to Use the Auction Tech Platforms Dashboard?
Using this dashboard is simple and effective.
Step-by-Step Process:
- Import Data into Power BI
Upload your auction data from Excel or databases. - Connect Data Sources
Ensure all relevant data points connect properly. - Use Slicers (Filters)
Select specific platforms, regions, or time periods. - Analyze KPI Cards
Check overall performance metrics. - Explore Detailed Pages
Dive deeper into platform performance and marketplace metrics. - Identify Trends
Use monthly trends to plan future strategies.
👉 As a result, you can turn raw data into actionable insights.
📈 Best Practices for the Auction Tech Platforms Dashboard
To get the most out of this dashboard, follow these best practices:
🔹 Keep Data Updated Regularly
Always refresh your data to ensure accuracy.
🔹 Use Clean and Structured Data
Organized data improves dashboard performance.
🔹 Focus on Key KPIs
Avoid unnecessary metrics. Instead, track what truly matters.
🔹 Customize Visuals
Adjust charts and filters based on your business needs.
🔹 Monitor Trends Frequently
Regular analysis helps you stay ahead of changes.
🔹 Train Your Team
Ensure your team understands how to use the dashboard effectively.
⚠️ Common Challenges and How to Overcome Them
Even though dashboards are powerful, users may face challenges.
🚫 Data Inconsistency
👉 Solution: Use standardized data formats
🚫 Overloaded Dashboard
👉 Solution: Focus only on key metrics
🚫 Slow Performance
👉 Solution: Optimize data models in Power BI
🚫 Lack of User Training
👉 Solution: Provide proper training sessions
🚀 How This Dashboard Helps Increase Revenue
This dashboard directly impacts business growth.
💰 Identify High-Performing Categories
You can focus on categories generating the highest GMV.
💡 Optimize Auction Formats
You can analyze which formats attract more bids.
📊 Improve Pricing Strategies
You can adjust platform fees and subscriptions.
😊 Enhance Customer Satisfaction
Happy users lead to repeat transactions.
👉 Therefore, your revenue grows consistently.
🔮 Future of Auction Analytics with Power BI
As technology evolves, auction platforms will rely more on analytics.
In the future:
- AI will predict bidding trends
- Automation will improve reporting
- Real-time dashboards will become standard
👉 Therefore, adopting Power BI dashboards today gives you a competitive advantage.
🏁 Conclusion
The Auction Tech Platforms Dashboard in Power BI is a game-changing tool for modern auction businesses. It helps you track performance, analyze trends, and improve decision-making—all in one place.
Moreover, it simplifies complex data into clear visuals. Therefore, you can focus on what truly matters—growing your business.
👉 If you want to stay competitive, improve efficiency, and boost revenue, this dashboard is a must-have solution.
❓ Frequently Asked Questions (FAQs)
1. What is GMV in auction platforms?
GMV (Gross Merchandise Value) represents the total value of goods sold through the platform.
2. Can I customize this dashboard?
Yes, you can easily customize visuals, KPIs, and filters based on your needs.
3. Is Power BI required to use this dashboard?
Yes, you need Power BI Desktop or Power BI Service to use and interact with the dashboard.
4. How often should I update the data?
You should update the data regularly—daily or weekly—for accurate insights.
5. Can small businesses use this dashboard?
Yes, this dashboard works for both small and large auction platforms.
6. Does this dashboard support real-time data?
Yes, Power BI allows real-time data integration if configured properly.
7. What industries can use this dashboard?
Any industry using auction platforms, including e-commerce, real estate, and automotive.
8. How does this dashboard improve customer satisfaction?
Click to Purchases Auction Tech Platforms Dashboard in Power BI
Visit our YouTube channel to learn step-by-step video tutorials