In today’s healthcare landscape, occupational therapy centers must track patient progress, therapy effectiveness, and operational efficiency. However, many clinics struggle to manage and analyze performance data effectively. As a result, they miss valuable insights that could improve patient care.
So, how can you track occupational therapy KPIs, compare performance against targets, and improve outcomes—all in one place?
Occupational Therapy KPI Dashboard in Power BI.
This powerful and interactive dashboard transforms complex healthcare data into clear, actionable insights. Moreover, it enables therapists and healthcare managers to monitor KPIs in real time. As a result, you can improve patient outcomes, optimize operations, and make smarter decisions.
What is an Occupational Therapy KPI Dashboard in Power BI?
An Occupational Therapy KPI Dashboard in Power BI is a data visualization tool desiged to monitor therapy performance metrics, targets, and patient outcomes.
Instead of manual reporting, this dashboard allows you to:
- 📊 Track KPI performance (MTD & YTD)
- 🎯 Compare actual vs target values
- 📈 Analyze trends over time
- 🔁 Compare current vs previous year performance
- 🧠 Understand KPI definitions and formulas
Why Do You Need This Dashboard?
Many occupational therapy providers collect data but fail to use it effectively.
However, with this dashboard:
- You monitor therapy performance easily
- You identify gaps in treatment
- You improve patient outcomes
- You enhance operational efficiency
Key Features of Occupational Therapy KPI Dashboard
Click to Buy Occupational Therapy KPI Dashboard in Power BI
This dashboard includes 3 structured pages, each designed for specific insights.
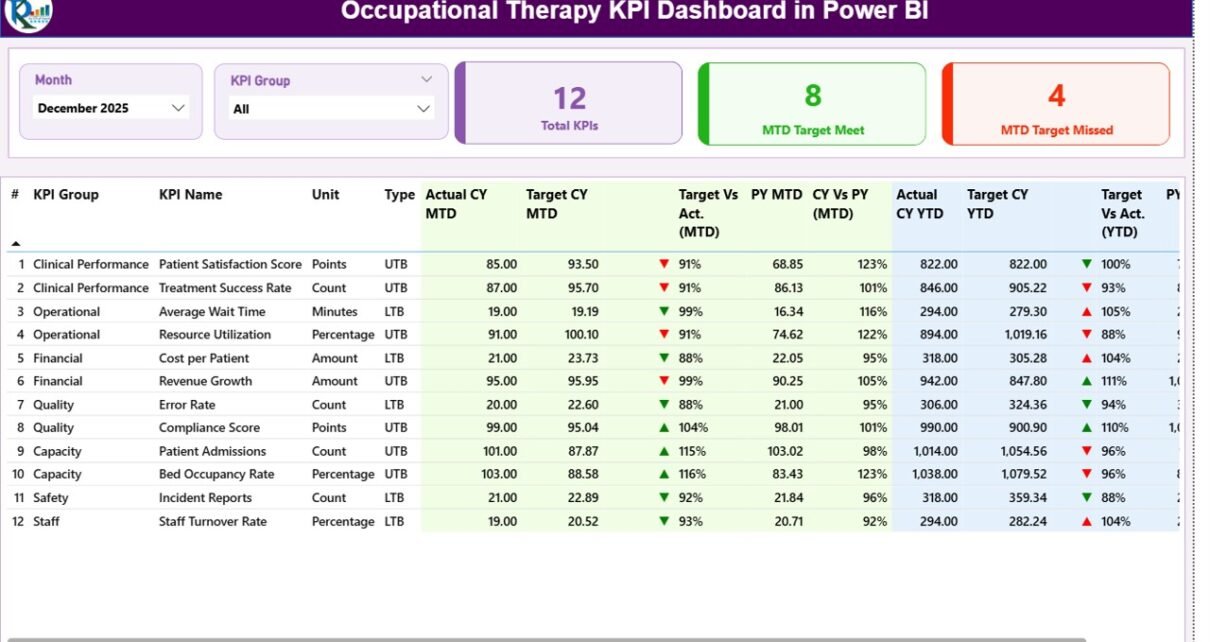
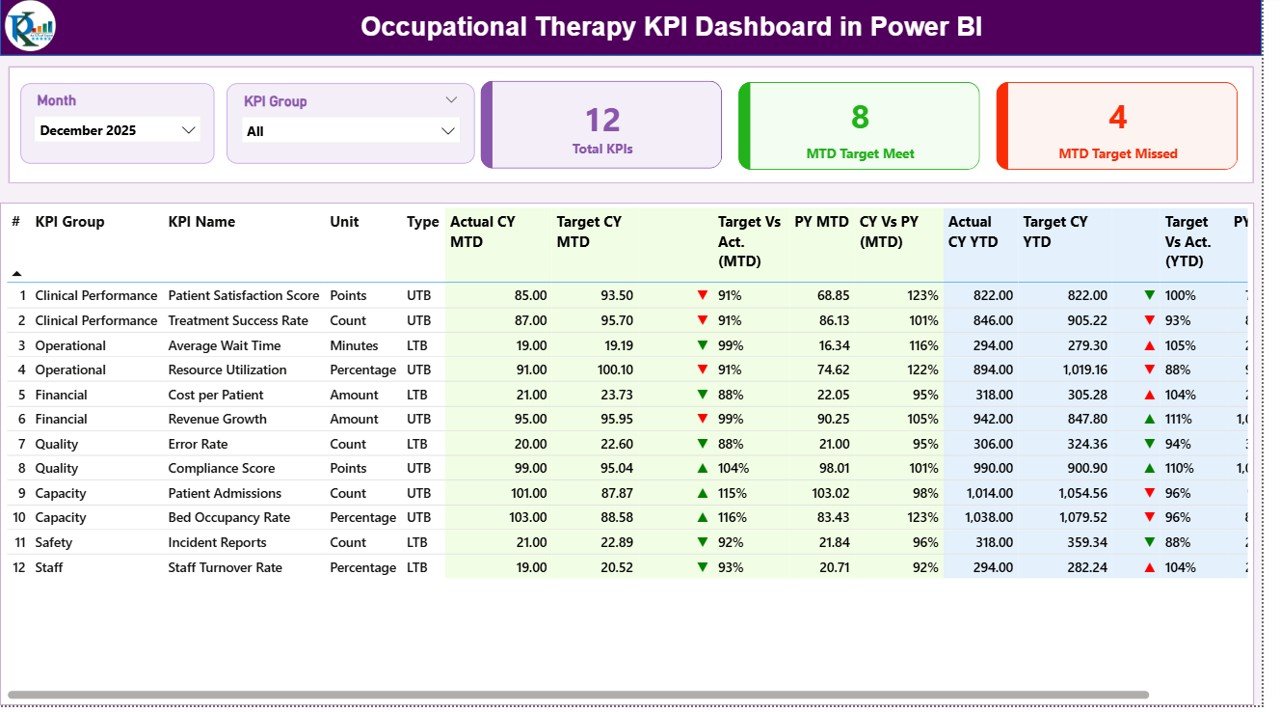
1. Summary Page – Complete KPI Overview
The Summary Page is the main dashboard where all KPI performance is displayed.
🔢 KPI Cards:
- 📊 Total KPIs Count
- ✅ MTD Target Meet Count
- ❌ MTD Target Missed Count
🎛️ Slicers:
- Month Selector
- KPI Group Selector
📋 Detailed KPI Table Includes:
- KPI Number
- KPI Group
- KPI Name
- Unit of Measurement
- KPI Type (LTB / UTB)
- Actual CY MTD
- Target CY MTD
- MTD Icon (▲ / ▼ with color indicators)
- Target vs Actual (MTD %)
- Previous Year MTD
- CY vs PY (MTD %)
- Actual CY YTD
- Target CY YTD
- YTD Icon (▲ / ▼ indicators)
- Target vs Actual (YTD %)
- Previous Year YTD
- CY vs PY (YTD %)
Click to Buy Occupational Therapy KPI Dashboard in Power BI
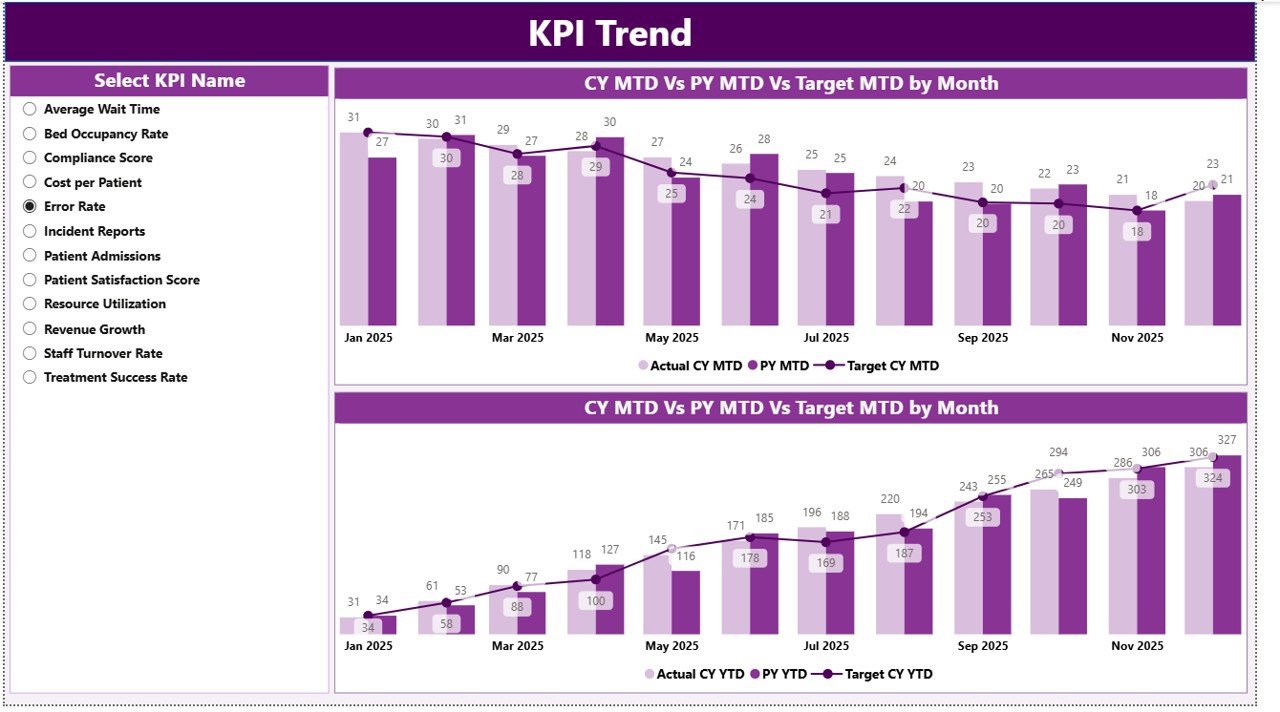
2. KPI Trend Page – Visual Performance Tracking
This page provides detailed trend analysis for selected KPIs.
Features:
- KPI Selection Slicer (Left Side)
- 📊 Two Combo Charts:
- MTD Trends (Actual vs Target vs Previous Year)
- YTD Trends (Actual vs Target vs Previous Year)
Click to Buy Occupational Therapy KPI Dashboard in Power BI
3. KPI Definition Page – Detailed KPI Understanding
This is a drill-through page that provides detailed KPI information.
Includes:
- KPI Formula
- KPI Definition
- KPI Type (LTB / UTB)

Click to Buy Occupational Therapy KPI Dashboard in Power BI
Excel Data Source Structure
This dashboard uses an Excel file as the data source, which includes 3 sheets:
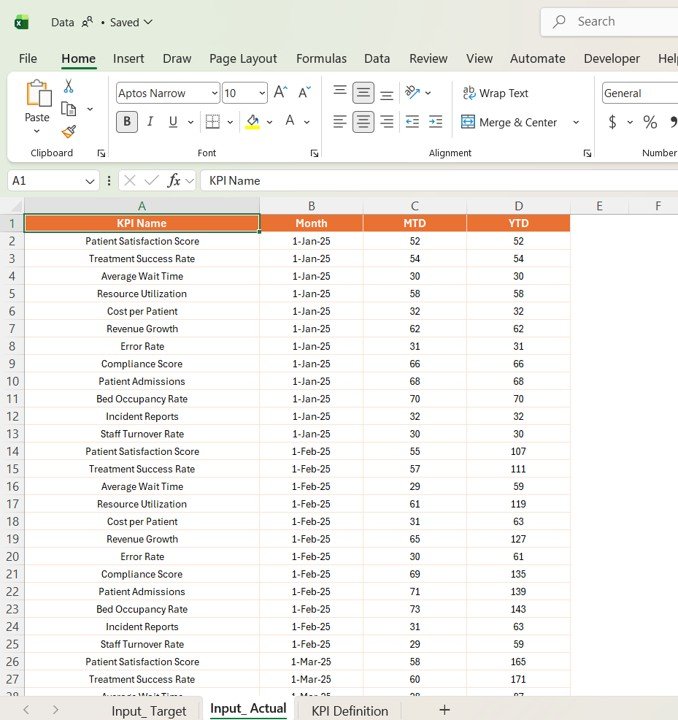
1. Input_Actual Sheet
- KPI Name
- Month (First date of the month)
- MTD Values
- YTD Values
Click to Buy Occupational Therapy KPI Dashboard in Power BI
2. Input_Target Sheet
- KPI Name
- Month
- MTD Targets
- YTD Targets

Click to Buy Occupational Therapy KPI Dashboard in Power BI
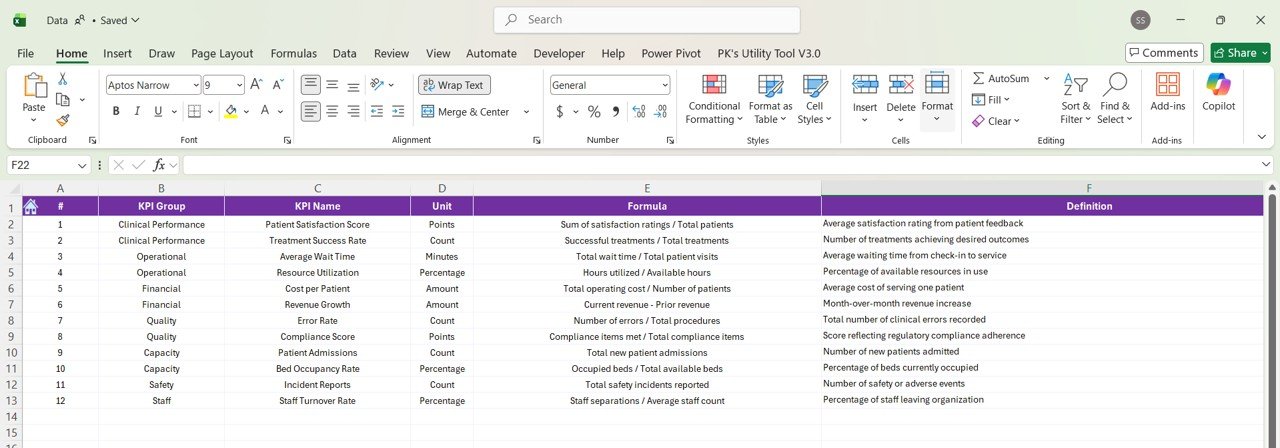
3. KPI Definition Sheet
- KPI Number
- KPI Group
- KPI Name
- Unit
- Formula
- Definition
- Type (LTB / UTB)
Click to Buy Occupational Therapy KPI Dashboard in Power BI
How Does This Dashboard Hel Healthcare Providers?
This dashboard converts raw data into meaningful insights.
Because:
- You track therapy performance metrics
- You compare actual vs target outcomes
- You improve treatment effectiveness
- You standardize KPI tracking
As a result, you enhance patient care and operational efficiency.
Advantages of Occupational Therapy KPI Dashboard
Using this dashboard provides several benefits:
🎯 Better KPI Tracking
- Monitor all KPIs in one place
- Improve visibility
📊 Data-Driven Decisions
- Use real-time insights
- Reduce guesswork
📈 Improved Patient Outcomes
- Track therapy progress
- Enhance treatment plans
⏱️ Time Saving
- Automated calculations
- Reduced manual effort
🧠 KPI Clarity
- Defined formulas and metrics
- Better understanding
How to Use the Occupational Therapy KPI Dashboard?
Click to Buy Occupational Therapy KPI Dashboard in Power BI
Using this dashboard is simple and efficient.
Step-by-Step Guide:
- Enter KPI definitions in Excel
- Input target values
- Enter actual data
- Refresh Power BI dashboard
- Use slicers to filter data
- Analyze KPIs and trends
Best Practices for the Occupational Therapy KPI Dashboard
To maximize results, follow these best practices:
📌 Maintain Data Accuracy
- Enter correct data
- Avoid missing values
📊 Focus on Key KPIs
- Track meaningful metrics
- Avoid unnecessary KPIs
🔄 Update Regularly
- Update monthly
- Monitor continuously
🎯 Use KPI Types Properly
- Understand LTB vs UTB
- Evaluate performance correctly
📈 Analyze Trends
- Monitor MTD & YTD
- Identify patterns early
Who Can Benefit from This Dashboard?
Click to Buy Occupational Therapy KPI Dashboard in Power BI
This dashboard is ideal for:
- 🏥 Occupational Therapy Clinics
- 👩⚕️ Therapists
- 📊 Healthcare Analysts
- 🏢 Hospital Management
- 💼 Healthcare Administrators
How Does It Improve Performance?
Click to Buy Occupational Therapy KPI Dashboard in Power BI
This dashboard directly improves outcomes.
Because:
- You track therapy success rates
- You identify performance gaps
- You optimize resources
- You improve patient satisfaction
Conclusion
The Occupational Therapy KPI Dashboard in Power BI is a powerful solution for tracking performance and improving patient outcomes.
Moreover, it simplifies complex KPI tracking into clear insights. As a result, healthcare providers can enhance efficiency, improve decision-making, and deliver better care.
Visit our YouTube channel to learn step-by-step video tutorials
Youtube.com/@NeotechNavigators
Click to Buy Occupational Therapy KPI Dashboard in Power BI