Introduction
Tracking performance metrics effectively is crucial for online universities aiming to improve their educational services and operational efficiency. In this article, we present the Online Universities KPI Dashboard, a comprehensive and ready-to-use Excel template designed to monitor and analyze key performance indicators (KPIs) specifically tailored for online education institutions.
Key Features of Online Universities KPI Dashboard
- Interactive and user-friendly interface with navigation buttons.
- Monthly and year-to-date (YTD) analysis with conditional formatting for easy interpretation.
- Seven detailed worksheet tabs, each serving a specific function.
- Dynamic trend visualization of KPIs to track progress over time.
- Input sheets for Actual, Target, and Previous Year values to maintain up-to-date reporting.
- Clear KPI definitions including formulas and performance types (Lower the Better / Upper the Better).
- Customizable drop-down menus for seamless navigation and data selection.
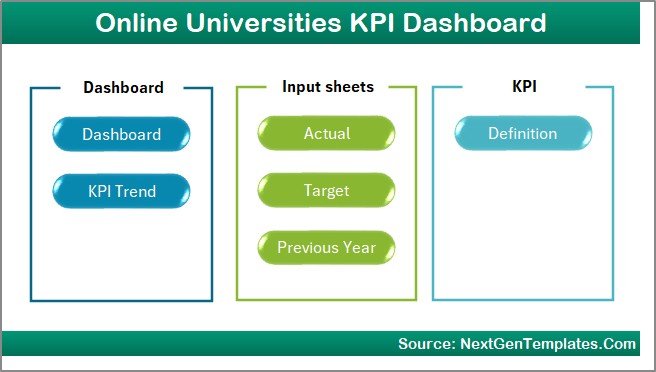
Dashboard Pages Explanation
1. Home Sheet
This index page is your dashboard’s central navigation hub. It contains six buttons allowing quick access to respective sections of the dashboard.
 Home Page
Click to Buy Online Universities KPI Dashboard in Excel
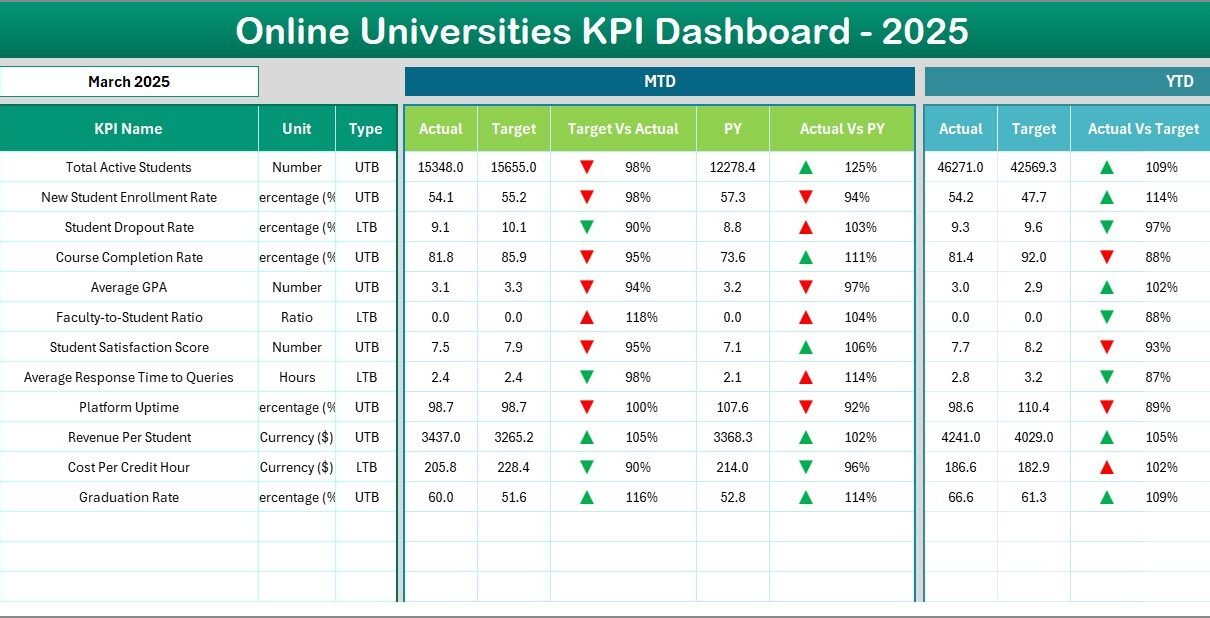
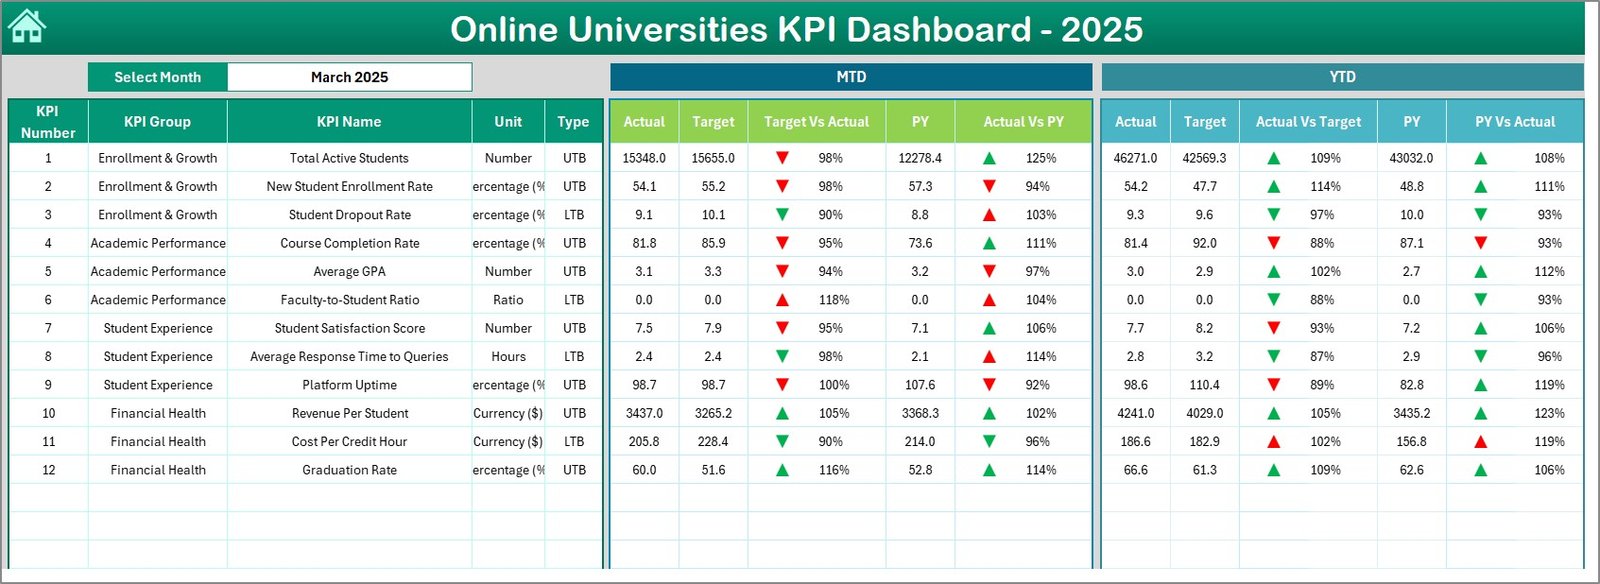
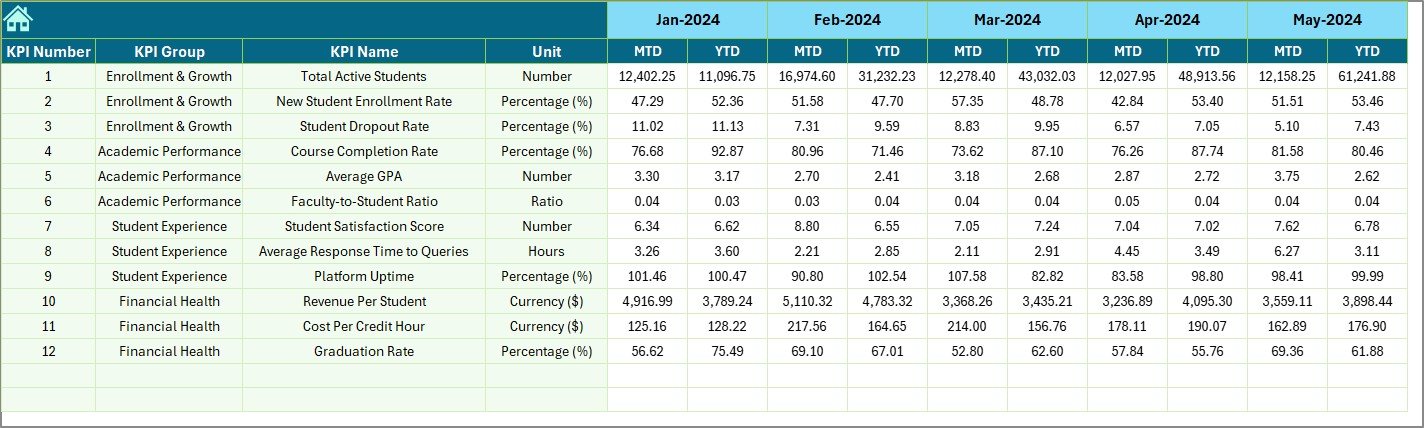
2. Dashboard Sheet
This is the core of the KPI dashboard showcasing vital metrics across all KPIs. Users can select the month via a drop-down menu in cell D3, instantly refreshing the data. It presents both Month-To-Date (MTD) and Year-To-Date (YTD) Actuals, Targets, and Previous Year figures.
- Comparisons using Target vs Actual and PY vs Actual with conditional formatting using up/down arrows.
- Clear visualization of performance trends for quick decision-making.
 Online Universities KPI Dashboard
Click to Buy Online Universities KPI Dashboard in Excel
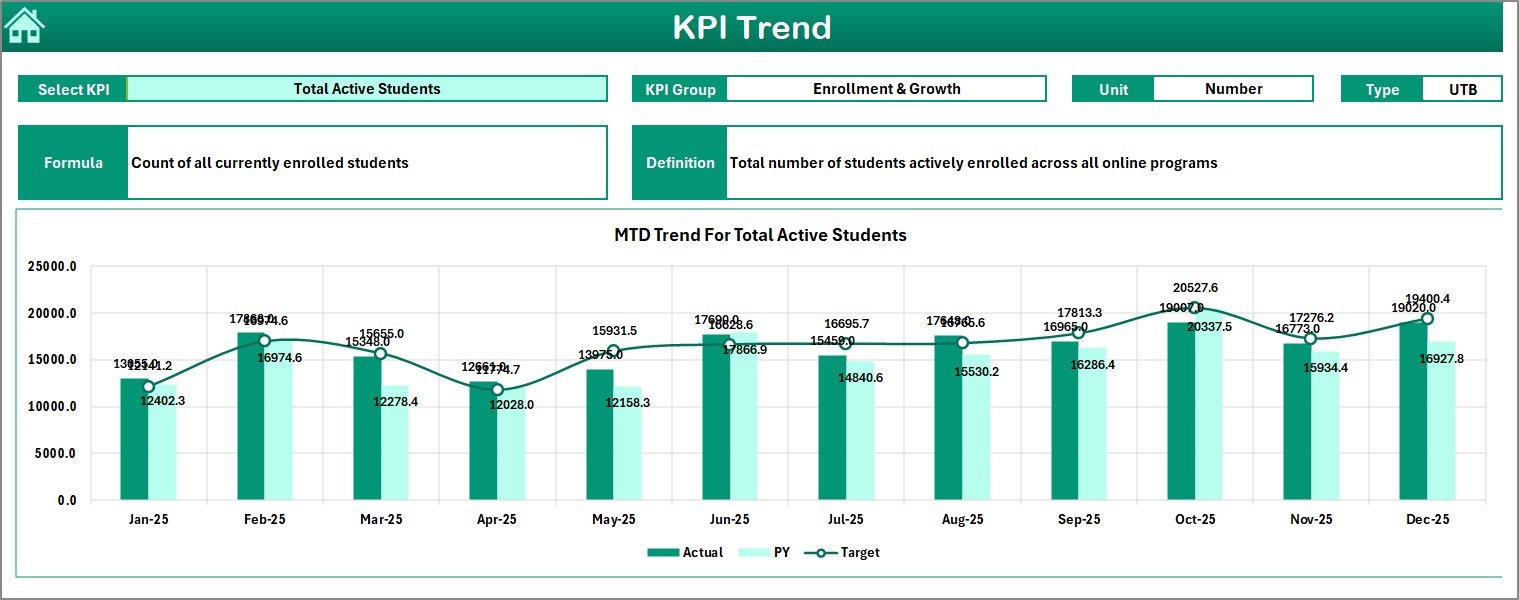
3. KPI Trend Sheet
This sheet allows you to pick any KPI from a drop-down located at cell C3. Detailed KPI information is provided, including:
- KPI Group
- Unit of measurement
- KPI Type (Lower the Better or Upper the Better)
- Formula and definition of the KPI
It also features trend charts for MTD and YTD displaying Actual, Target, and Previous Year values to visualize performance over time.
 KPI Trend Sheet
Click to Buy Online Universities KPI Dashboard in Excel
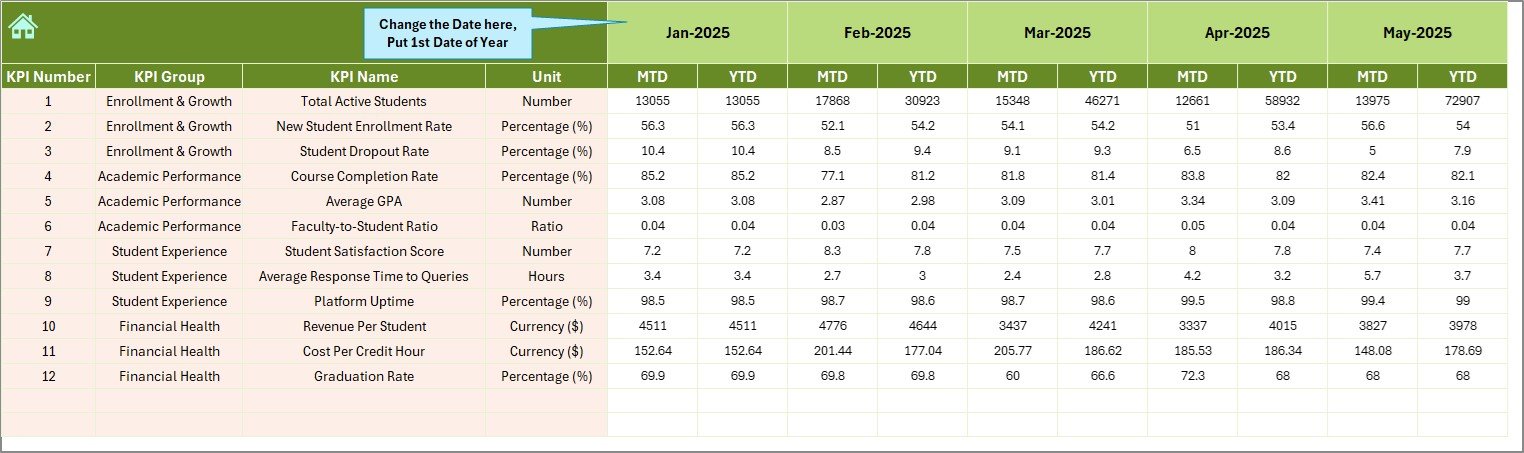
4. Actual Numbers Input Sheet
Input actual performance numbers here for the month and year you are tracking. You can specify the first month of the year in cell E1 to adjust the data range accordingly.
 Actual Numbers Input sheet
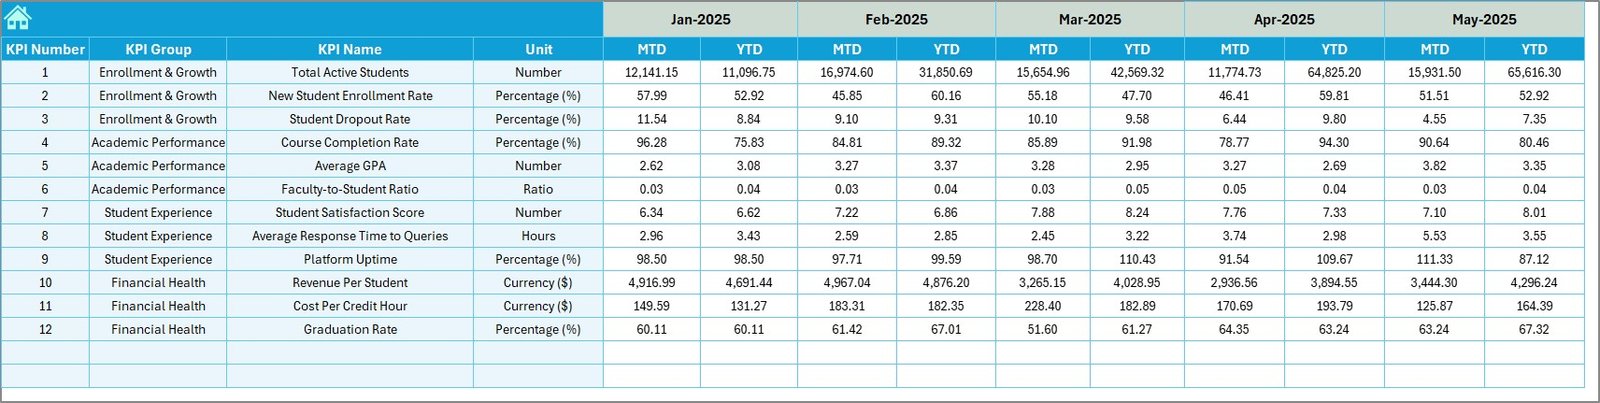
5. Target Number Input Sheet
Set the monthly targets for each KPI here. Both MTD and YTD target figures can be assigned, enabling robust goal tracking.
 Target Number Input sheet
Click to Buy Online Universities KPI Dashboard in Excel
6. Previous Year Number Input Sheet
Enter the previous year’s data similarly to compare with current year figures directly.
 Previous Year Number Input sheet
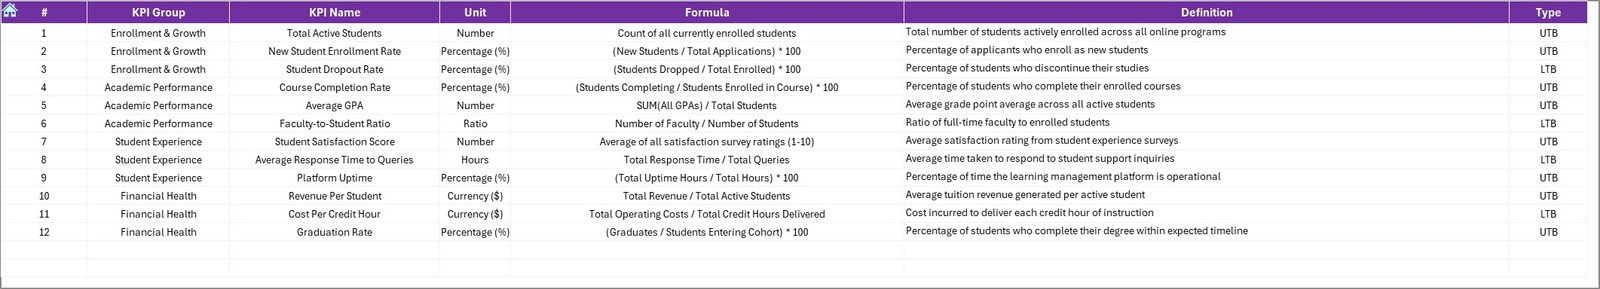
7. KPI Definition Sheet
This tab acts as the master reference for each KPI included in the dashboard. It requires you to fill in:
- KPI Name
- KPI Group
- Unit
- Formula
- Detailed KPI Definition
- KPI Type designation as LTB (Lower The Better) or UTB (Upper The Better)
 KPI Definition sheet
Click to Buy Online Universities KPI Dashboard in Excel
Advantages of Online Universities KPI Dashboard
- Efficient Performance Tracking: Provides instant insights into how online programs are performing on critical KPIs.
- Data-Driven Decisions: Facilitates decisions backed by real data on student engagement, course completion, enrollment, and more.
- Customizable and Scalable: Adaptable to various online education models and easily scalable as the institution grows.
- Enhanced Transparency: Enables administrators and stakeholders to view consistent and standardized performance measures.
- Time-Saving: Automated calculations and conditional formatting accelerate report preparation and review processes.
Opportunities for Improvement
Click to Buy Online Universities KPI Dashboard in Excel
- Integrate real-time data feeds from Learning Management Systems (LMS) for up-to-the-minute updates.
- Add predictive analytics capabilities to forecast enrollment trends and resource needs.
- Enable role-based dashboards for faculty, management, and students with relevant KPI views.
- Incorporate mobile-responsive design for ease of use on tablets and smartphones.
Best Practices
- Regularly update actual, target, and previous year data to maintain dashboard accuracy.
- Train staff and stakeholders on interpreting KPIs and using dashboard features.
- Customize KPIs as per organizational goals to keep the dashboard relevant.
- Set realistic monthly and yearly targets founded on historical trends and institutional goals.
- Leverage visual cues like conditional formatting for quick performance evaluation.
FAQs
Click to Buy Online Universities KPI Dashboard in Excel
Can I customize the KPIs in this dashboard?
Yes, the dashboard allows you to add new KPIs or modify existing ones by updating the KPI Definition sheet and ensuring data input sheets are aligned.
Does the dashboard support multiple academic years?
You can input data for different years through the Previous Year Number Input sheet, enabling year-over-year comparisons.
What Excel version is required?
The dashboard is compatible with Microsoft Excel 2016 and later versions that support drop-downs and conditional formatting.
Can I link this with other software?
While this template is standalone, you can export data or link via Excel Power Query for integration with advanced BI tools.
Conclusion
Click to Buy Online Universities KPI Dashboard in Excel
The Online Universities KPI Dashboard is a powerful tool designed to enhance visibility into crucial performance metrics for online educational institutions. Its intuitive layout, comprehensive data tracking, and visualization empower leadership to make informed decisions and continually improve educational outcomes. Start leveraging this dashboard today to elevate your institution’s operational excellence.
For more advanced tutorials and demos on KPI dashboards and Excel templates, visit the official Microsoft documentation here.
Visit our YouTube channel to watch the demo: Youtube.com/@NextGenTemplates
Click to Buy Online Universities KPI Dashboard in Excel