Board Game Startups Dashboard in Excel is a professionally designed, interactive analytics template built specifically for board game entrepreneurs, tabletop gaming startups, indie game studios, crowdfunding campaign managers, and entertainment business analysts. If you are looking for the best way to monitor revenue, costs, profit margins, customer ratings, and funding performance across your board game product portfolio, this ready-to-use Excel dashboard brings everything together into one powerful, pivot-driven analytics hub.
Board game startups operate in a dynamic industry where understanding your financial performance, game category trends, distribution channel effectiveness, and funding source ROI can mean the difference between scaling successfully and running out of runway. This dashboard eliminates the guesswork by consolidating your critical business data into five visually rich, filterable pages — each designed to answer specific strategic questions about your board game business.
Click here to Purchase Board Game Startups Dashboard in Excel
Key Features of Board Game Startups Dashboard in Excel
This Board Game Startups Dashboard in Excel delivers enterprise-grade analytics capabilities in a familiar spreadsheet environment. Here are the standout features that make this template essential for any board game business:
- Comprehensive KPI Card Layout — Monitor Total Records, Total Cost, Total Revenue, Net Profit, and Avg. Customer Rating from dynamic cards on the overview page for an instant snapshot of business health.
- Five Dedicated Analysis Pages — Explore Overview, Category Analysis, Funding Insights, Regional Performance, and Monthly Trends for a 360-degree view of your board game startup operations.
- Interactive Slicers and Filters — Instantly filter data by game category, funding stage, distribution channel, city, country, status, and more for precise drill-down analysis.
- Pivot-Powered Automation — Every chart and KPI card is driven by pivot tables in the Support sheet, so the entire dashboard updates automatically when you click Refresh All.
- No VBA or Macros Required — Built entirely on native Excel formulas, pivot tables, and conditional formatting for maximum compatibility.
- Structured Data Entry — A clean, organized Data sheet makes entering your board game startup records straightforward and error-free.
- Professional Visual Design — Clean chart layouts with consistent color coding make this dashboard presentation-ready for investors and stakeholders.
Dashboard Pages Explained
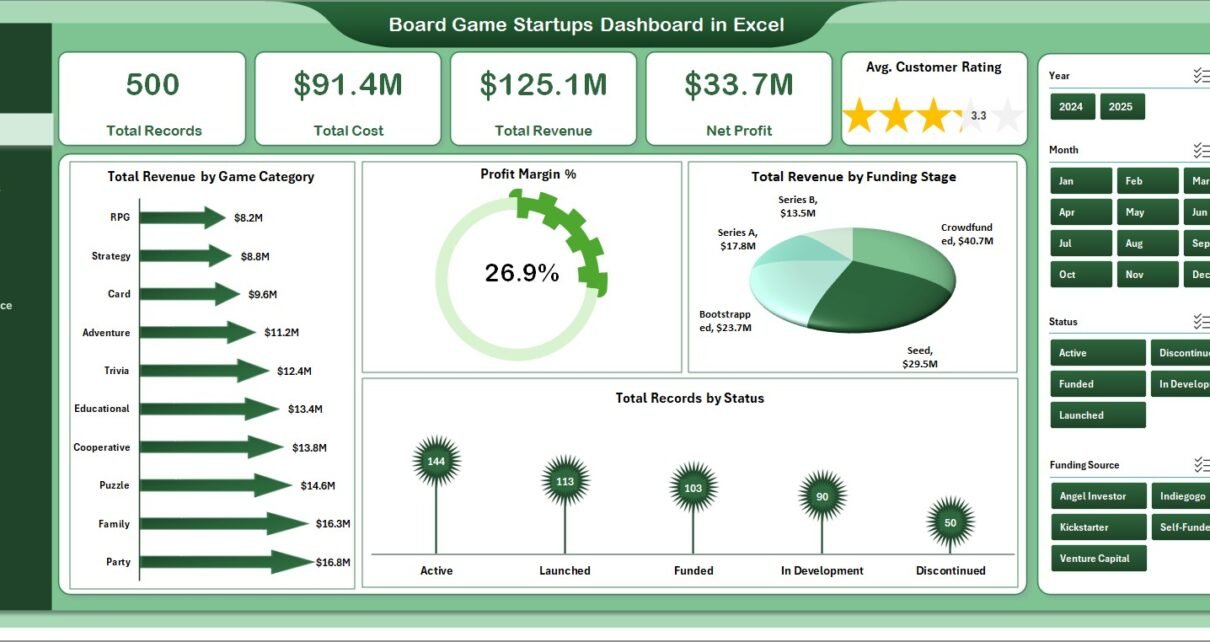
1 — Overview Page
The Overview Page is the command center of this Board Game Startups Dashboard in Excel. At the top, you will find high-level KPI cards displaying Total Records, Total Cost, Total Revenue, Net Profit, and Avg. Customer Rating. These cards give decision-makers an instant pulse on overall business performance without needing to dig into individual data points.
Below the KPI cards, several interactive charts provide deeper analytical context. Total Revenue by Game Category reveals which game types generate the most income. Profit Margin % gives a quick profitability assessment. Total Revenue by Funding Stage helps evaluate how different stages of investment correlate with revenue generation. Total Records by Status shows the operational distribution of your board game portfolio. Multiple slicers allow you to filter the entire page dynamically for quick targeted analysis.
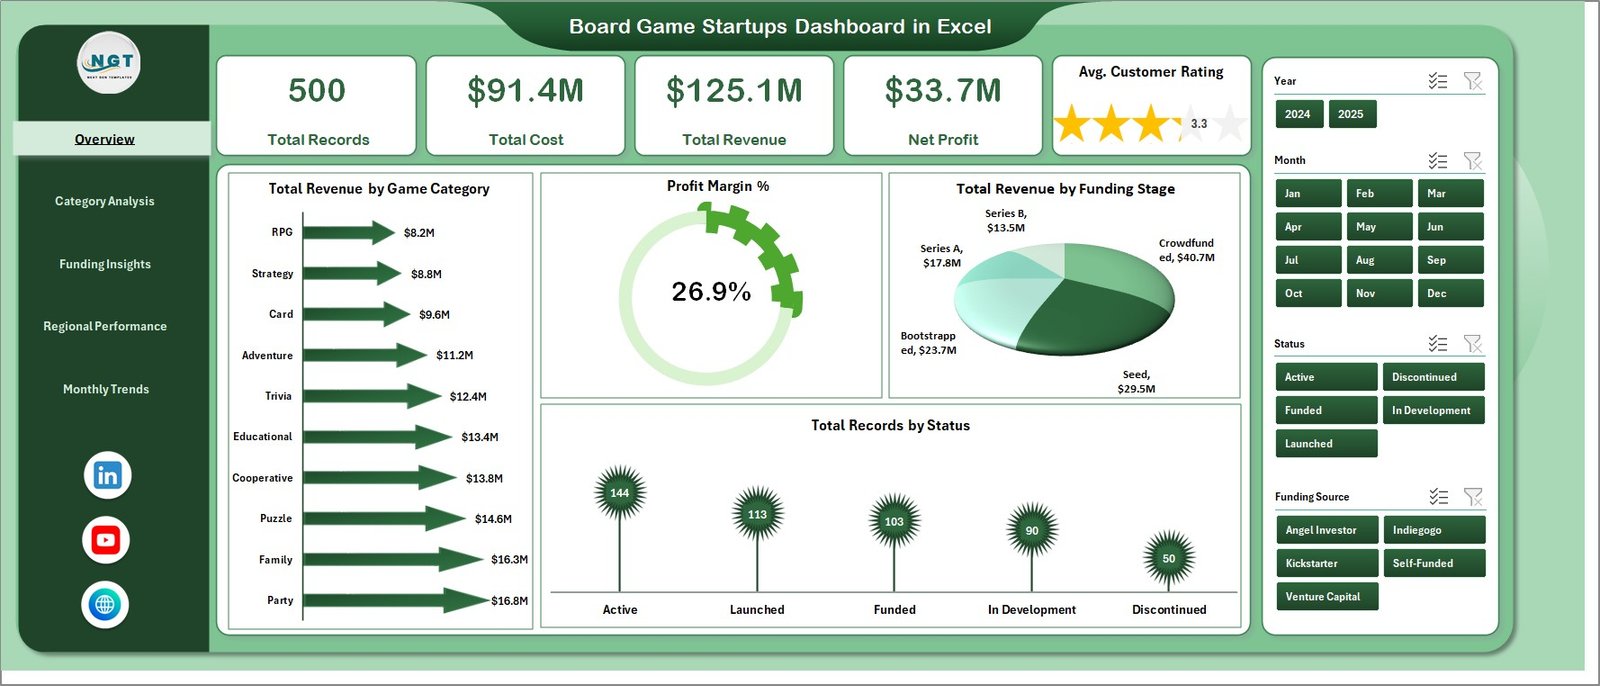
Board Game Startups Dashboard in Excel
2 — Category Analysis
The Category Analysis page dives deep into the performance of different board game categories and distribution channels. Total Units Sold by Game Category shows which game types are moving the most units, helping you understand market demand patterns. Total Revenue by Distribution Channel breaks down income sources across retail, online, and wholesale channels to identify where your strongest sales are coming from.
Profit Margin % by Distribution Channel highlights which channels deliver the healthiest margins, while Total Backers by Game Category connects crowdfunding supporter data with game type performance — a critical metric for startups relying on community-driven funding.
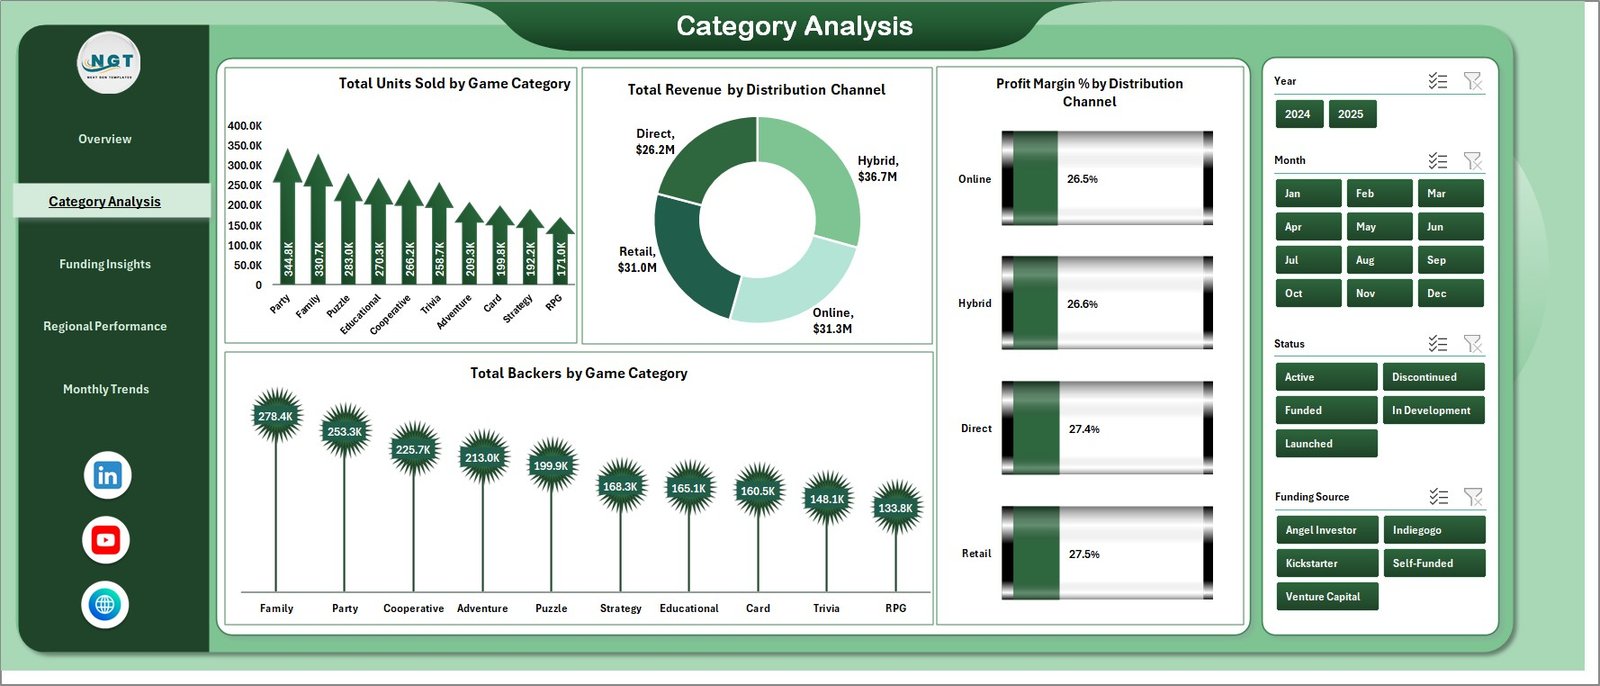
Category Analysis
3 — Funding Insights
The Funding Insights page is invaluable for board game startups navigating different funding landscapes. Total Marketing Spend by Funding Stage reveals how marketing budgets are distributed across seed, Series A, growth, and other stages. Avg. Customer Rating by Funding Source shows whether certain funding paths correlate with higher product quality or customer satisfaction.
Total Records by Funding Source provides a count breakdown by investor type, while Profit Margin % by Funding Stage helps founders and investors understand profitability across different maturity levels of the business.
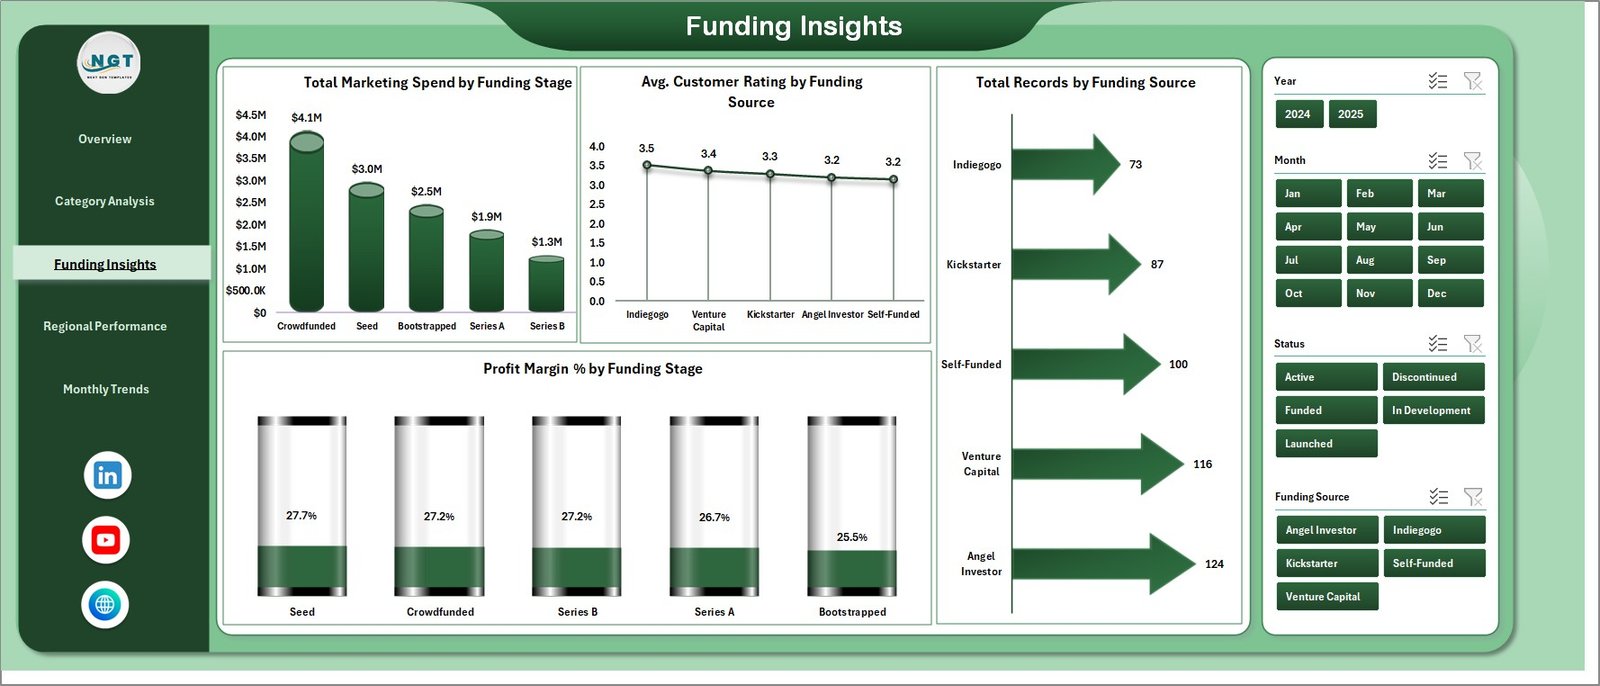
Funding Insights
4 — Regional Performance
The Regional Performance page gives geographic visibility into your board game startup operations. Total Revenue by Status breaks down income by operational status, while Total Revenue by Funding Source connects geographic revenue with investor types. Total Records by City pinpoints your most active markets at a city level, and Total Units Sold by Country provides a macro view of international market penetration.
This page is especially useful for startups expanding into new territories or evaluating which regional markets deserve more investment in distribution and marketing.
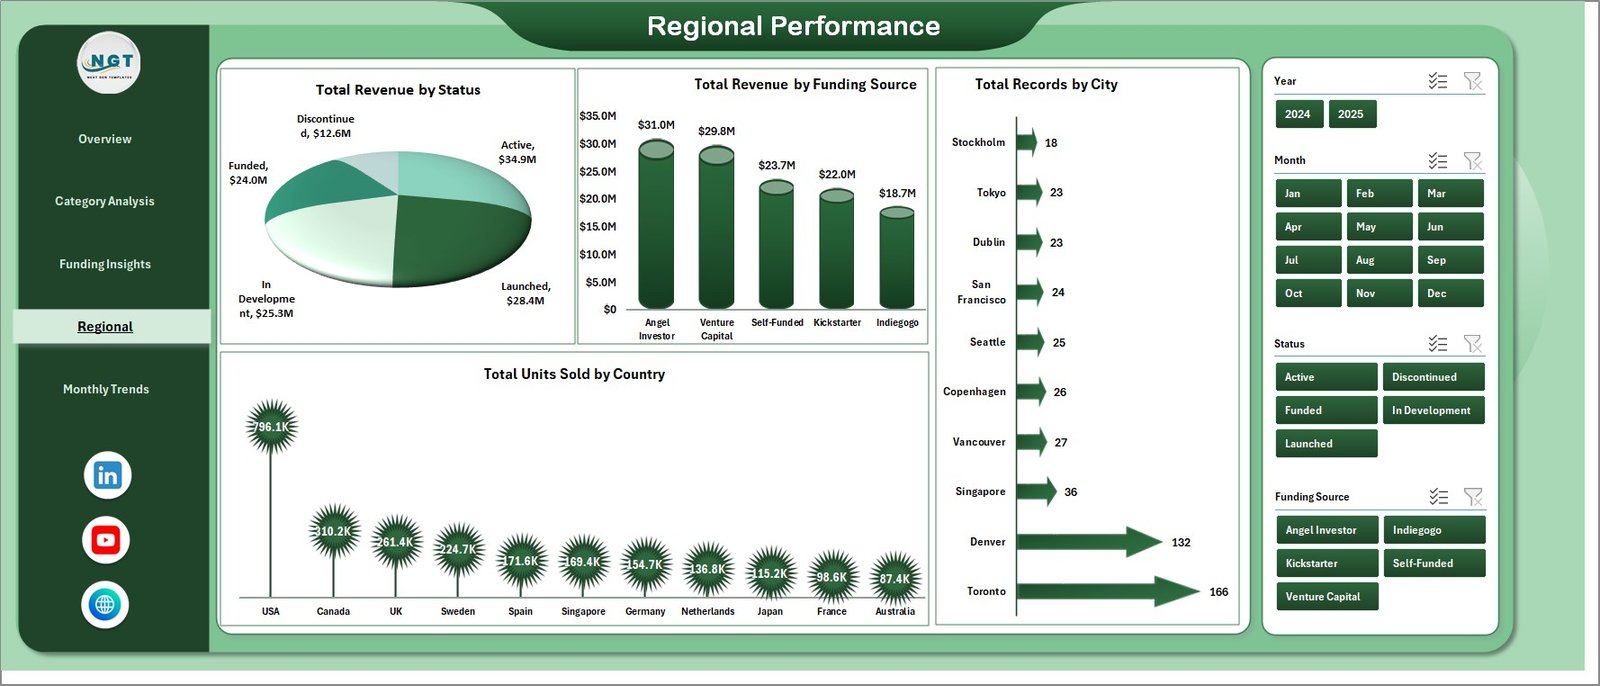
Regional Performance
5 — Monthly Trends
The Monthly Trends page provides time-based analysis that helps board game businesses identify seasonal patterns and growth trajectories. Total Revenue by Month tracks income fluctuations over the year, which is critical for board game companies that often see holiday season spikes. Profit Margin % by Month reveals whether profitability holds steady or fluctuates with volume changes, and Total Cost by Month helps operations teams anticipate cost surges during production-heavy months.
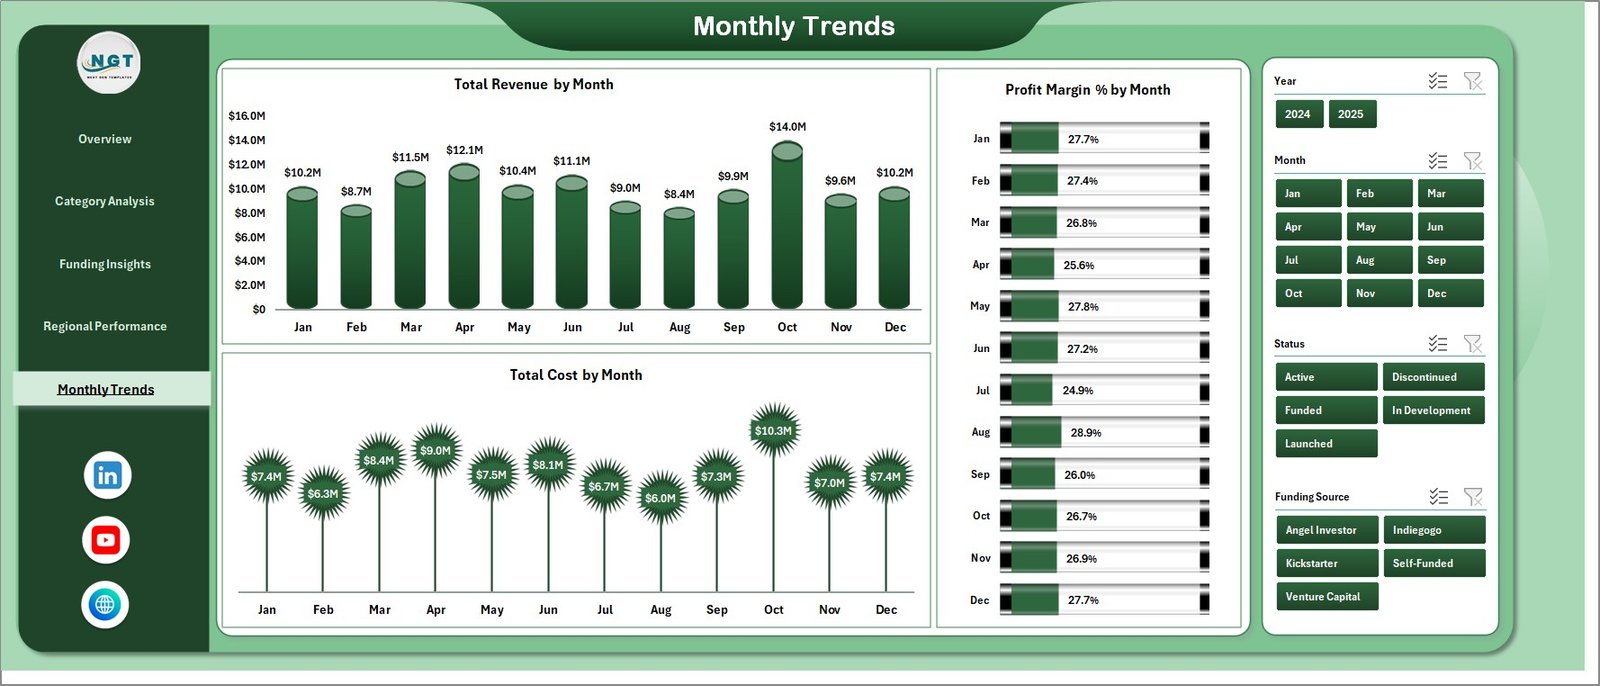
Monthly Trends
6 — Data Sheet
The Data Sheet is where all your board game startup operational records live. It uses a clean tabular format with structured columns for every metric the dashboard needs. Simply replace the sample data with your own records while maintaining the same column structure, and the entire dashboard will update when you refresh the pivots.
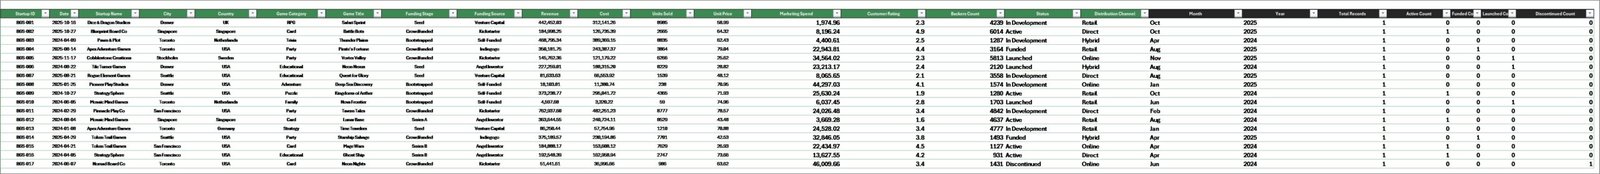
Data Sheet Tab
7 — Support Sheet
The Support Sheet contains all the pivot tables that power every chart and KPI card in the dashboard. After updating your data in the Data sheet, navigate to the Data tab in the Excel Ribbon and click Refresh All. All pivots will recalculate and every visual across all five dashboard pages will update automatically. You can keep this sheet hidden during presentations for a cleaner look.
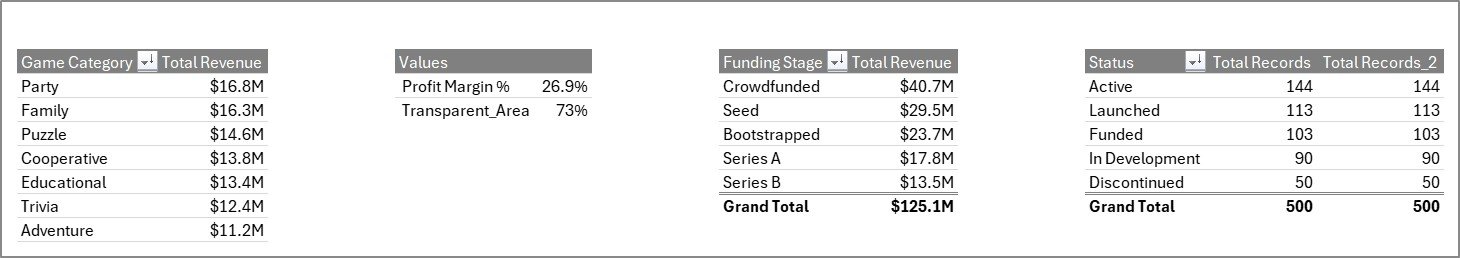
Support Sheet Tab
Advantages of Board Game Startups Dashboard in Excel
- Instant Business Visibility — Get a complete picture of your board game startup performance across revenue, costs, margins, ratings, and funding without switching between multiple tools.
- Data-Driven Decision Making — Replace gut feelings with visual analytics that clearly show which game categories, channels, regions, and funding sources are performing best.
- Investor-Ready Reporting — The professional chart layouts and KPI cards make this dashboard ideal for board meetings, investor updates, and pitch deck data appendices.
- Zero Learning Curve — If you know how to use Excel, you can use this dashboard. No coding, no BI software, no complex setup required.
- Cost-Effective Analytics — Get enterprise-grade dashboard capabilities without paying for expensive BI subscriptions or custom development.
Opportunities for Improvement
- Custom KPI Additions — You can extend the dashboard by adding new calculated metrics like Customer Acquisition Cost, Lifetime Value, or Return on Marketing Spend using additional pivot fields.
- Conditional Formatting Enhancements — Adding color-coded thresholds to the KPI cards would make it even easier to spot underperforming metrics at a glance.
- Additional Time Granularity — While monthly trends are covered, adding weekly or quarterly roll-up views could benefit startups with faster release cycles.
- Dashboard Page for Individual Games — A dedicated page where users can select a specific board game title and see all its metrics in one view would be a powerful addition for studios with large catalogs.
Best Practices for Using This Dashboard
- Update Data Regularly — For the most accurate insights, update your Data sheet weekly or monthly and always click Refresh All afterward.
- Use Slicers Strategically — Combine multiple slicer selections to compare specific game categories within specific funding stages or regions for hyper-targeted analysis.
- Keep the Support Sheet Hidden — During presentations and screen shares, hide the Support sheet to maintain a professional, clean appearance.
- Back Up Your File — Always keep a backup copy of your dashboard before making structural changes to the pivot tables or data layout.
- Leverage the Monthly Trends Page for Forecasting — Use historical monthly patterns to predict future revenue and cost trends for budgeting and fundraising planning.
Explore Relevant Templates
If you found the Board Game Startups Dashboard in Excel useful, check out these related templates on NextGenTemplates:
- Circular Economy Startups Dashboard in Excel — Track sustainability KPIs, waste diversion, recycling, and resource efficiency for startups.
- Circular Economy Startups Dashboard in Power BI — Power BI version with DAX-powered calculations and cloud publishing support.
- Border Security Tech Dashboard in Excel — Multi-page analytics dashboard with interactive charts and pivot-driven automation.
- Customer Satisfaction Dashboard in HTML — Browser-based interactive dashboard for tracking CSAT, NPS, and resolution metrics.
Frequently Asked Questions
What Excel version is required for this Board Game Startups Dashboard?
This dashboard works with Microsoft Excel 2016 and later versions including Excel 365. It uses native pivot tables, charts, and slicers which are supported across all modern Excel editions. You can learn more about Excel features on Microsoft Support.
Can I add my own custom game categories?
Yes, simply add new game categories in the Data sheet. When you refresh the pivots, the new categories will automatically appear in all relevant charts and slicers across the dashboard.
How many records can the dashboard handle?
The dashboard is optimized for up to 10,000 records but can handle more depending on your system performance. Excel pivot tables are efficient at processing large datasets without slowing down.
Can I use this dashboard for multiple board game companies?
Absolutely. You can add a company or brand column in the Data sheet and use slicers to filter by company, giving you a multi-brand dashboard from a single file.
Is VBA or macro knowledge required?
No, this dashboard does not use any VBA or macros. It runs entirely on native Excel pivot tables, formulas, and conditional formatting, making it accessible to users of all skill levels.
Can I customize the chart colors and styles?
Yes, all charts are standard Excel charts that can be fully customized. Right-click any chart element to change colors, fonts, labels, and chart types to match your brand identity.
Conclusion
The Board Game Startups Dashboard in Excel is a must-have analytics tool for anyone serious about building a data-driven board game business. With five interactive pages covering everything from high-level KPIs and game category analysis to funding insights, regional performance, and monthly trends, this dashboard gives you the clarity you need to make smarter decisions, impress investors, and scale your startup confidently.
Click here to Purchase Board Game Startups Dashboard in Excel
Visit our YouTube channel for step-by-step video tutorials: Youtube.com/@PK-AnExcelExpert