Boutique Hotels Dashboard in Power BI is a professionally designed, ready-to-use analytics template built for boutique hotel owners, resort managers, and hospitality professionals who want to visualize bookings, revenue, operating costs, guest satisfaction, and property performance — all inside one interactive Power BI file. If you have been looking for a smart way to transform your raw hotel booking data into meaningful insights, this Boutique Hotels Dashboard in Power BI is exactly what you need.
This dashboard uses interactive charts, dynamic slicers, and multiple analysis pages to give you a complete 360-degree view of your boutique hotel operations. Whether you manage a single property or multiple boutique locations, you can instantly filter, compare, and explore your data to make smarter business decisions.
Key Features of Boutique Hotels Dashboard in Power BI
This Power BI dashboard template is packed with features designed specifically for the hospitality industry. Here is what makes it stand out from generic dashboard solutions:
- 5 Interactive Dashboard Pages — Overview, Room Analysis, Guest Insights, Revenue Trends, and Property Performance pages cover every critical aspect of your hotel operations.
- Dynamic Slicers and Filters — Instantly filter data by guest type, room type, season, booking source, city, and more with a single click.
- Revenue and Profit Tracking — Monitor Total Revenue, Total Operating Cost, Net Profit, and Profit Margin across multiple dimensions.
- Guest Rating Analysis — Track average guest satisfaction ratings by room type to identify your highest-rated accommodations.
- Seasonal and Monthly Trends — Discover revenue and booking patterns across months and seasons for pricing optimization.
- City-Wise Property Comparison — Compare revenue, costs, and margins across different hotel locations.
- Booking Source Analysis — Understand which channels drive the most guests and highest margins.
- Easy Data Refresh — Update your data source and refresh in Power BI to see updated insights instantly.
Dashboard Pages Explanation
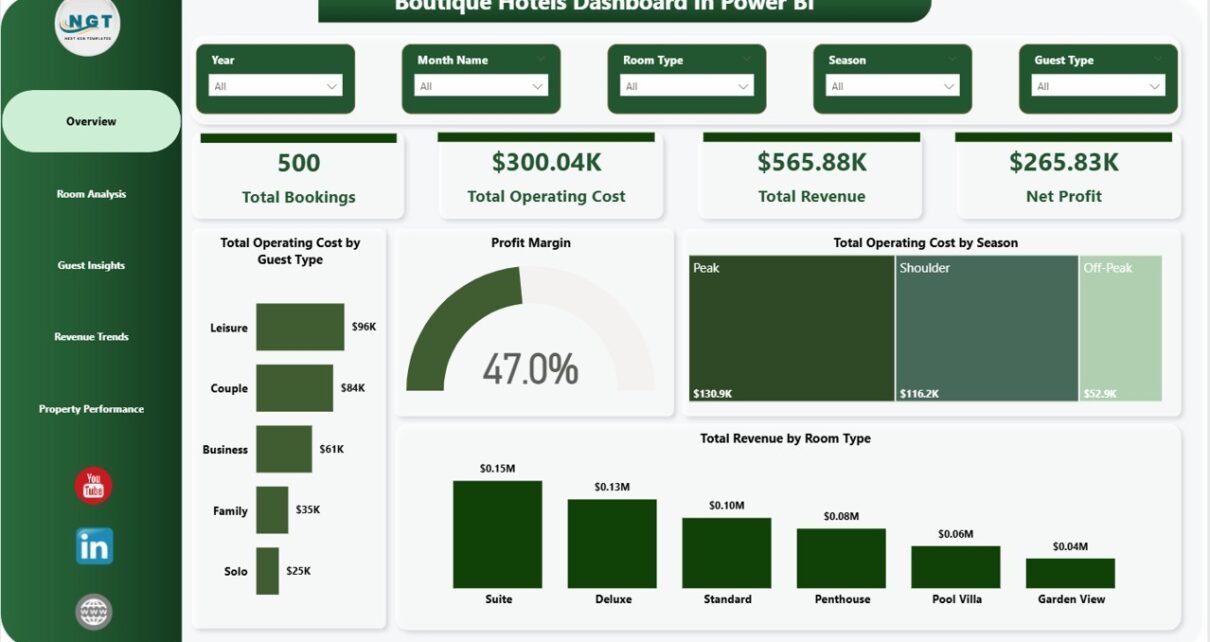
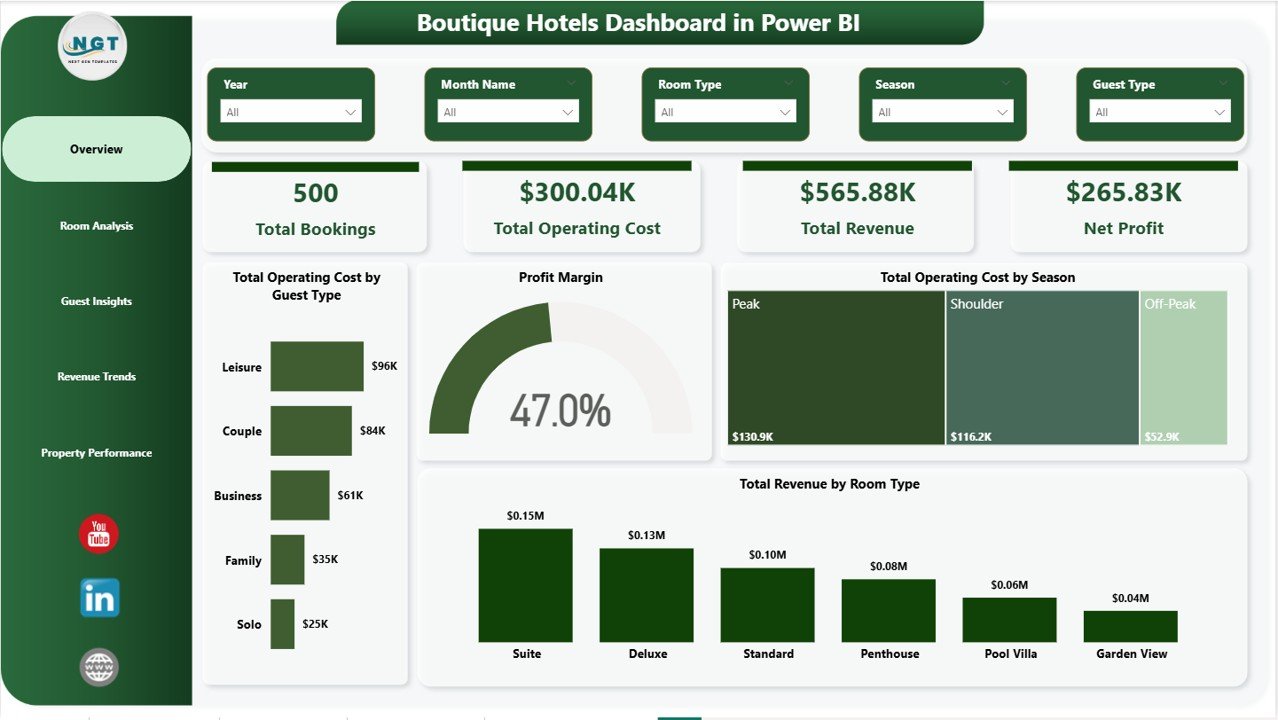
1 — Overview Page
The Overview Page serves as the central command center of this dashboard. At the top, high-level KPI cards display the most important metrics at a glance including Total Bookings, Total Operating Cost, Total Revenue, Net Profit, and Profit Margin. Below the cards, interactive charts provide deeper analysis with visualizations showing Total Operating Cost by Guest Type, Total Operating Cost by Season, and Total Revenue by Room Type. Multiple slicers on this page allow you to apply filters and see the filtered dashboard results instantly.
Boutique Hotels Dashboard in Power BI
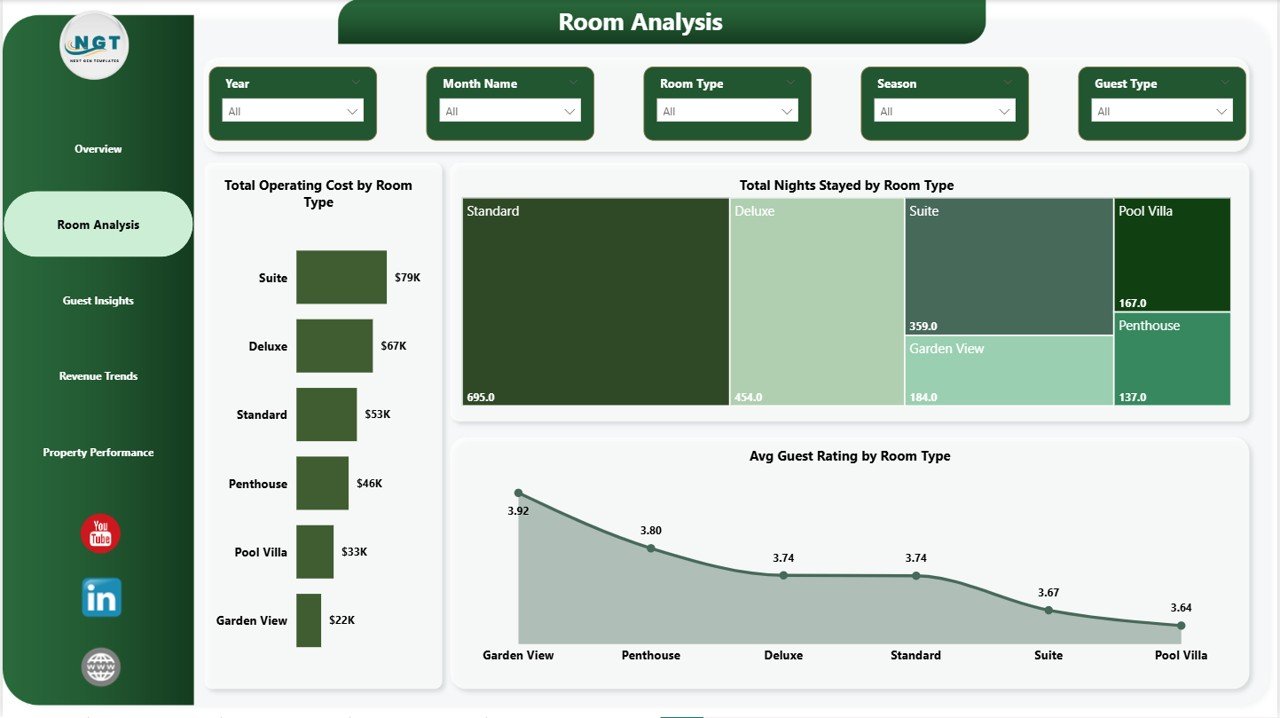
2 — Room Analysis
The Room Analysis page dives deep into room-level performance metrics. This page features charts analyzing Total Operating Cost by Room Type, which helps identify which room categories have the highest operational expenses. Total Nights Stayed by Room Type reveals which rooms are most popular among guests. The Avg Guest Rating by Room Type visualization highlights which room types deliver the best guest experience, enabling you to make targeted improvements where needed.
Room Analysis
3 — Guest Insights
The Guest Insights page focuses on understanding your guest segments and booking patterns. Charts on this page display Profit Margin by Guest Type, helping you understand which guest categories are most profitable. Total Nights Stayed by Guest Type reveals booking duration patterns across different guest segments. Total Bookings by Booking Source shows which reservation channels drive the most traffic, enabling smarter marketing allocation. You can find similar guest-level insights in the Hospitality Dashboard in HTML.
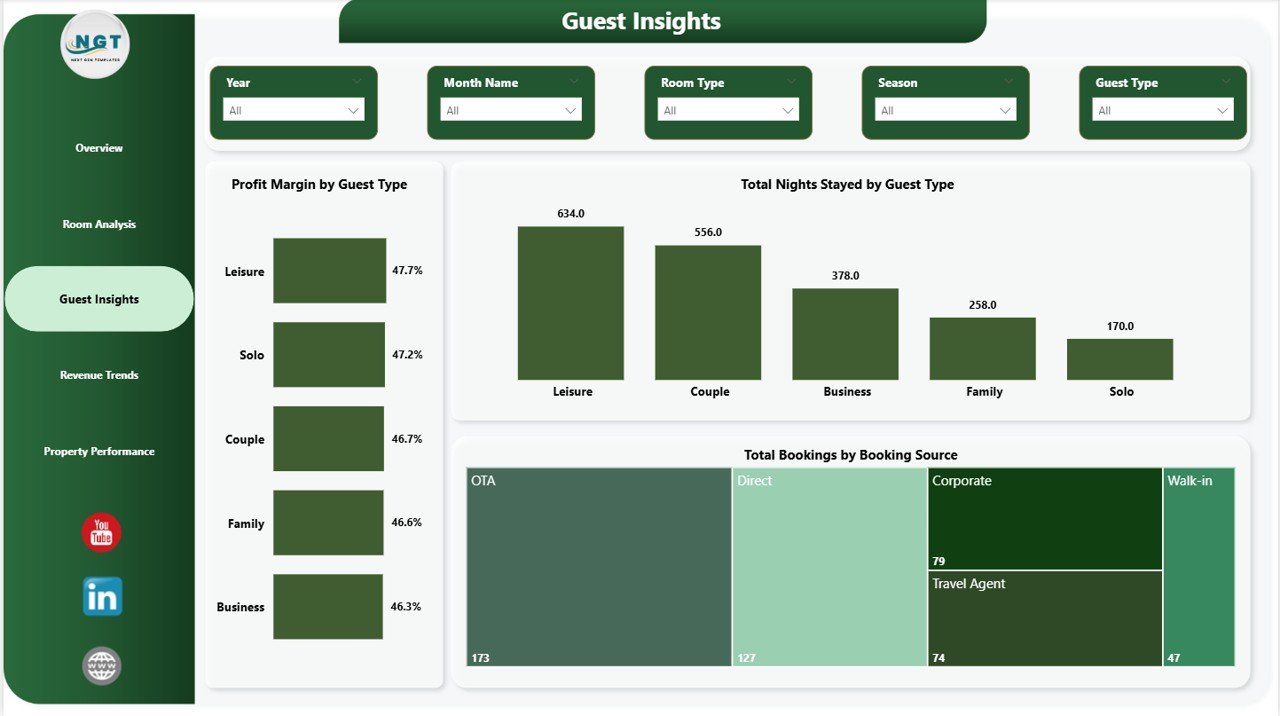
Guest Insights
4 — Revenue Trends
The Revenue Trends page is essential for identifying seasonal patterns and planning pricing strategies. Total Revenue by Month Name provides a monthly breakdown of income to spot peak and low periods. Net Profit by Season helps understand which seasons are most profitable for your hotel business. Total Bookings by Month Name reveals booking volume trends throughout the year, which is critical for capacity planning and promotional campaigns.
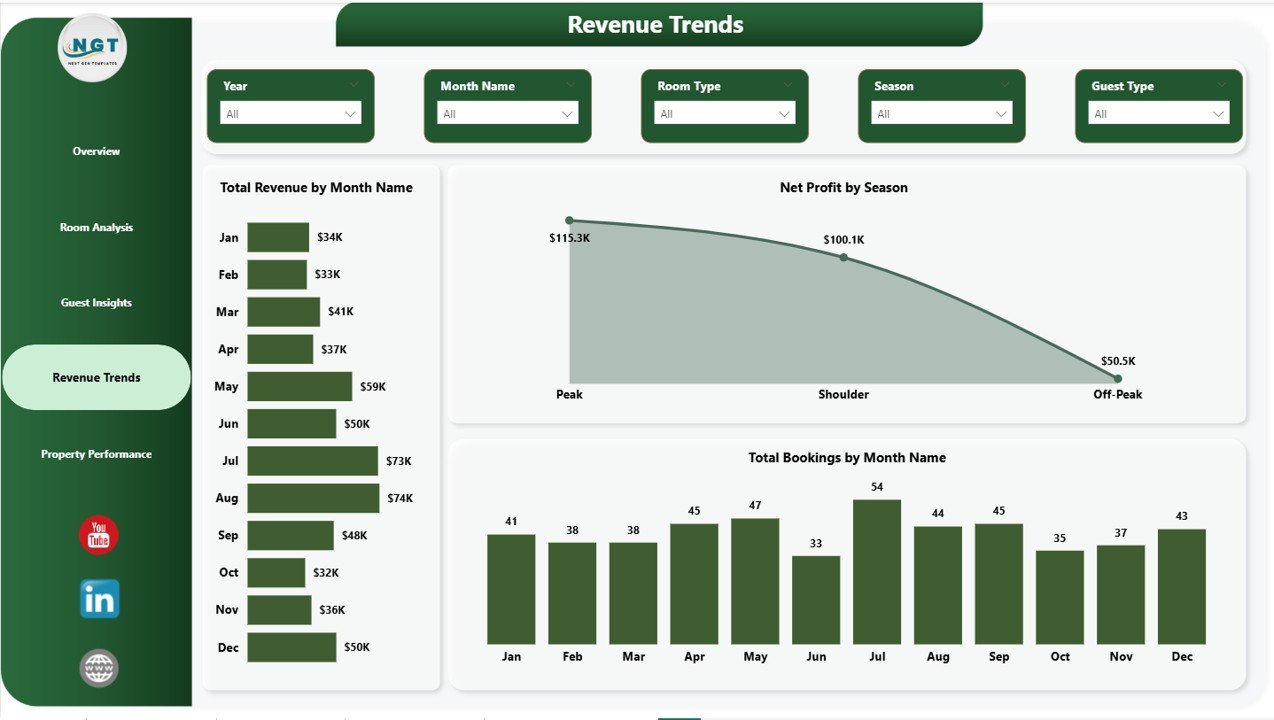
Revenue Trends
5 — Property Performance
The Property Performance page enables multi-property comparison and operational benchmarking. Total Operating Cost by Month Name tracks how operational expenses fluctuate over time. Profit Margin by Booking Source identifies which reservation channels deliver the best returns on investment. Total Revenue by City provides a geographic breakdown of income, making it easy to compare performance across different boutique hotel locations. This is particularly useful for hotel groups managing properties in multiple cities.
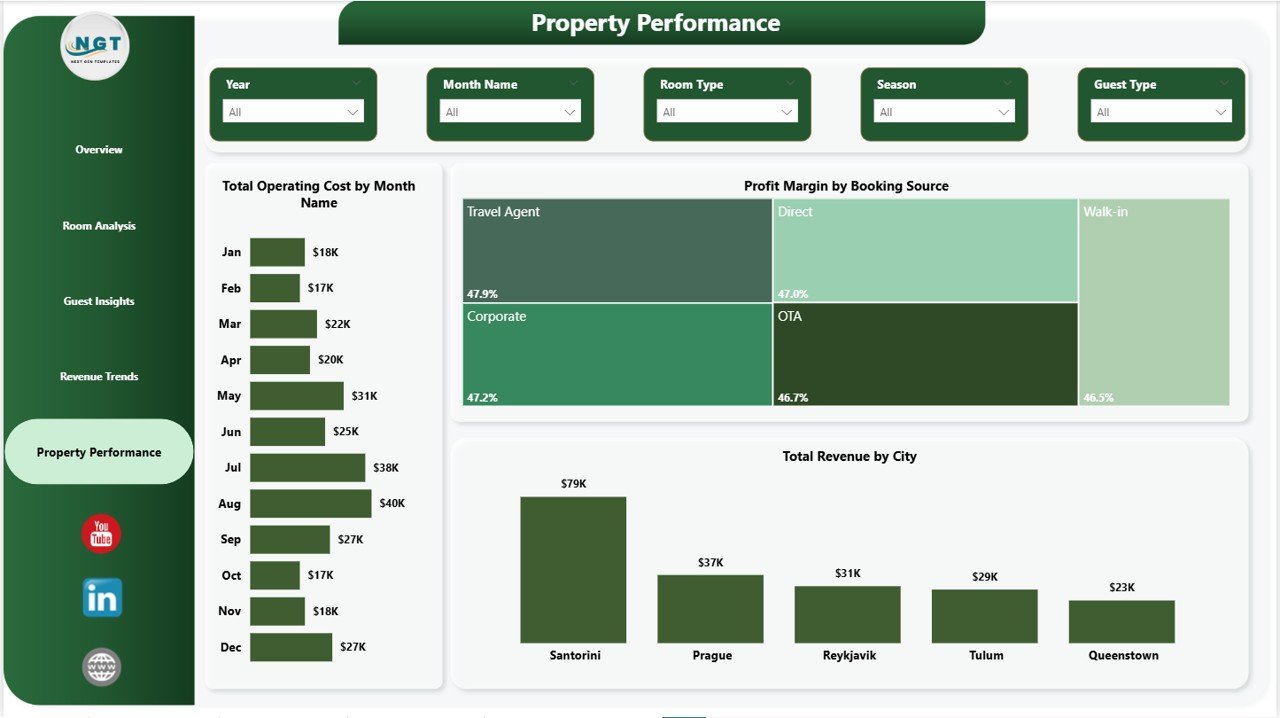
Property Performance
Advantages of Boutique Hotels Dashboard in Power BI
- Centralized Analytics — All your hotel data is consolidated into one interactive dashboard, eliminating the need for multiple spreadsheets and manual reports.
- Real-Time Decision Making — Dynamic slicers and instant filtering allow managers to get answers to business questions in seconds rather than hours.
- Professional Presentation — The clean, modern design makes it suitable for board presentations, investor meetings, and management reviews.
- Cost Control — Detailed cost breakdowns by room type, guest type, and season help identify areas where expenses can be optimized.
- Revenue Optimization — Seasonal trends and booking source analysis enable data-driven pricing and marketing decisions.
- Guest Experience Improvement — Guest rating analysis highlights which room types and services need attention to boost satisfaction scores.
Opportunities for Improvement
- Adding occupancy rate tracking would provide deeper insights into room utilization and capacity optimization.
- Including a year-over-year comparison feature would help measure growth and identify long-term trends more effectively.
- A dedicated marketing ROI page could help hotels measure the return on investment from different advertising channels.
- Integration with real-time booking APIs could enable live dashboard updates without manual data refreshes.
Best Practices for Using This Dashboard
- Update Data Regularly — Refresh your data source weekly or monthly to keep insights current and actionable.
- Use Slicers Strategically — Combine multiple filters to drill down into specific segments like luxury room bookings during peak season.
- Share with Stakeholders — Publish the dashboard to Power BI Service so team members can access it from anywhere.
- Set Performance Benchmarks — Use the dashboard to establish KPI targets and track progress over time.
- Combine with Other Templates — Pair this dashboard with the Hotel Chains KPI Dashboard in Power BI for comprehensive performance management.
Explore Relevant Templates
If you found this Boutique Hotels Dashboard in Power BI useful, explore these related templates to enhance your hospitality analytics toolkit:
- Boutique Hotels Dashboard in Excel — The Excel version with pivot tables and dynamic charts.
- Hotel Chains KPI Dashboard in Power BI — KPI tracking with MTD, YTD, and target comparison for hotel chains.
- Hotel Chains KPI Dashboard in Excel — Excel-based KPI monitoring for hotel groups.
- Hospitality Dashboard in HTML — Browser-based hospitality analytics with multi-tab navigation.
- Sustainable Tourism KPI Scorecard in Excel — Track sustainability KPIs for eco-friendly hotel operations.
Frequently Asked Questions
What software do I need to use this dashboard?
You need Microsoft Power BI Desktop, which is free to download from the Microsoft website. Simply open the .pbix file in Power BI Desktop to start using the dashboard.
Can I use my own hotel data with this template?
Yes, the dashboard is designed to be customizable. Replace the sample data with your actual hotel booking records in the same column format and refresh the visuals to see your own data come to life.
Is this dashboard suitable for multiple hotel properties?
Absolutely. The Property Performance page includes city-wise comparisons, making it ideal for boutique hotel groups managing properties across different locations.
How often should I update the data?
For best results, update your data weekly or monthly. This ensures your dashboard reflects the latest booking trends, revenue figures, and guest satisfaction scores.
Can I share this dashboard with my team?
Yes, you can publish the dashboard to Power BI Service for team access, or export individual pages as PDF reports for stakeholders who do not have Power BI access.
Conclusion
The Boutique Hotels Dashboard in Power BI is your ultimate analytics companion for managing boutique hotel performance with confidence. With five interactive pages, dynamic slicers, and comprehensive revenue, guest, and property analysis, this template transforms raw booking data into actionable insights that drive smarter decisions. Whether you are a hotel owner, revenue manager, or hospitality consultant, this dashboard saves hours of manual reporting and delivers professional-grade analytics instantly.
Click here to Purchase Boutique Hotels Dashboard in Power BI
Visit our YouTube channel to learn step-by-step video tutorials — Youtube.com/@PK-AnExcelExpert