Clinical Trials Management Dashboard in Power BI is a professionally designed, ready-to-use analytics template built for pharmaceutical companies, clinical research organizations (CROs), and healthcare research teams who need to track trial performance, budgets, patient enrollment, adverse events, and sponsor compliance from a single interactive Power BI report. Whether you manage a handful of trials or hundreds across multiple countries, this Power BI Dashboard Template delivers the visual intelligence you need to make faster, data-driven decisions and ensure regulatory readiness.
This template includes 5 interactive dashboard pages — Overview, Trial Analysis, Site Performance, Sponsor Review, and Timeline Trends. It tracks key metrics including Total Trials, Total Budget, Total Adverse Events, Average Compliance Score, and Total Enrolled Patients. Multiple slicers on each page allow instant filtering by therapeutic area, trial phase, sponsor, site location, and time period. Every chart and KPI card updates dynamically when you replace the sample data with your own clinical trial records.
Click here to Purchase Clinical Trials Management Dashboard in Power BI
Key Features of Clinical Trials Management Dashboard in Power BI
This Clinical Trials Management Dashboard in Power BI is packed with features designed to give clinical operations teams complete visibility over their trial portfolio. Here are the highlights that make it stand out:
- 5 Interactive Dashboard Pages – The template includes Overview, Trial Analysis, Site Performance, Sponsor Review, and Timeline Trends pages that together provide a 360-degree view of your clinical trial operations.
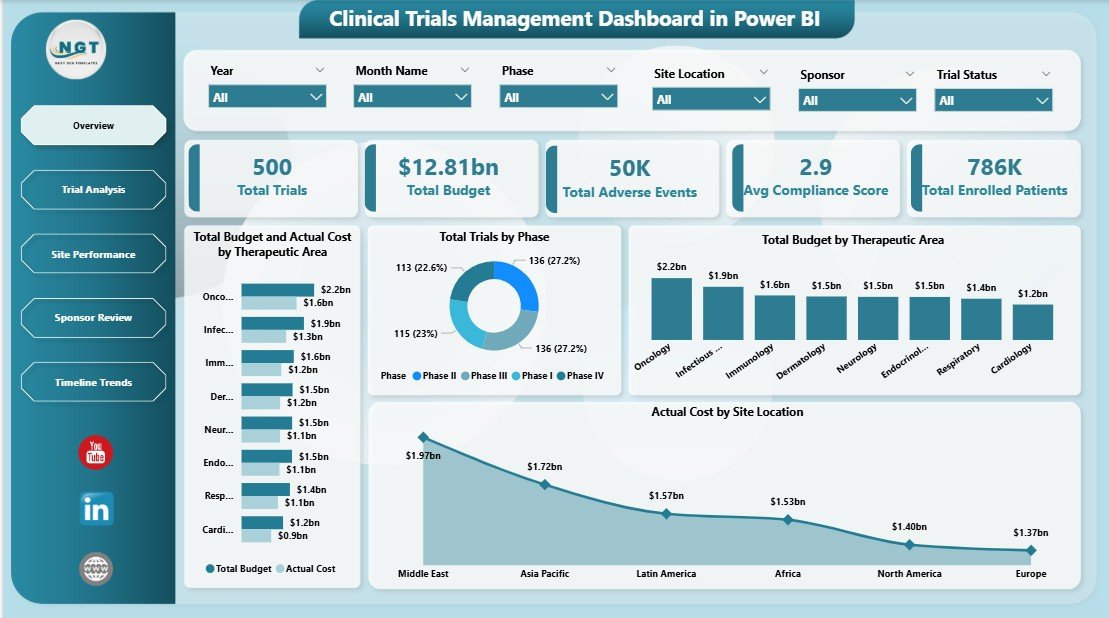
- Dynamic KPI Cards – The Overview page features 5 high-level KPI cards displaying Total Trials, Total Budget, Total Adverse Events, Avg Compliance Score, and Total Enrolled Patients for instant situational awareness.
- Budget vs Actual Cost Comparison – Compare budgeted amounts against actual costs by therapeutic area and site location to identify variances and control overspending in real-time.
- Multiple Slicers for Quick Filtering – Every page includes interactive slicers that let you instantly filter the entire dashboard by therapeutic area, trial phase, sponsor, site location, country, and date range.
- Geographic Performance Insights – The Site Performance page visualizes trial distribution across countries and adverse events by location, making it ideal for multi-site international trials.
- Sponsor Compliance Analytics – Dedicated Sponsor Review page evaluates each sponsor’s average compliance score, total trials managed, and patient enrollment performance.
- Temporal Trend Analysis – The Timeline Trends page tracks enrollment by phase, monthly budget patterns, and enrollment by trial status to identify bottlenecks and seasonal variations.
- Fully Editable and Customizable – Modify charts, add new pages, adjust colors, and connect to your own data sources directly in Power BI Desktop.
For teams that prefer working in spreadsheets, the Clinical Trials Management Dashboard in Excel version offers similar analytics powered by pivot tables and slicers. You can also explore other healthcare analytics templates in our Power BI Dashboard collection.
Click here to Purchase Clinical Trials Management Dashboard in Power BI
Dashboard Pages Explained
1. Overview Page
The Overview page serves as the executive summary of your entire clinical trial portfolio. At the top, you will find 5 KPI cards that display Total Trials, Total Budget, Total Adverse Events, Avg Compliance Score, and Total Enrolled Patients. These cards give stakeholders an immediate snapshot of the organization’s trial health. Below the cards, you will find charts showing Total Budget and Actual Cost by Therapeutic Area, which lets you compare planned versus actual spending across each medical specialty. The Total Trials by Phase chart breaks down your portfolio by trial phases (Phase I through Phase IV), helping you understand your pipeline distribution. Total Budget by Therapeutic Area shows where the money is being allocated, while Actual Cost by Site Location reveals which research sites are consuming the most resources. Multiple slicers at the top allow you to filter the entire page by therapeutic area, phase, sponsor, and location in a single click.
Click here to Purchase Clinical Trials Management Dashboard in Power BI
Clinical Trials Management Dashboard in Power BI
2. Trial Analysis
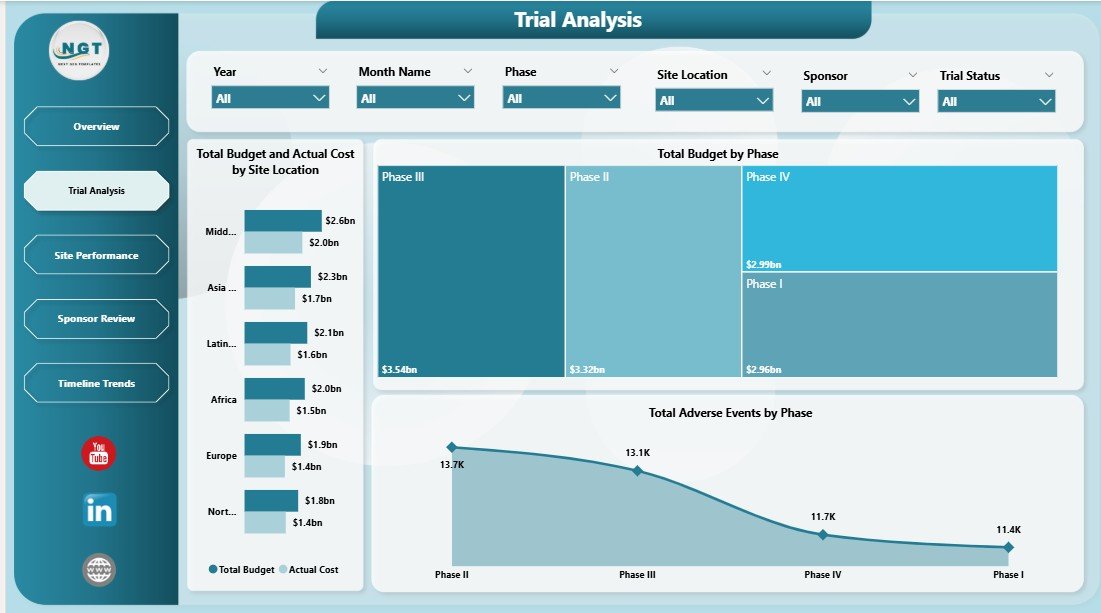
The Trial Analysis page provides a deeper financial and safety breakdown of your clinical trials. The Total Budget and Actual Cost by Site Location chart helps you identify which sites are running over budget and which are operating efficiently. This is critical for cost control during multi-site trials. The Total Budget by Phase chart shows how funding is distributed across different trial phases, helping you plan resource allocation for upcoming phases. The Total Adverse Events by Phase chart highlights which phases are generating the most safety concerns, enabling your pharmacovigilance team to prioritize monitoring efforts where they matter most.
Trial Analysis
3. Site Performance
The Site Performance page focuses on geographic distribution and location-level metrics for your trials. The Total Trials by Country chart gives you a clear view of where your trials are being conducted globally, which is essential for regulatory submissions and resource planning. Total Adverse Events by Site Location identifies specific research sites with elevated safety signals, enabling targeted corrective actions. Total Budget by Sponsor shows how different sponsors are contributing to the overall trial funding, helping you evaluate sponsor financial commitments across your portfolio.
Click here to Purchase Clinical Trials Management Dashboard in Power BI
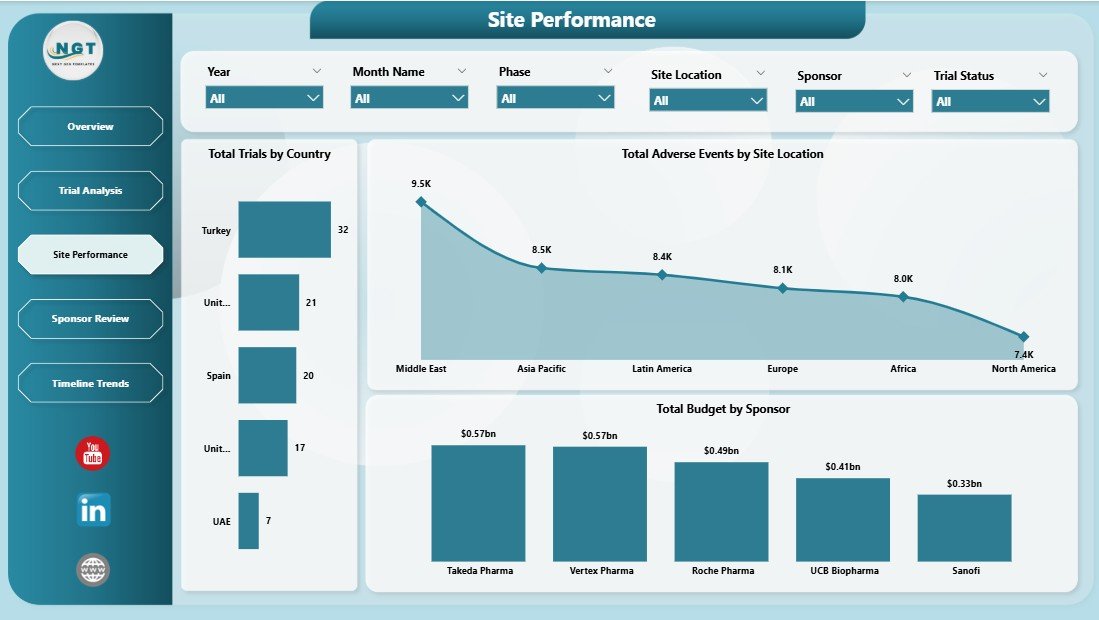
Site Performance
4. Sponsor Review
The Sponsor Review page is dedicated to evaluating sponsor performance and engagement. The Avg Compliance Score by Sponsor chart ranks sponsors based on their regulatory compliance, making it easy to identify which sponsors consistently meet quality standards and which require improvement. Total Trials by Sponsor shows the volume of trials each sponsor is managing, providing context for the compliance scores. Total Enrolled Patients by Sponsor reveals the enrollment capacity and effectiveness of each sponsor, helping clinical operations teams decide where to allocate future trials for maximum enrollment efficiency.
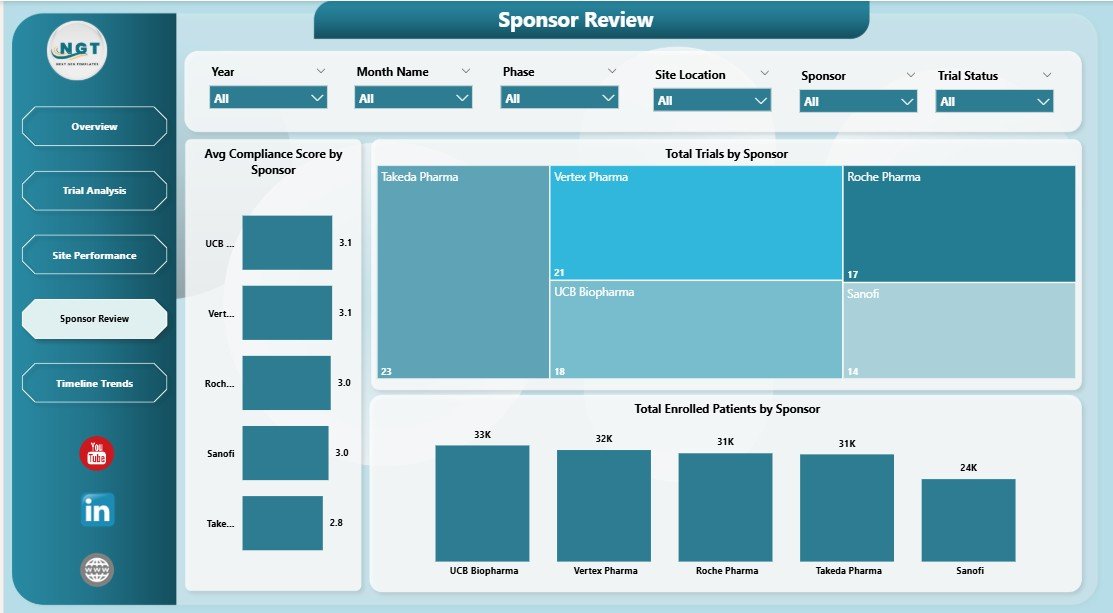
Sponsor Review
5. Timeline Trends
The Timeline Trends page helps you track how trial metrics evolve over time. Total Enrolled Patients by Phase shows enrollment distribution across trial phases, helping you identify where enrollment is accelerating or stalling. Total Budget by Month Name reveals monthly spending patterns, which is essential for cash flow planning and identifying seasonal budget spikes. Total Enrolled Patients by Trial Status breaks down enrollment by active, completed, suspended, and terminated trials, giving you a clear picture of your trial portfolio’s current state and helping you forecast future enrollment needs.
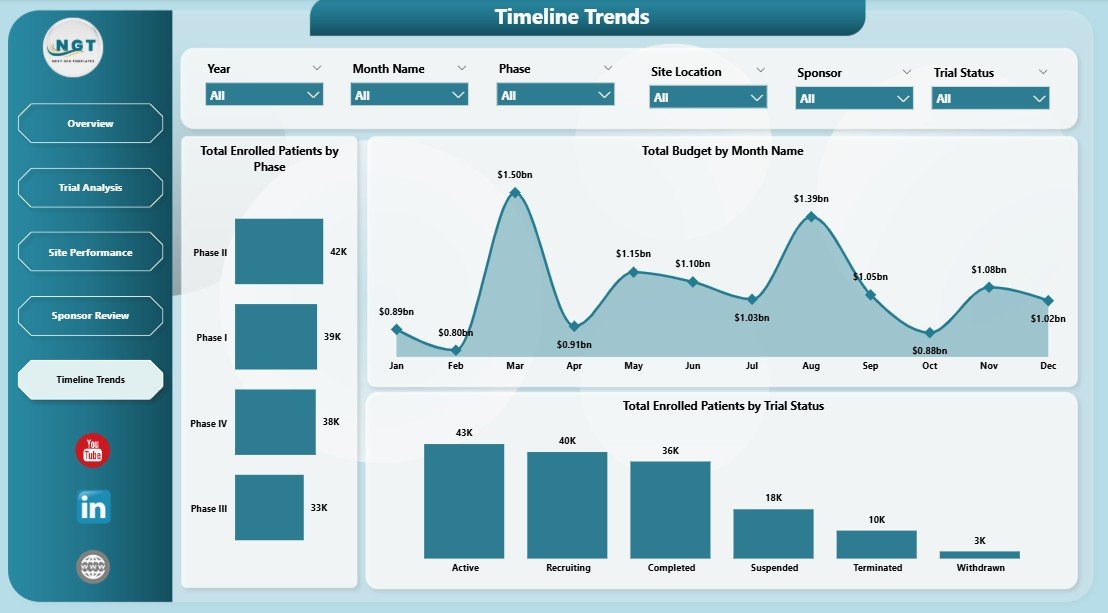
Timeline Trends
Advantages of Clinical Trials Management Dashboard in Power BI
- Centralized Trial Intelligence – Eliminate scattered spreadsheets and disconnected reports. All your trial data lives in one professional dashboard with 5 purpose-built pages.
- Instant Budget Oversight – The budget vs actual cost comparisons on the Overview and Trial Analysis pages help you catch overspending before it becomes a problem.
- Regulatory Readiness – With compliance scores, adverse event tracking, and structured trial data, your team is always audit-ready.
- Global Trial Visibility – Country-level and site-level breakdowns ensure you never lose sight of what’s happening at individual research locations.
- Executive-Ready Presentations – The clean, professional design with consistent color coding makes this dashboard perfect for board meetings, sponsor updates, and regulatory presentations.
- No Coding Required – Simply replace sample data and refresh. All charts and KPIs update automatically in Power BI Desktop.
- Click here to Purchase Clinical Trials Management Dashboard in Power BI
Opportunities for Improvement
- Predictive Analytics – Adding forecasting models for enrollment timelines and budget projections would enhance forward-looking decision-making.
- Patient-Level Drill-Down – While the dashboard provides aggregate views, adding patient-level detail pages could benefit pharmacovigilance teams.
- Automated Data Refresh – Connecting to live databases through Power BI Gateway would eliminate manual data replacement steps.
- Risk Scoring Models – Incorporating risk-based monitoring indicators on the Site Performance page could help identify at-risk sites earlier.
Best Practices for Using This Dashboard
- Update Data Weekly – For active trials, refreshing your data weekly ensures dashboards reflect current enrollment, budget, and safety status.
- Use Slicers Strategically – Apply multiple slicer combinations (e.g., Therapeutic Area + Phase + Sponsor) to isolate specific trial segments for focused analysis.
- Monitor Budget Variances – Regularly compare the budget vs actual cost charts on the Overview and Trial Analysis pages to catch deviations early.
- Review Sponsor Compliance Monthly – The Sponsor Review page should be part of your monthly governance meetings to keep sponsor quality on track.
- Track Enrollment Velocity – Use the Timeline Trends page to identify if enrollment is on schedule or falling behind projected timelines.
- Bookmark Key Filter States – Power BI Desktop allows you to save bookmarks for frequently used filter combinations, saving time during recurring reviews.
For more healthcare analytics solutions, explore our Blood Banks Dashboard in Power BI and Cardiology Institutes Dashboard in Power BI. You can also read about the Bioinformatics Companies Dashboard in Power BI for more healthcare data visualization ideas.
Explore Relevant Templates
- Clinical Trials Management Dashboard in Excel – The same clinical trials analytics in a fully automated Excel workbook with pivot tables and slicers.
- Blood Banks Dashboard in Power BI – Complete blood bank operations analytics with donor tracking and inventory management.
- Cardiology Institutes Dashboard in Power BI – Cardiology department analytics with patient outcomes and procedure tracking.
- Medical Tourism KPI Dashboard in Power BI – Track medical tourism KPIs including patient volumes, revenue, and destination analytics.
- Bioinformatics Companies Dashboard in Power BI – Bioinformatics research and operations analytics in a professional Power BI template.
Frequently Asked Questions
What is the best Power BI template for managing clinical trials data?
The Clinical Trials Management Dashboard in Power BI from NextGenTemplates is one of the most comprehensive clinical trials analytics templates available. It includes 5 interactive dashboard pages covering trial overview, financial analysis, site performance, sponsor review, and timeline trends, tracking 5 key KPIs across multiple dimensions like therapeutic area, phase, sponsor, and site location.
How do I use the Clinical Trials Management Dashboard in Power BI?
Download the .pbix file after purchase and open it in Power BI Desktop, which is free from Microsoft. Review the sample data to understand the column structure, then replace it with your own clinical trial records. Refresh the data model and all 5 dashboard pages will update automatically with your real numbers. No DAX or Power Query coding is needed.
What KPIs does this clinical trials dashboard track?
The dashboard tracks 5 primary KPIs on the Overview page: Total Trials, Total Budget, Total Adverse Events, Average Compliance Score, and Total Enrolled Patients. These metrics are then analyzed across all 5 pages by therapeutic area, trial phase, sponsor, site location, country, and time period for comprehensive clinical trial management analytics.
Can this dashboard handle multi-site international clinical trials?
Yes. The Site Performance page specifically includes Total Trials by Country and Total Adverse Events by Site Location, making it ideal for pharmaceutical companies and CROs running clinical trials across multiple countries and dozens of research sites. The slicers allow you to filter by any geographic dimension for focused regional analysis.
Is there an Excel version of this clinical trials dashboard?
Yes. NextGenTemplates offers a Clinical Trials Management Dashboard in Excel that provides similar analytics powered by pivot tables and slicers. It includes the same 5 dashboard pages plus a data sheet and support sheet with underlying pivot tables.
Do I need Power BI Pro to use this template?
No. You only need Power BI Desktop, which is completely free to download from Microsoft. Power BI Pro is only needed if you want to share the dashboard online with colleagues through the Power BI Service. For personal analysis and presentations, Power BI Desktop is sufficient.
Click here to Purchase Clinical Trials Management Dashboard in Power BI
Conclusion
The Clinical Trials Management Dashboard in Power BI is an essential analytics tool for any organization involved in clinical research. With 5 interactive pages, dynamic KPI cards, budget vs actual cost comparisons, sponsor compliance tracking, and timeline trend analysis, this template delivers everything you need to manage your trial portfolio effectively. Whether you are a pharmaceutical company, CRO, or academic research institute, this dashboard transforms raw clinical data into actionable insights that drive better decisions and ensure regulatory readiness.
Click here to Purchase Clinical Trials Management Dashboard in Power BI
Visit our YouTube channel for step-by-step Power BI tutorials: Youtube.com/@PK-AnExcelExpert