Introduction
The Curriculum Development Services KPI Dashboard is an essential tool designed to help educational institutions, training centers, and curriculum developers monitor and analyze their key performance indicators effectively. This ready-to-use template streamlines the tracking process, enabling stakeholders to make data-driven decisions and optimize curriculum development outcomes with ease.
Key Features of Curriculum Development Services KPI Dashboard
Click to Buy Curriculum Development Services KPI Dashboard
- Seven comprehensive worksheets covering all essential KPI aspects.
- Interactive dropdowns to select months and KPIs dynamically.
- Up-to-date comparisons of Month-to-Date (MTD), Year-to-Date (YTD), target values, and previous year data.
- Conditional formatting with intuitive up/down arrows for quick performance insights.
- Well-structured input sheets to enter Actual, Target, and Previous Year numbers seamlessly.
- Visual trend charts illustrating KPI progress over time.
- Detailed KPI definitions including formula, unit, and classification (Lower the Better or Upper the Better).
Dashboard Pages Explanation
1. Home Sheet
This is the index sheet equipped with six navigation buttons. Each button directs you seamlessly to the respective worksheets, allowing quick access and easy navigation.
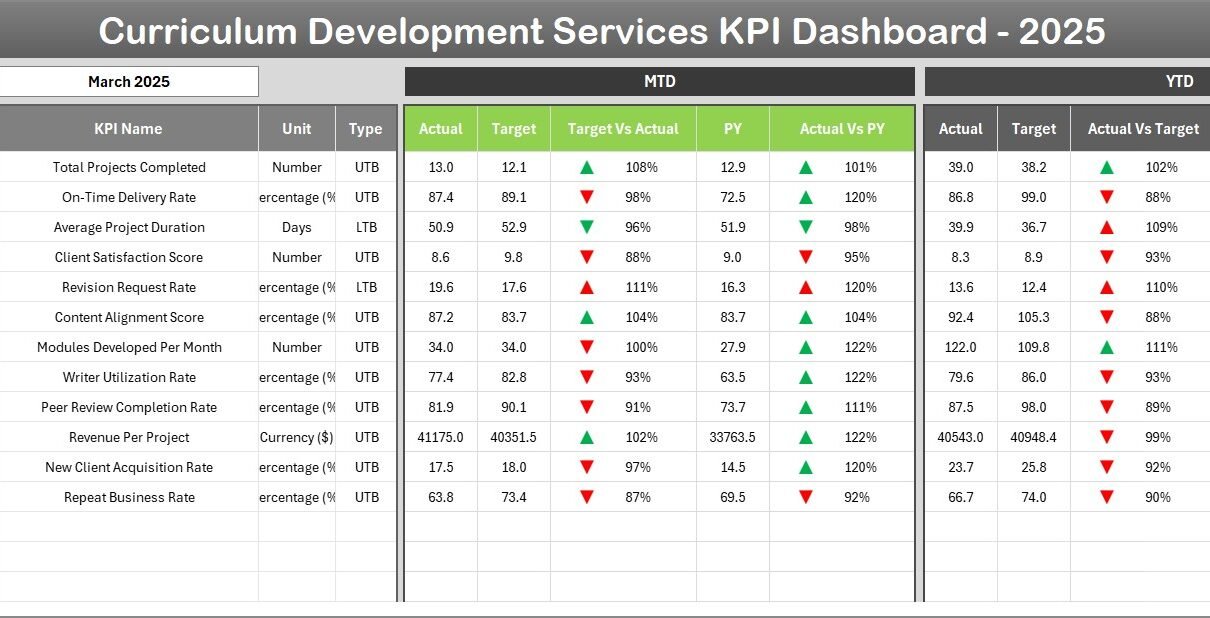
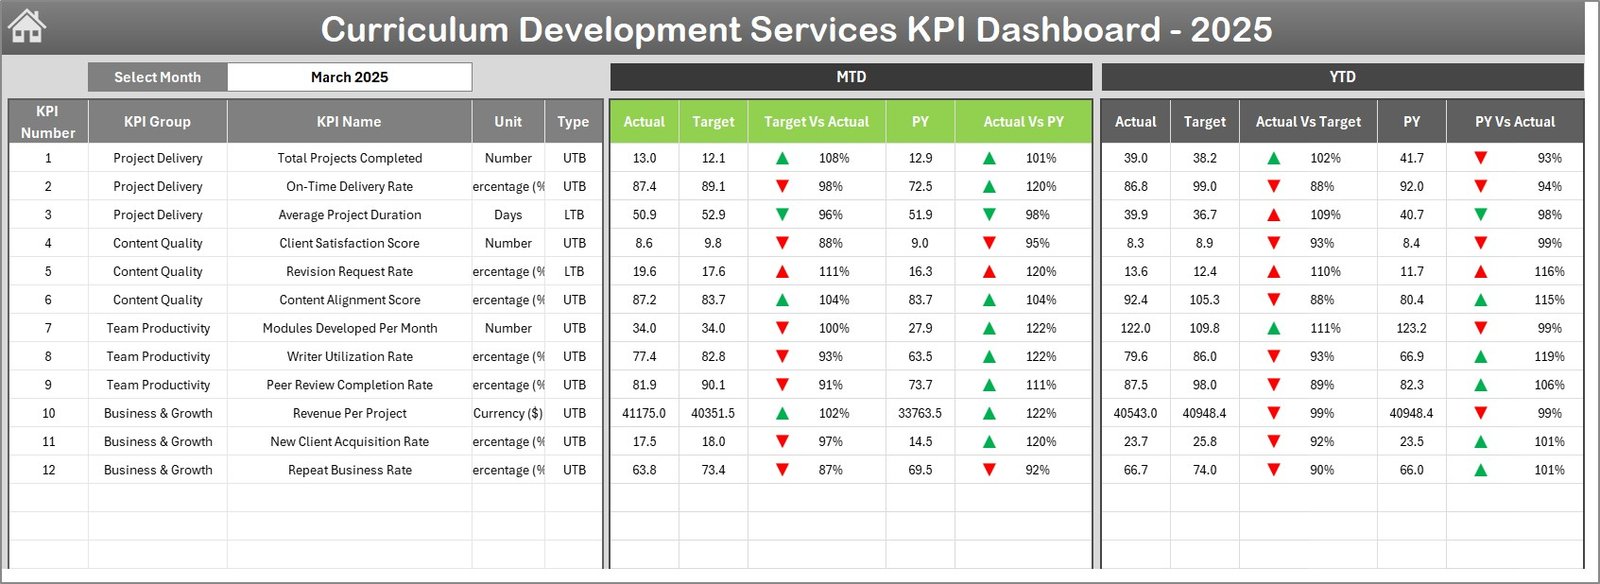
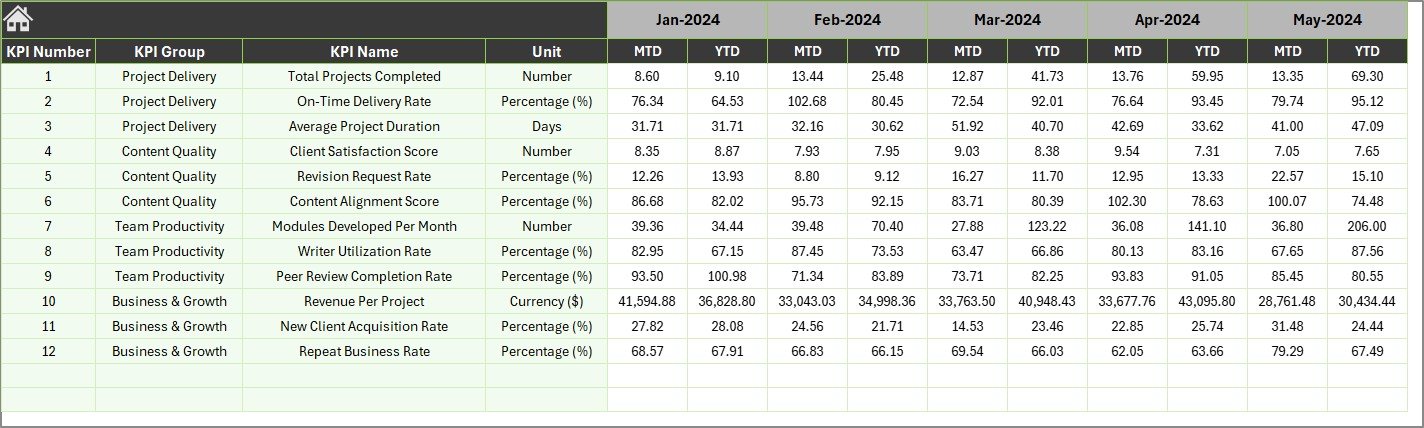
2. Dashboard Sheet Tab
The core component of the dashboard, this sheet summarizes all KPIs for your curriculum development projects.
- Drop-down selection available on cell D3 to filter data by month.
- Displays MTD Actual, Target, and Previous Year figures alongside target vs actual and previous year vs actual comparisons.
- Includes YTD data with the same detailed comparisons.
- Conditional formatting applies intuitive up/down arrows that highlight performance variances.
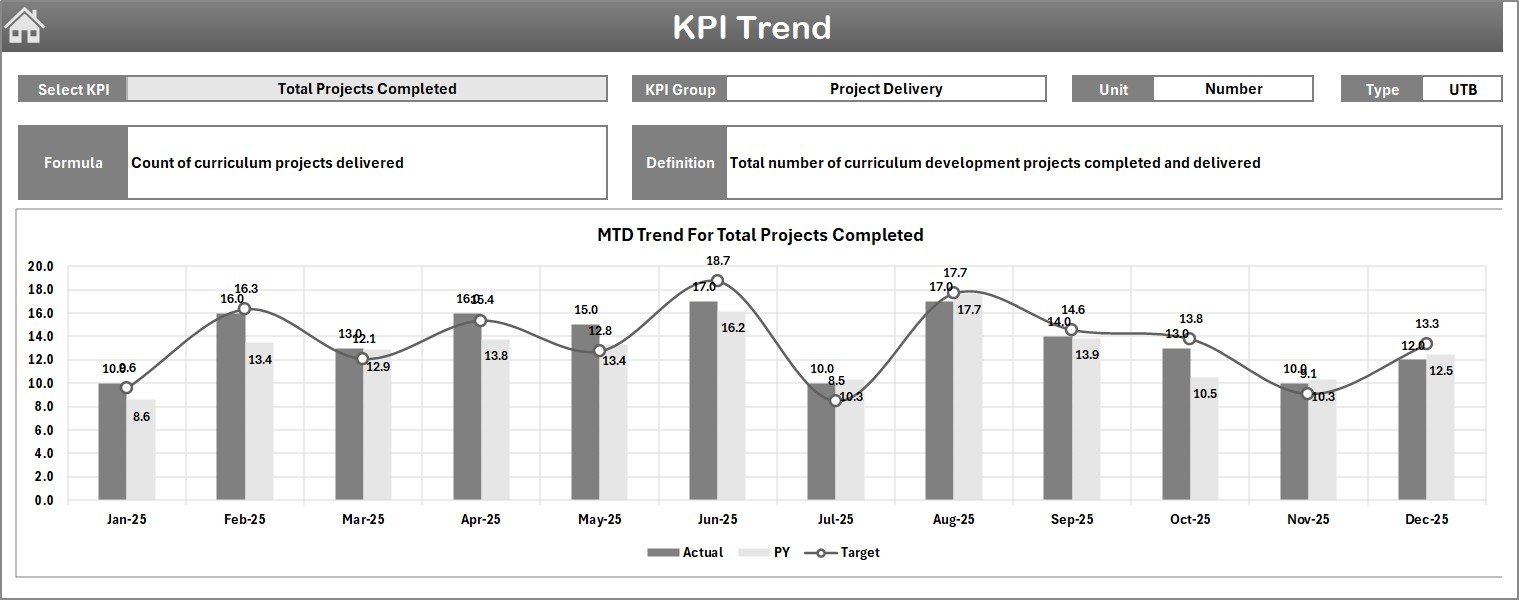
3. KPI Trend Sheet Tab
Here, users can select the KPI from a drop-down menu located at cell C3. The sheet provides detailed KPI metadata and visual trends.
- Displays KPI Group, Unit of Measurement, Type (Lower the Better or Upper the Better), and Formula.
- Includes a clear definition of each KPI.
- Visual MTD and YTD trend charts depict Actual, Target, and Previous Year progress.
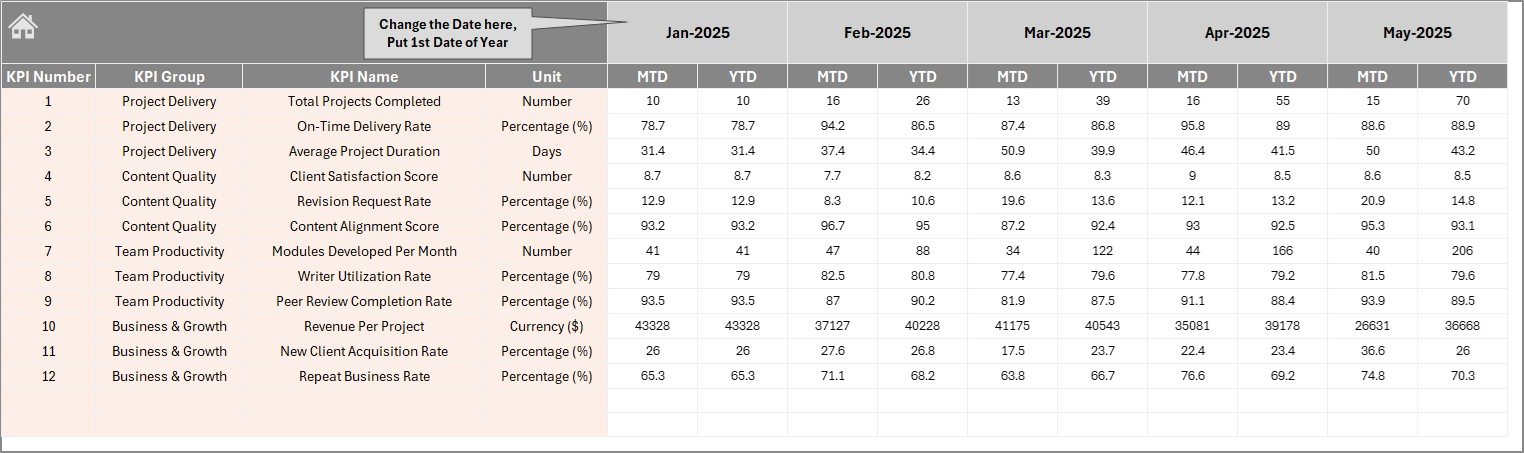
4. Actual Numbers Input Sheet
This sheet is designed for entering actual performance numbers.
- Supports both YTD and MTD data input for selected months.
- The start month of the year can be adjusted via cell E1.
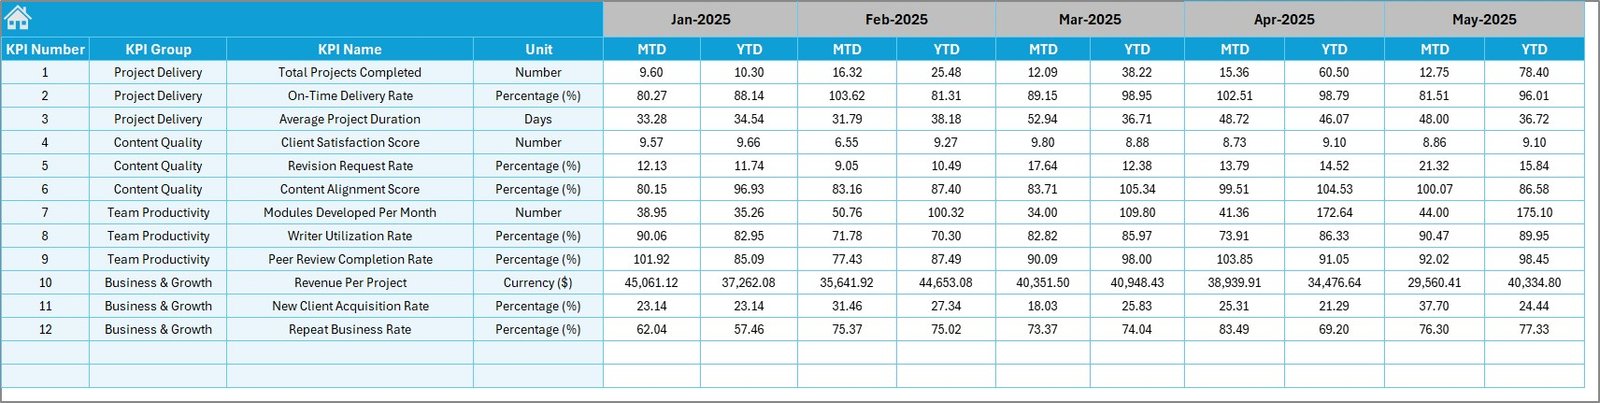
5. Target Number Input Sheet
Users can enter and update target KPI values on this tab.
- Targets can be input for both MTD and YTD periods.
- This helps in comparing actual performance against predefined goals.
6. Previous Year Number Sheet Tab
This sheet facilitates the entry of previous year’s KPI data, allowing for meaningful year-over-year comparisons.
- Data structure mirrors current year’s input format for consistency.
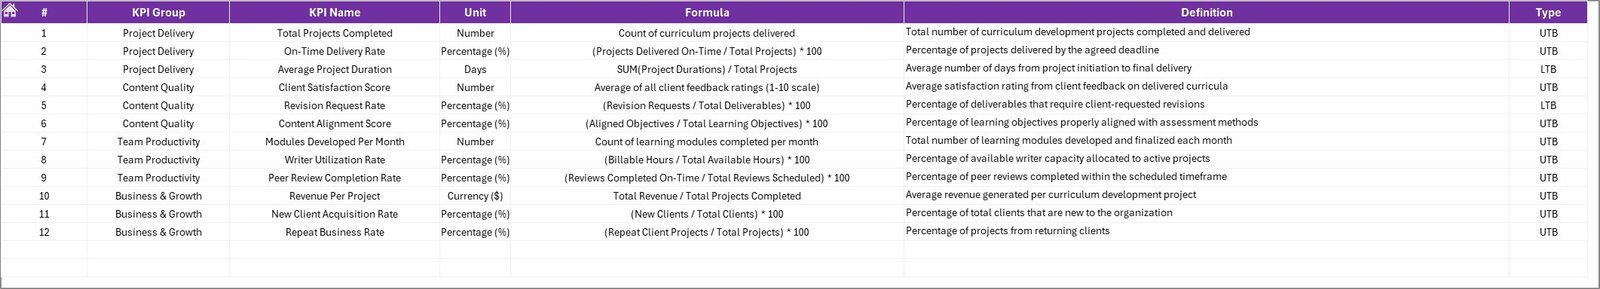
7. KPI Definition Sheet Tab
This final sheet is critical for defining and categorizing every KPI.
- Entries include KPI Name, Group, Unit, Formula, and a detailed KPI definition.
- KPI Type is classified as either LTB (Lower the Better) or UTB (Upper the Better) in the last column, aiding in correct dashboard interpretations.
Advantages of Curriculum Development Services KPI Dashboard
- Real-Time Monitoring: Quickly assess KPI performance month-wise with dynamic filtering.
- Comprehensive Data Tracking: Consolidated views of Actual, Target, and Previous Year data in one place.
- Easy Updates: Separate input sheets reduce data entry errors and simplify updates.
- Visualization: Trend charts provide visual insights into KPI progression.
- Decision Support: Conditional formatting and KPI classifications facilitate actionable insights.
- User-Friendly Navigation: Interactive home page and well-organized tabs minimize user confusion.
Opportunities for Improvement
Click to Buy Curriculum Development Services KPI Dashboard
- Integrating automated data import from Learning Management Systems (LMS) for more efficient data population.
- Adding drill-down capability to analyze KPI performance at a granular level.
- Incorporating predictive analytics to forecast KPI trends based on historical data.
- Expanding KPI categories to include stakeholder feedback and qualitative metrics.
- Implementing mobile-friendly views or dashboards accessible on tablets and phones.
Best Practices
- Regularly update Actual, Target, and Previous Year data to maintain dashboard accuracy.
- Review KPI definitions carefully to ensure alignment with institutional goals.
- Use the trend analysis to identify areas requiring curriculum improvement promptly.
- Leverage conditional formatting cues to prioritize actions on KPIs showing negative trends.
- Encourage data transparency among stakeholders by sharing dashboard insights.
FAQs
Click to Buy Curriculum Development Services KPI Dashboard
Can I customize the KPI Dashboard?
Yes, this dashboard template is designed to be flexible. You can add new KPIs or modify existing ones by updating the KPI Definition sheet.
Is any special software required to use the dashboard?
The dashboard is created in Microsoft Excel, so you need an Excel-compatible application that supports dropdowns, charts, and conditional formatting.
How often should I update the dashboard data?
It’s best to update actual and target numbers monthly to reflect accurate progress and maintain relevancy.
Can I link data from external sources?
While not included by default, the dashboard can be extended to link external data via Excel’s data connection features.
Is the conditional formatting customizable?
Yes, you can adjust threshold levels and arrow styles from the Conditional Formatting settings in Excel.
Conclusion
Click to Buy Curriculum Development Services KPI Dashboard
The Curriculum Development Services KPI Dashboard is a powerful, user-friendly tool that centralizes key performance data and visualizes trends to improve curriculum management effectively. By leveraging this dashboard, educators and administrators can track goals with clarity, identify performance gaps, and drive continuous improvement in curriculum delivery. Its modular design, dynamic filtering, and clear visual cues make it an indispensable asset for any curriculum development team.
For more advanced Excel dashboard templates and tips, visit the official Microsoft Excel Resource Center: Microsoft Excel Help & Learning.
Visit our YouTube channel to watch the demo.
Click to Buy Curriculum Development Services KPI Dashboard