Content Creator Revenue Dashboard in Power BI
Content Creator Revenue Dashboard in Power BI is a powerful, ready-to-use analytics template designed for digital content creators, YouTubers, podcasters, social media influencers, and content agencies who want to track revenue, views, ad spend, and profitability across multiple platforms. Built in Microsoft Power BI, this dashboard provides 5 interactive pages — Overview, Revenue Trend, Platform Analysis, Creator Performance, and Content Insights — covering every dimension of content monetization analytics. Whether you are a solo creator looking to maximize your earnings or a content agency managing multiple talent accounts, this template transforms raw data into actionable business intelligence.
With growing competition in the creator economy, understanding your revenue streams, platform performance, and content ROI is essential for sustainable growth. This Content Creator Revenue Dashboard in Power BI helps you identify your most profitable platforms, track revenue per mille (RPM) trends, compare creator contributions, and optimize your ad spend allocation — all from a single, beautifully designed Power BI file.
Key Features of Content Creator Revenue Dashboard in Power BI
This Power BI dashboard template is packed with features specifically designed for the creator economy:
- 5 Interactive Dashboard Pages — Overview, Revenue Trend, Platform Analysis, Creator Performance, and Content Insights provide a complete 360-degree view of your content business
- KPI Cards — Track Total Views, Total Revenue, Revenue Per Mille (RPM), and Total Ad Spend at a glance from the Overview page
- Revenue and Profit Analysis — Monitor Total Revenue, Net Profit, and Profit Margin across months, platforms, creators, and content categories
- Multi-Platform Comparison — Compare views, earnings, RPM, and profit margins across YouTube, Instagram, TikTok, podcasts, and other channels
- Creator Benchmarking — Evaluate individual creator performance with revenue, views, and engagement score tracking
- Ad Spend Intelligence — Visualize advertising expenditure by region and measure ROI against production costs
- Dynamic Slicers and Filters — Drill down into specific time periods, platforms, categories, regions, and revenue sources with interactive filters
- Revenue Source Breakdown — Understand earnings from ads, sponsorships, merchandise, and other income streams
- Professional Design — Clean, modern interface with intuitive tab navigation perfect for stakeholder presentations
Dashboard Pages Explained
The Content Creator Revenue Dashboard in Power BI includes 5 purpose-built pages, each designed to answer specific business questions about your content monetization performance.
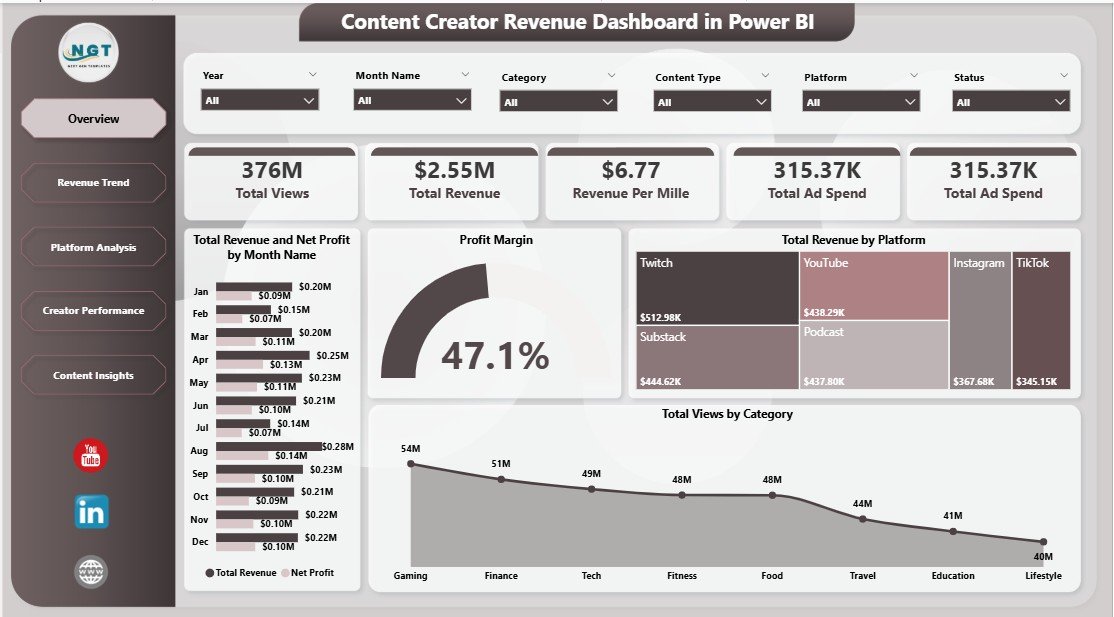
1 — Overview Page
The Overview page is your command center — providing a high-level snapshot of your entire content business. At the top of the page, prominent KPI cards display your four most critical metrics: Total Views, Total Revenue, Revenue Per Mille (RPM), and Total Ad Spend. These cards give you an instant pulse check on your content performance without needing to dig deeper.
Below the KPI cards, the page features several interactive charts. Total Revenue and Net Profit by Month Name provides a time-series trend analysis so you can spot seasonal patterns and growth trajectories. Profit Margin shows your overall profitability health. Total Revenue by Platform breaks down earnings across YouTube, Instagram, TikTok, and other channels so you can see where your money comes from. Total Views by Category reveals which content types — tutorials, vlogs, reviews, entertainment — drive the most audience engagement. Multiple slicers at the top let you filter the entire dashboard by date range, platform, category, or any other dimension instantly.
Content Creator Revenue Dashboard in Power BI
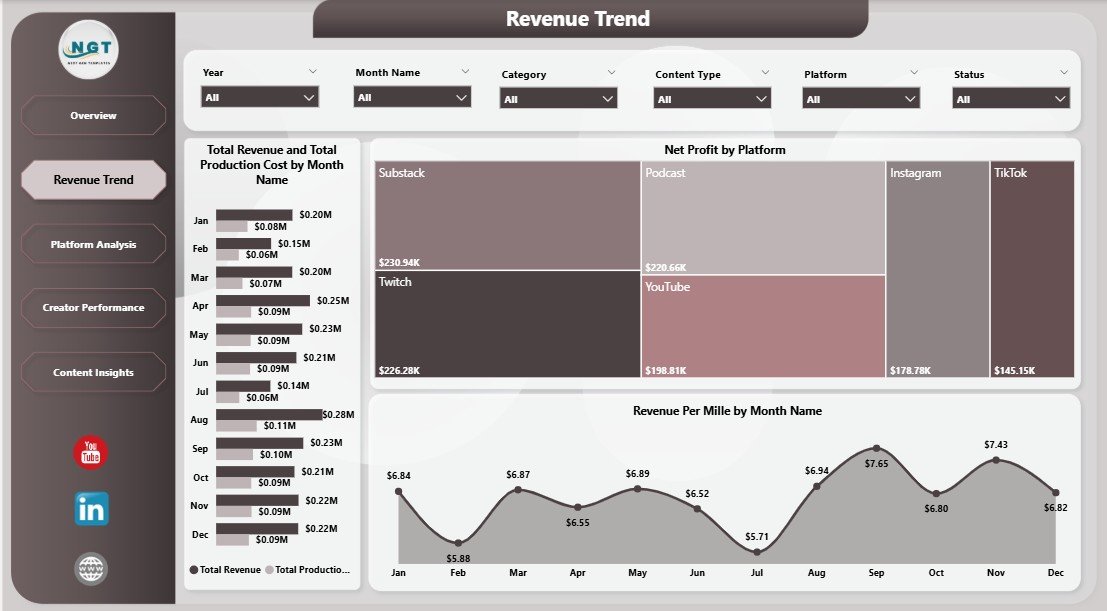
2 — Revenue Trend
The Revenue Trend page takes a deeper dive into your financial performance over time, helping you understand cost efficiency and profitability trends. It features three key analyses: Total Revenue and Total Production Cost by Month Name lets you compare your earnings against production expenses to track cost efficiency over time. Net Profit by Platform reveals which content channels deliver the highest bottom-line returns after accounting for all costs. Revenue Per Mille by Month Name tracks your RPM trends to show whether your content is becoming more or less valuable per thousand views over time.
This page is particularly valuable for creators who invest in production — video editing, equipment, studio costs — and need to ensure their spending translates into proportional revenue growth. If your RPM is declining while production costs are rising, this page makes that trend impossible to miss.
Click here to Purchase the Content Creator Revenue Dashboard in Power BI
Revenue Trend
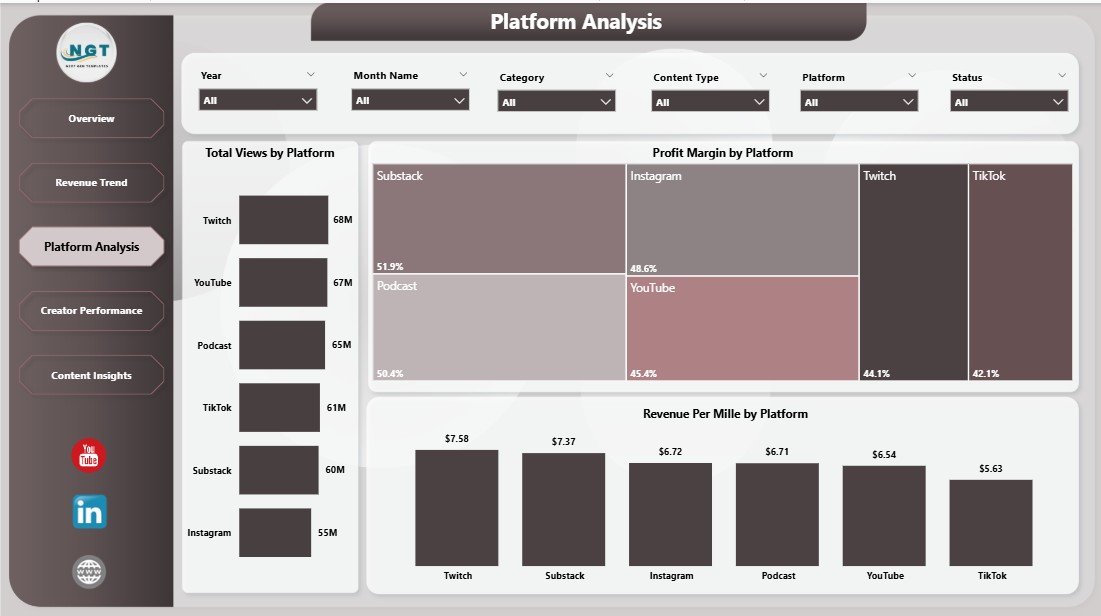
3 — Platform Analysis
The Platform Analysis page is where you compare performance metrics across all your content distribution platforms side by side. For creators who publish across multiple channels — YouTube, Instagram, TikTok, podcasts, blogs — this page answers the critical question: where should you invest your creative energy?
It includes three focused analyses: Total Views by Platform shows audience reach across each channel. Profit Margin by Platform reveals which platforms deliver the highest returns relative to costs. Revenue Per Mille by Platform compares your per-view earnings across channels, helping you prioritize platforms where your content monetizes best. This analysis is invaluable for making strategic decisions about platform allocation and content distribution strategy.
Click here to Purchase the Content Creator Revenue Dashboard in Power BI
Platform Analysis
4 — Creator Performance
The Creator Performance page is specifically designed for content teams, agencies, and multi-creator operations. If you manage a roster of creators or collaborate with other talent, this page provides the benchmarking data you need. It showcases Total Revenue and Net Profit by Creator so you can see which creators generate the most revenue and profit. Total Views by Creator compares audience reach across your talent roster. Avg Engagement Score by Creator helps you identify which creators drive the most meaningful audience interactions — not just passive views.
This page transforms subjective performance assessments into objective, data-driven conversations. Whether you are deciding resource allocation, negotiating creator contracts, or identifying your top performers for brand partnerships, this analysis provides the evidence you need.
Click here to Purchase the Content Creator Revenue Dashboard in Power BI

Creator Performance
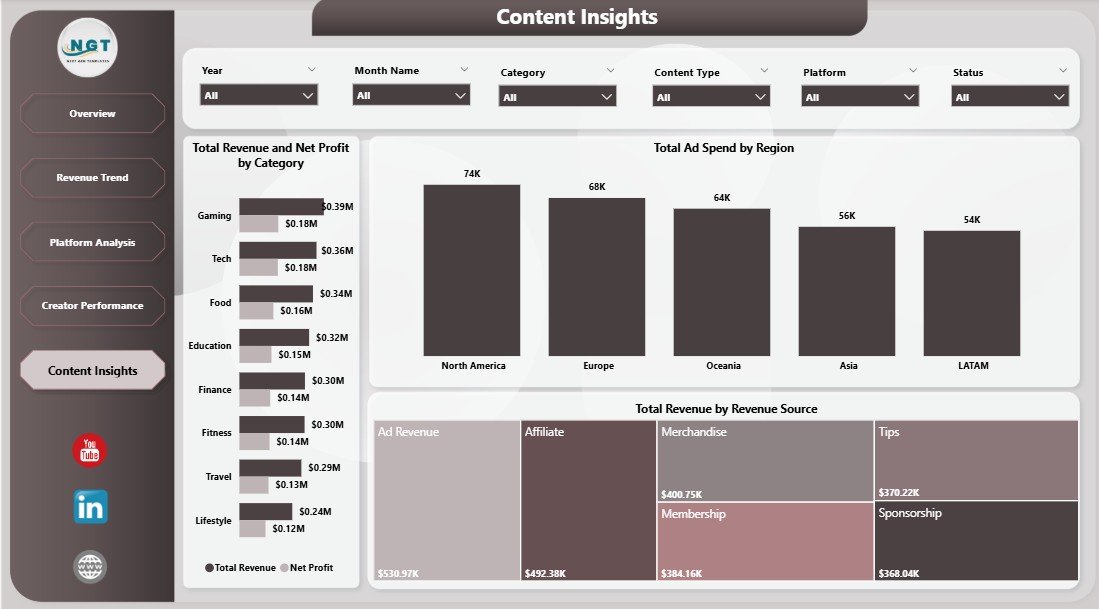
5 — Content Insights
The Content Insights page breaks down your revenue and spending by content category, geographic region, and revenue source — providing the strategic intelligence needed to optimize your content mix. Total Revenue and Net Profit by Category shows which content types — tutorials, entertainment, reviews, behind-the-scenes — generate the most income. Total Ad Spend by Region provides geographic insights into where your advertising budget is being deployed. Total Revenue by Revenue Source breaks down your earnings across ads, sponsorships, merchandise, affiliate marketing, and other income streams.
For creators looking to diversify their income beyond ad revenue, this page is particularly valuable. It shows exactly how much each revenue source contributes to your total earnings, helping you decide whether to pursue more sponsorship deals, launch merchandise, or invest in affiliate partnerships.
Content Insights
Advantages of Content Creator Revenue Dashboard in Power BI
- Unified Multi-Platform View — Consolidate analytics from YouTube, Instagram, TikTok, podcasts, and blogs into one comprehensive dashboard instead of checking multiple native analytics tools separately
- Revenue Optimization — Identify your most profitable platforms, content categories, and revenue sources to double down on what works and cut what does not
- Cost Efficiency Tracking — Monitor the relationship between production costs and revenue to ensure your investments deliver proportional returns
- Team Performance Management — For agencies and multi-creator operations, benchmark individual creator contributions objectively with data-driven insights
- Sponsor-Ready Reports — Present professional, data-backed analytics to sponsors and brand partners to negotiate better deals and demonstrate your content value
- Time Savings — Automated calculations and visualizations eliminate hours of manual spreadsheet work, letting you focus on content creation
- Click here to Purchase the Content Creator Revenue Dashboard in Power BI
Opportunities for Improvement
- API Integration — Currently uses manual data entry; connecting directly to YouTube API, Instagram Graph API, or TikTok API would enable real-time automated updates
- Audience Demographics — Adding viewer age, gender, and location breakdowns would enhance audience understanding and sponsor pitch materials
- Content-Level Granularity — Individual video or post-level performance tracking could help identify specific content pieces that drive the most revenue
- Forecasting Models — Adding revenue projections based on historical trends could improve financial planning and goal setting
Best Practices for Using This Dashboard
- Update Data Weekly — Refresh your content analytics data at least once a week to maintain accurate trend tracking and timely decision-making
- Benchmark Against Goals — Set monthly targets for Total Revenue, RPM, and Profit Margin, then use the dashboard to track progress against these benchmarks
- Review Platform Mix Quarterly — Use the Platform Analysis page every quarter to reassess which channels deserve more or less investment based on actual performance data
- Share with Sponsors — Export the Overview and Platform Analysis pages as PDFs when pitching to sponsors or brand partners to demonstrate your analytics maturity
- Track RPM Trends — Revenue Per Mille is one of the most important metrics for content creators; a declining RPM may signal algorithmic changes or audience fatigue that needs attention
Explore Relevant Templates
If you found this Content Creator Revenue Dashboard in Power BI useful, explore these related templates from NextGenTemplates:
- YouTube Channel Analytics Dashboard in Power BI — Deep-dive into YouTube-specific metrics including subscribers, watch time, video performance, and channel growth trends
- Content Creator Revenue Dashboard in Excel — Prefer working in spreadsheets? Get the same powerful content creator analytics in a familiar Excel format
- YouTube Channel Analytics Dashboard in Google Sheets — Cloud-based YouTube analytics you can access from anywhere using Google Sheets
- YouTube Channel Analytics Dashboard in HTML — Beautiful browser-based YouTube analytics that runs without any software installation
You can also explore our full library of Power BI Dashboard Templates covering finance, HR, sales, marketing, healthcare, and more. For related blog posts, check out the YouTube Channel Analytics Dashboard in Power BI walkthrough and the Podcast Platforms Dashboard in Power BI guide.
Frequently Asked Questions
What is the best Power BI dashboard template for tracking content creator revenue?
The Content Creator Revenue Dashboard in Power BI from NextGenTemplates is one of the most comprehensive options available. It includes 5 interactive pages covering overview KPIs, revenue trends, platform comparisons, individual creator performance, and content category insights — with dynamic slicers for instant filtering across all dimensions.
How do I track revenue across multiple content platforms in Power BI?
The Content Creator Revenue Dashboard in Power BI provides a dedicated Platform Analysis page that compares Total Views, Profit Margin, and Revenue Per Mille across YouTube, Instagram, TikTok, podcasts, and other channels. You simply input your platform-level data and the dashboard automatically generates side-by-side comparisons.
Can I use this Power BI template to manage a content team with multiple creators?
Yes. The Creator Performance page tracks Total Revenue, Net Profit, Total Views, and Avg Engagement Score for each individual creator. This makes it ideal for content agencies, media companies, and multi-creator operations that need objective performance benchmarking.
Do I need Power BI experience to use this content creator dashboard?
No advanced Power BI skills are required. Download the .pbix file, open it in Power BI Desktop (free from Microsoft), replace the sample data with your own content analytics, and all charts, KPI cards, and filters update automatically. No DAX formulas or data modeling knowledge needed.
What KPIs does this content creator revenue dashboard track?
The dashboard tracks Total Views, Total Revenue, Revenue Per Mille (RPM), Total Ad Spend, Net Profit, Profit Margin, Total Production Cost, and Avg Engagement Score. These metrics are analyzed across time periods, platforms, content categories, geographic regions, revenue sources, and individual creators.
How is Revenue Per Mille (RPM) calculated in this Power BI dashboard?
Revenue Per Mille (RPM) represents your earnings per thousand views. It is calculated as (Total Revenue / Total Views) × 1000. The dashboard tracks RPM trends over time and across platforms so you can identify where your content earns the most per view and optimize your content distribution strategy accordingly.
Conclusion
The Content Creator Revenue Dashboard in Power BI is an essential analytics tool for any digital content creator, influencer, or content agency serious about maximizing their earnings and understanding their content business performance. With 5 interactive pages covering overview metrics, revenue trends, platform comparisons, creator benchmarking, and content insights, this template provides everything you need to make informed, data-driven decisions about your content strategy.
Click here to Purchase the Content Creator Revenue Dashboard in Power BI
For step-by-step video tutorials on using Power BI dashboards and templates, visit our YouTube channel: