Church Finance Dashboard in Excel is a comprehensive, ready-to-use Excel template built specifically for churches, ministries, and faith-based organizations that want to manage their finances efficiently. Whether you need to track tithes, offerings, departmental expenses, donor contributions, or monthly income patterns, this dashboard consolidates everything into one powerful, interactive Excel file with 5 dashboard pages, 19 analytical charts, and dynamic pivot-powered automation.
Managing church finances can be challenging — especially when data is scattered across multiple spreadsheets, paper records, or manual systems. This Excel dashboard solves that problem by providing a centralized, visual, and easy-to-update financial management tool that any church administrator, pastor, treasurer, or finance committee member can use without any advanced Excel skills.
Click here to Purchase Church Finance Dashboard in Excel
Key Features of Church Finance Dashboard in Excel
The Church Finance Dashboard in Excel includes 5 interactive dashboard pages, each designed to provide targeted financial insights for different aspects of church operations. The dashboard tracks 5 key metrics through KPI cards: Total Records, Total Income, Total Expenses, Net Amount, and Total Received. With 19 analytical charts spread across the dashboard pages and built-in slicer filters, users can instantly explore their financial data from multiple angles.
The entire dashboard is powered by pivot tables housed in a dedicated Support sheet. After adding or updating data in the Data sheet, users simply click Refresh All under the Data tab in the Excel Ribbon, and every chart, card, and metric updates automatically. No formulas to edit, no macros to enable — just clean, dynamic, and automated financial reporting for your church.
Dashboard Pages Explained
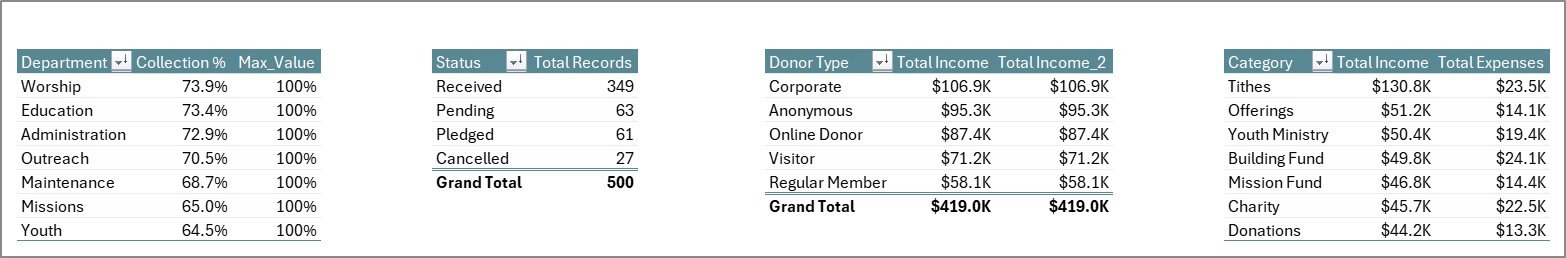
1. Overview Page
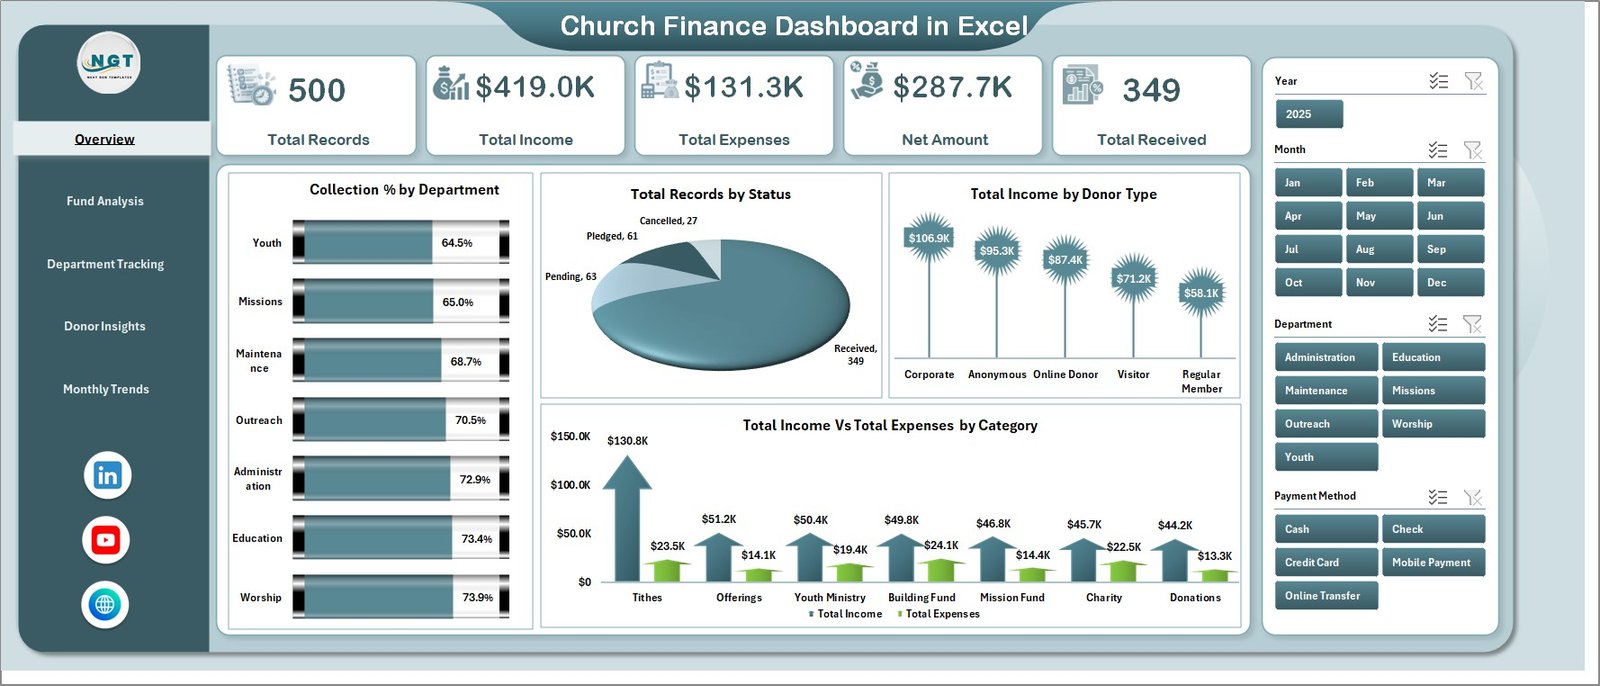
The Overview page serves as the central hub of the dashboard. At the top, it displays 5 KPI summary cards showing Total Records, Total Income, Total Expenses, Net Amount, and Total Received. Below the cards, 4 analytical charts provide a high-level financial snapshot: Collection % by Department shows how each department contributes to overall collections. Total Records by Status visualizes the distribution of records across different statuses. Total Income by Donor Type breaks down income sources by donor categories. Total Income Vs Total Expenses by Category compares revenue against spending across different financial categories.
Multiple slicers are available on this page, allowing users to filter the entire dashboard by department, status, category, or donor type for instant focused analysis.
 Church Finance Dashboard in Excel
2. Fund Analysis Page
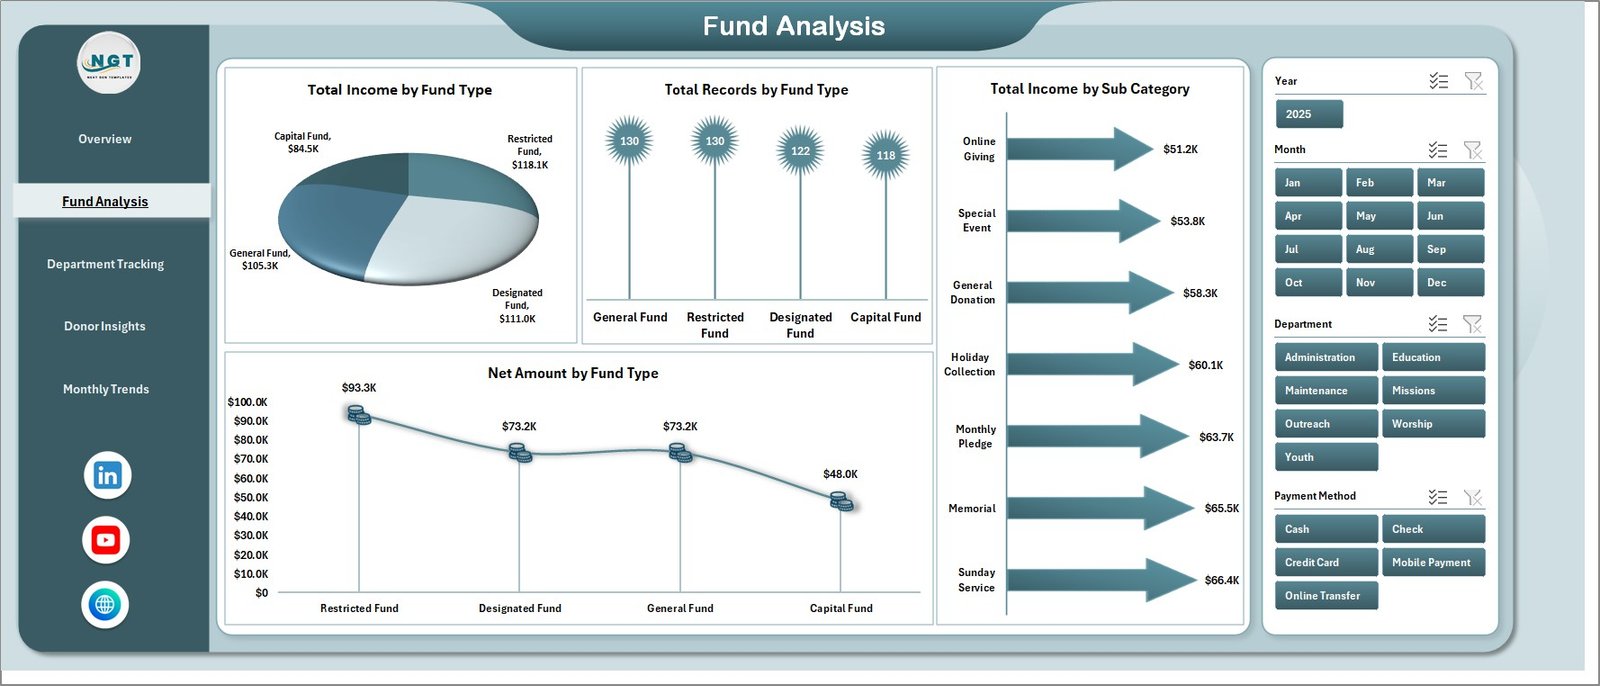
The Fund Analysis page breaks down the church’s financial data by fund type. It includes 4 charts: Total Income by Fund Type reveals which funds generate the most income — whether tithes, offerings, mission funds, or building funds. Total Records by Fund Type shows the volume of transactions per fund category. Total Income by Sub Category drills deeper into fund subcategories for granular insights. Net Amount by Fund Type displays the net financial position for each fund, helping treasurers identify surplus or deficit areas.
This page is essential for church treasurers and finance committees who need to understand fund allocation and ensure proper stewardship of designated and undesignated funds.
 Fund Analysis Page
3. Department Tracking Page
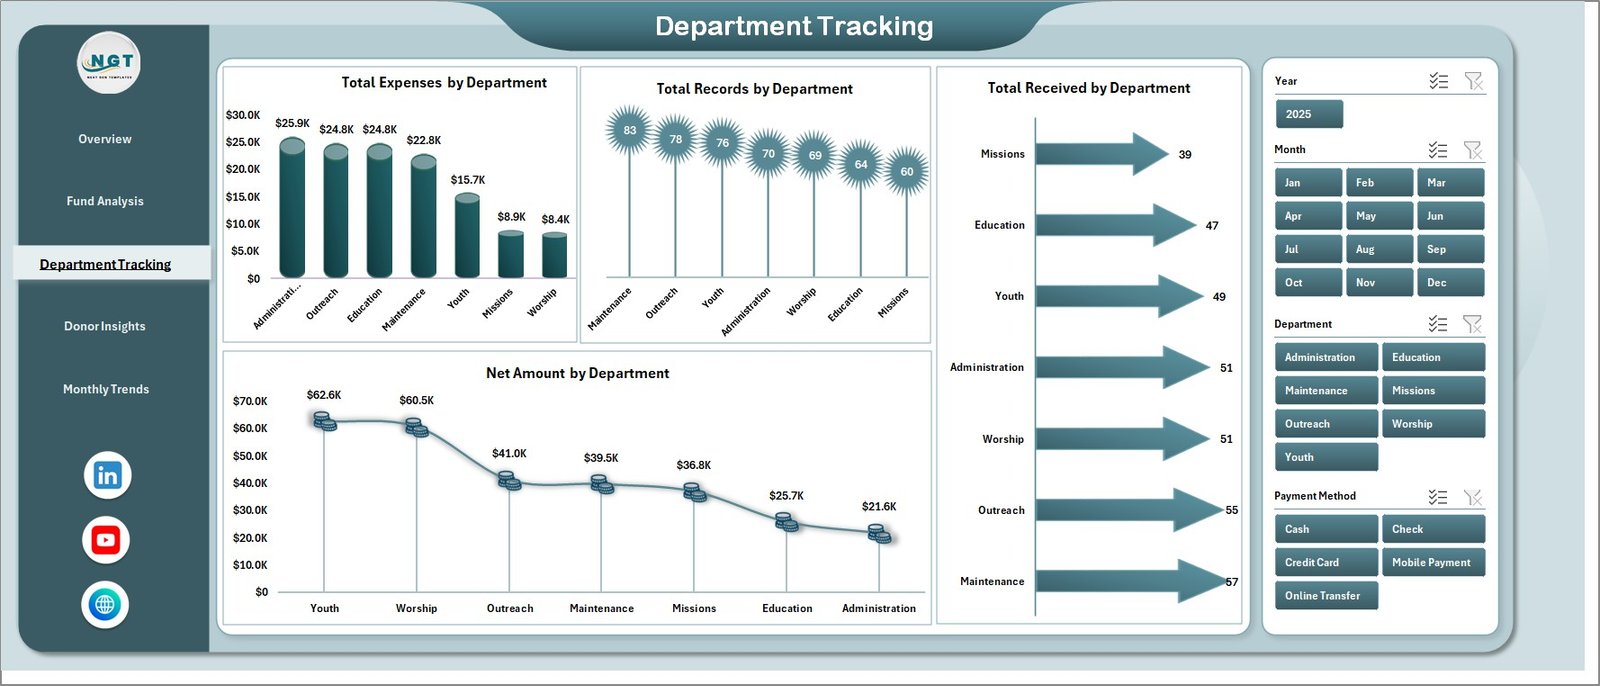
The Department Tracking page provides complete visibility into how each church department performs financially. It features 4 charts: Total Expenses by Department identifies which departments are spending the most. Total Records by Department shows the transaction volume per department. Total Received by Department highlights which departments collect the most income. Net Amount by Department reveals each department’s net financial position.
This page helps church leaders hold departments accountable, balance budgets, and make informed decisions about resource allocation across ministries like youth, worship, outreach, and administration.
 Department Tracking Page
4. Donor Insights Page
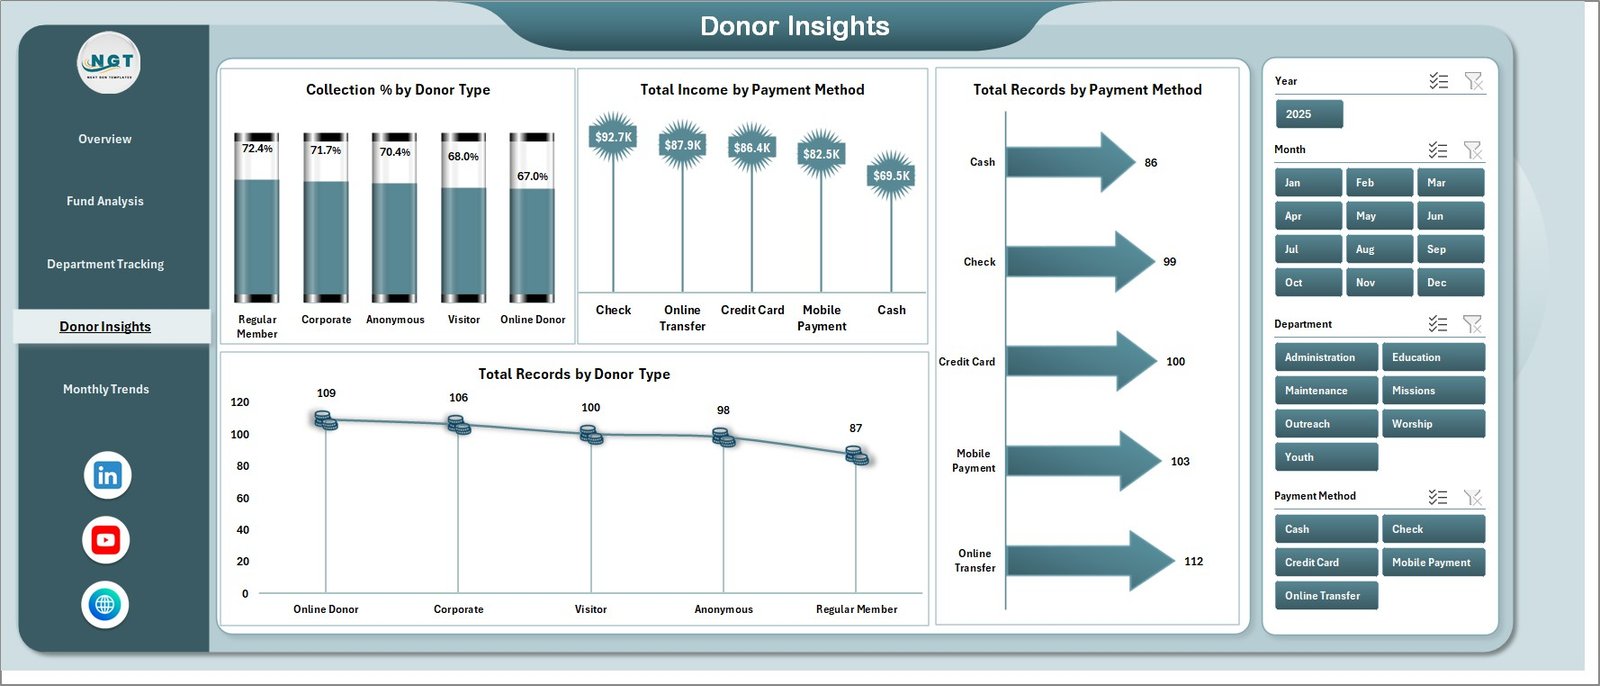
Understanding donor behavior is critical for church financial planning. The Donor Insights page includes 4 charts: Collection % by Donor Type shows the proportion of income from different donor categories like individual members, corporate donors, or anonymous contributions. Total Income by Payment Method breaks down income by how donations are received — cash, check, online transfer, or mobile payment. Total Records by Payment Method reveals the most frequently used payment channels. Total Records by Donor Type shows which donor categories are most active.
This analysis helps churches optimize their giving channels, understand donor preferences, and create targeted stewardship campaigns. You may also want to explore the Nonprofit Fundraising Dashboard in Excel for more donation tracking capabilities.
 Donor Insights Page
5. Monthly Trends Page
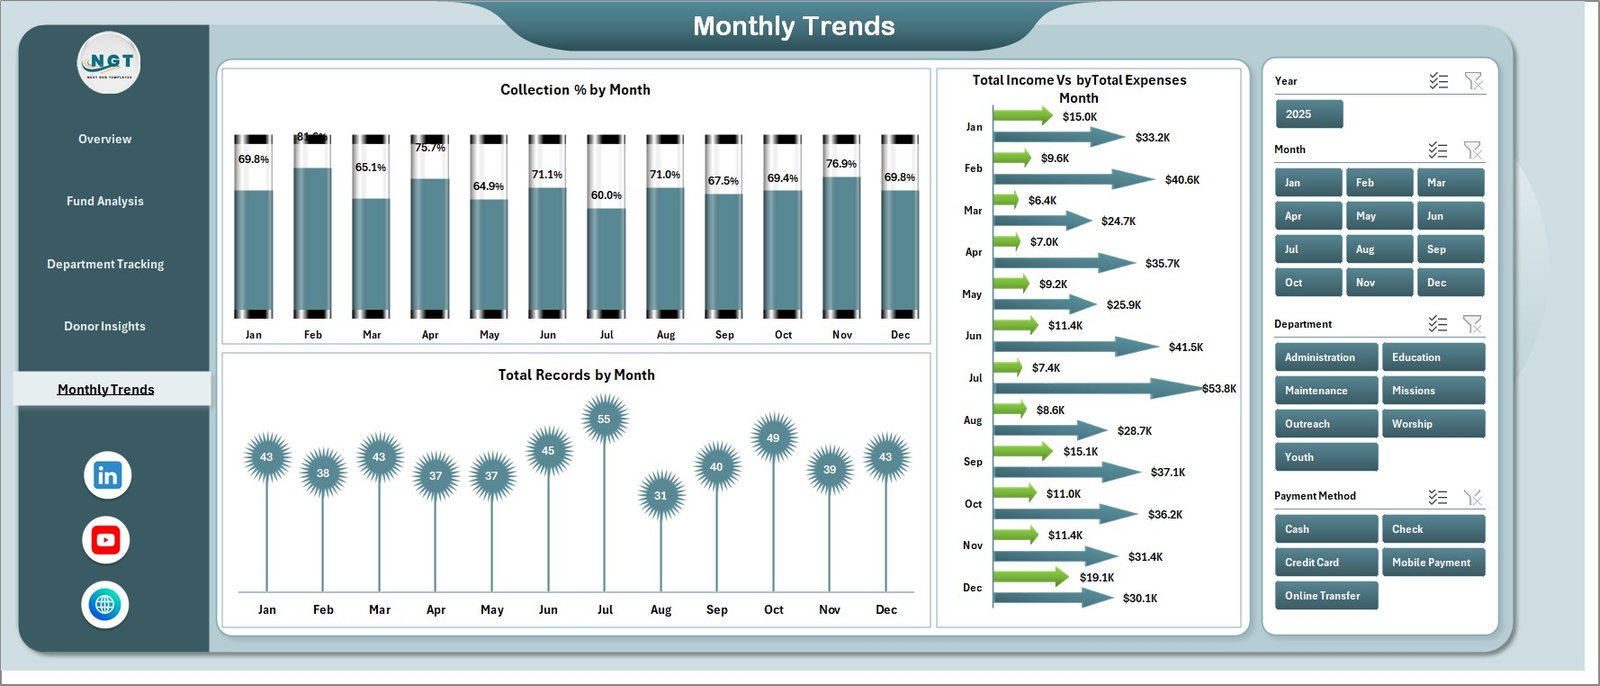
The Monthly Trends page tracks financial patterns over time through 3 charts: Collection % by Month shows how collection efficiency varies throughout the year. Total Income by Month reveals seasonal giving patterns — helping identify peak months like Christmas or Easter and slow periods. Total Records by Month displays transaction volume trends across the calendar year.
This time-based analysis is invaluable for annual budgeting, cash flow forecasting, and planning stewardship drives during historically low-giving months.
 Monthly Trends Page
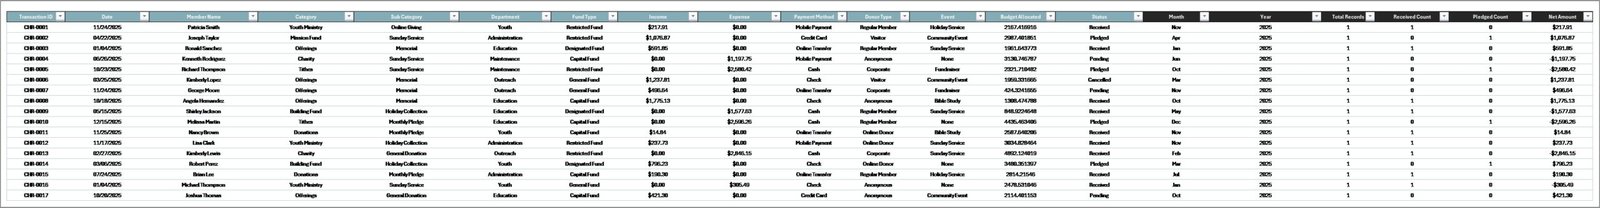
6. Data Sheet
The Data sheet is where all church financial records are entered. It follows a structured column format including fields for income, expenses, departments, fund types, donor types, payment methods, status, and dates. Users simply add their data in the same format as the sample records provided, and the dashboard handles all calculations and visualizations automatically through the connected pivot tables.
 Data Sheet Tab
7. Support Sheet
The Support sheet contains all the pivot tables that drive the entire dashboard. These pivot tables are connected to the Data sheet and automatically calculate the aggregated values displayed in charts and KPI cards. After updating data, users navigate to the Data tab in the Excel Ribbon and click Refresh All — this refreshes every pivot table, which in turn updates all 19 charts and 5 KPI cards across the dashboard. This sheet can be kept hidden for a cleaner user interface.
 Support Sheet Tab
Click here to Purchase Church Finance Dashboard in Excel
Advantages of Church Finance Dashboard in Excel
The Church Finance Dashboard in Excel offers several compelling advantages for churches and faith-based organizations. It provides complete financial visibility by combining income tracking, expense monitoring, fund analysis, donor insights, and trend analysis into a single file. The pivot-powered automation eliminates manual calculations — all charts update with one click. The template requires no advanced Excel skills, making it accessible to volunteers, bookkeepers, and church staff at any technical level.
The dashboard enhances financial transparency, which is essential for building trust with congregation members and donors. It supports data-driven decision-making by surfacing patterns in giving, spending, and departmental performance that might otherwise go unnoticed. And because it runs entirely in Microsoft Excel, there are no subscription costs, no software installations, and no internet dependency — making it ideal for churches of all sizes and budgets.
Opportunities for Improvement
While the Church Finance Dashboard in Excel provides a strong foundation for church financial management, there are several ways to enhance it further. Adding year-over-year comparison charts would help churches track growth trends. Integrating budget vs. actual analysis would provide variance tracking for each department and fund type. Including a member giving history page could help with personalized stewardship outreach. Adding conditional formatting with color-coded alerts for budget overruns or declining donations would provide early warning signals. You could also connect the dashboard to Power Query for automated data imports from church management software or banking systems.
Best Practices
To get the most out of your Church Finance Dashboard, follow these best practices: Update data consistently after every Sunday service or financial transaction. Use standardized names for departments, fund types, and donor categories to ensure clean pivot table results. Back up your file regularly and keep a master copy of the blank template. Share the dashboard with your finance committee using OneDrive or email for transparent reporting. Review the Monthly Trends page quarterly to identify seasonal patterns and adjust budgets accordingly. Use the slicer filters on the Overview page during board meetings to present focused financial summaries.
Explore Relevant Templates
If you found this church finance template useful, you may also be interested in these related dashboards from NextGenTemplates:
- Religious & Faith-Based Organizations Dashboard in Power BI — Advanced Power BI analytics for multi-department faith organizations with interactive drill-down capabilities.
- Religious & Faith-Based Organizations KPI Dashboard in Power BI — Track 20+ KPIs with MTD/YTD comparisons and trend analysis for faith-based institutions.
- Nonprofit Fundraising Dashboard in Excel — Comprehensive fundraising tracker for nonprofits with donor segmentation and campaign analysis.
- Personal Finance Dashboard in Excel — Track personal budgets, savings, and expense patterns with interactive charts.
Also check out the detailed blog post on Religious & Faith-Based Organizations Dashboard in Excel for more insights on using Excel dashboards for faith-based operations.
Frequently Asked Questions
What is the best Excel template for tracking church finances?
The Church Finance Dashboard in Excel from NextGenTemplates is one of the most comprehensive options available. It includes 5 interactive dashboard pages tracking income, expenses, donors, departments, fund types, and monthly trends with 19 dynamic charts and 5 KPI summary cards — all powered by pivot tables that auto-refresh with one click.
How many dashboard pages does the Church Finance Dashboard include?
The template includes 5 dashboard pages: Overview, Fund Analysis, Department Tracking, Donor Insights, and Monthly Trends. It also includes a Data sheet for entering records and a Support sheet with pivot tables that power the entire dashboard.
Do I need macros or VBA to use this church finance template?
No. The Church Finance Dashboard in Excel uses standard Excel pivot tables and charts. There are no macros or VBA scripts required. Simply enter your data, click Refresh All, and the dashboard updates automatically.
Can I track church donations by donor type and payment method?
Yes. The Donor Insights page provides 4 dedicated charts that analyze Collection % by Donor Type, Total Income by Payment Method, Total Records by Payment Method, and Total Records by Donor Type. This helps churches understand donor behavior and optimize their giving channels.
How do I update the charts after adding new financial data?
After entering new records in the Data sheet, navigate to the Data tab in the Excel Ribbon and click Refresh All. This refreshes all pivot tables on the Support sheet, which automatically updates every chart and KPI card across all 5 dashboard pages.
Is this dashboard suitable for small churches with limited budgets?
Absolutely. The dashboard runs entirely in Microsoft Excel, so there are no subscription costs or software installations needed. Whether you are a small community church or a large multi-campus ministry, this template scales to fit your needs with slicer-based filtering for focused analysis.
Conclusion
The Church Finance Dashboard in Excel is more than just a spreadsheet — it is a complete financial management system designed specifically for churches and faith-based organizations. With 5 interactive dashboard pages, 19 analytical charts, dynamic KPI cards, and pivot-powered automation, it gives church leaders the clarity and confidence they need to manage tithes, offerings, expenses, departments, donors, and monthly trends effectively. Download the template, enter your data, click Refresh All, and start making data-driven financial decisions for your church today.
Click here to Purchase Church Finance Dashboard in Excel
Visit our YouTube channel to learn step-by-step video tutorials