Convenience Store KPI Scorecard in Excel tracks 20+ store performance KPIs across 4 structured worksheets, with MTD and YTD comparisons, trend charts, and color-coded status indicators. This ready-to-use scorecard template lets store owners and retail managers compare actual performance against targets and previous year numbers in one organized Excel file. Setup takes under 10 minutes — replace the sample data and every metric recalculates automatically.
Running a convenience store means juggling inventory turnover, foot traffic, shrinkage rates, average basket size, and dozens of other metrics daily. Without a structured tracking system, store managers end up buried in spreadsheets that don’t connect. The Convenience Store KPI Scorecard in Excel solves this by organizing every metric into a single file with automated calculations, visual indicators, and trend analysis built in.
Key Features of Convenience Store KPI Scorecard in Excel
📦 Click here to Purchase Convenience Store KPI Scorecard in Excel
This scorecard template includes 4 purpose-built worksheets — Scorecard, KPI Trend, Input Data, and KPI Definition — that give you end-to-end control of convenience store performance tracking in one Excel file.
- MTD and YTD Comparisons with Visual Indicators — The Scorecard sheet displays MTD Actual, Target, and Previous Year data alongside YTD equivalents. Color-coded conditional formatting instantly flags whether each KPI is on track, at risk, or falling behind target.
- Interactive KPI Trend Analysis — Select any KPI from the dropdown on the KPI Trend sheet to view its definition, formula, unit type (Lower the Better or Upper the Better), and monthly trend charts comparing Actual vs Target vs Previous Year for both MTD and YTD periods.
- Month and Period Selector — Dropdown menus on the Scorecard sheet let you switch between any month, MTD, or YTD view instantly — no pivot tables, no slicers, no VBA required.
- Structured KPI Definition Sheet — Enter each KPI’s name, group, unit, formula, definition, and type in one centralized sheet. The KPI Trend sheet pulls this metadata automatically.
- Clean Input Data Sheet — One organized sheet for entering actual values, targets, and previous year numbers. Update monthly data and the Scorecard reflects changes immediately.
- Retail-Specific KPIs Out of the Box — Pre-loaded with convenience store metrics including sales per square foot, inventory turnover, shrinkage rate, average transaction value, customer footfall, and gross margin percentage.
Dashboard Pages Explanation
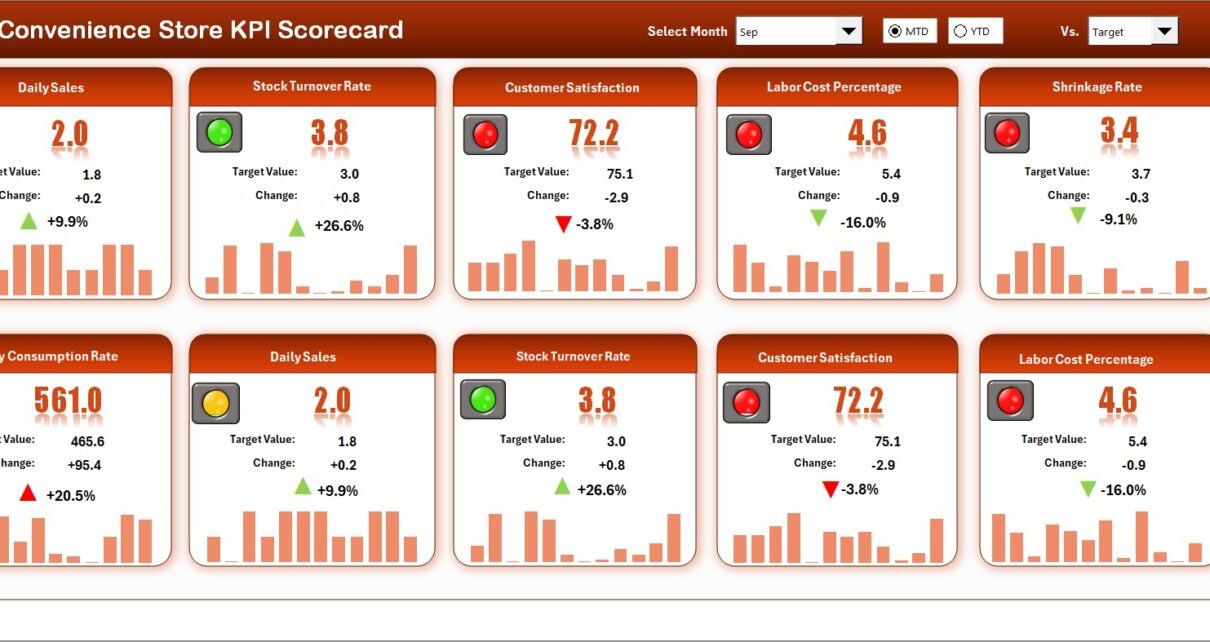
1. Scorecard Sheet
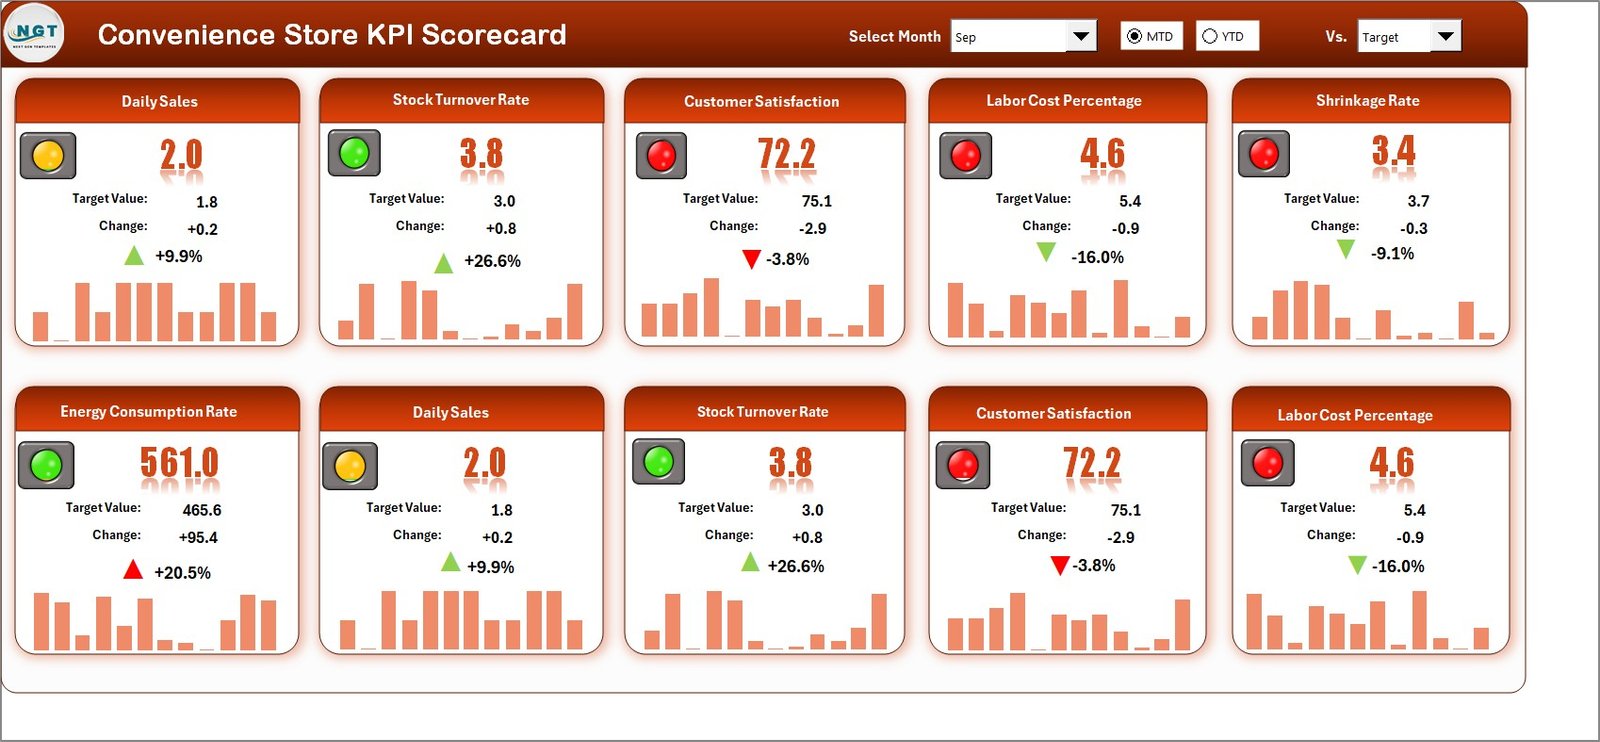
Convenience Store KPI Scorecard in Excel
The Scorecard sheet is the main interface where you can view KPI performance. Key features include dropdown menus to select the month, MTD (Month-to-Date), or YTD (Year-to-Date) for performance analysis. You can compare actual performance against targets for each KPI and quickly see performance status using color-coded visuals and conditional formatting. This sheet provides a complete KPI overview, including MTD and YTD comparisons, all in one view.
2. KPI Trend Sheet
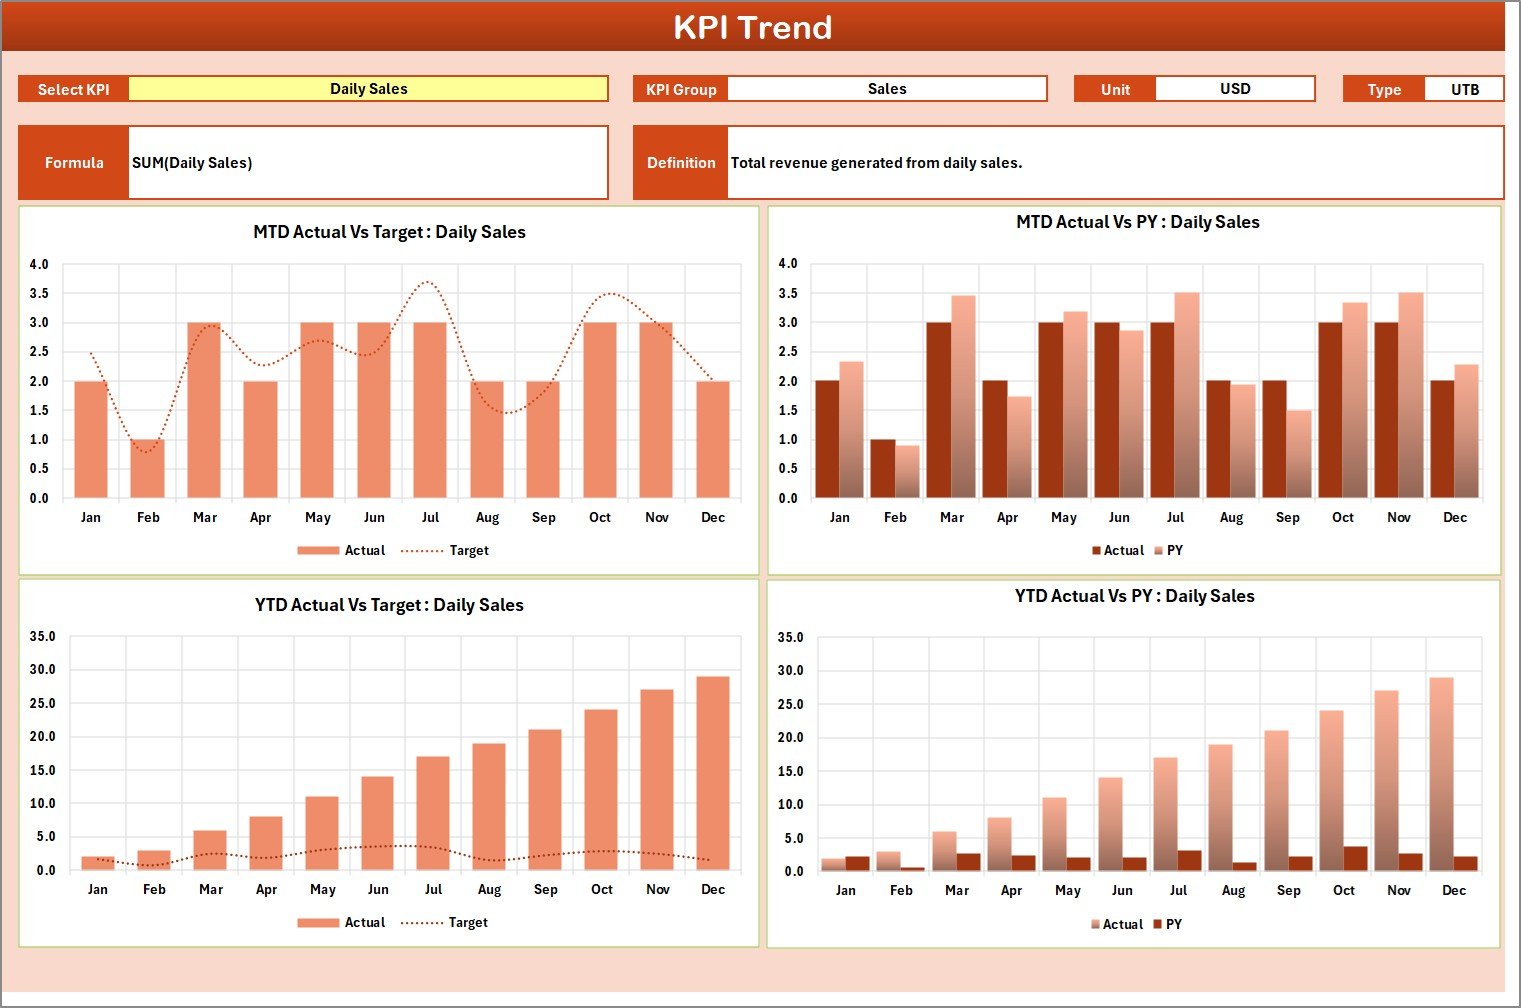
KPI Trend Sheet
On this sheet, select any KPI name from the dropdown available on range C3. The sheet displays the KPI Group, Unit of KPI, Type of KPI (Lower the Better or Upper the Better), Formula of the KPI, and Definition of the KPI. MTD and YTD trend charts for Actual, Target, and Previous Year numbers are shown side by side for quick visual comparison.
3. Input Data Sheet
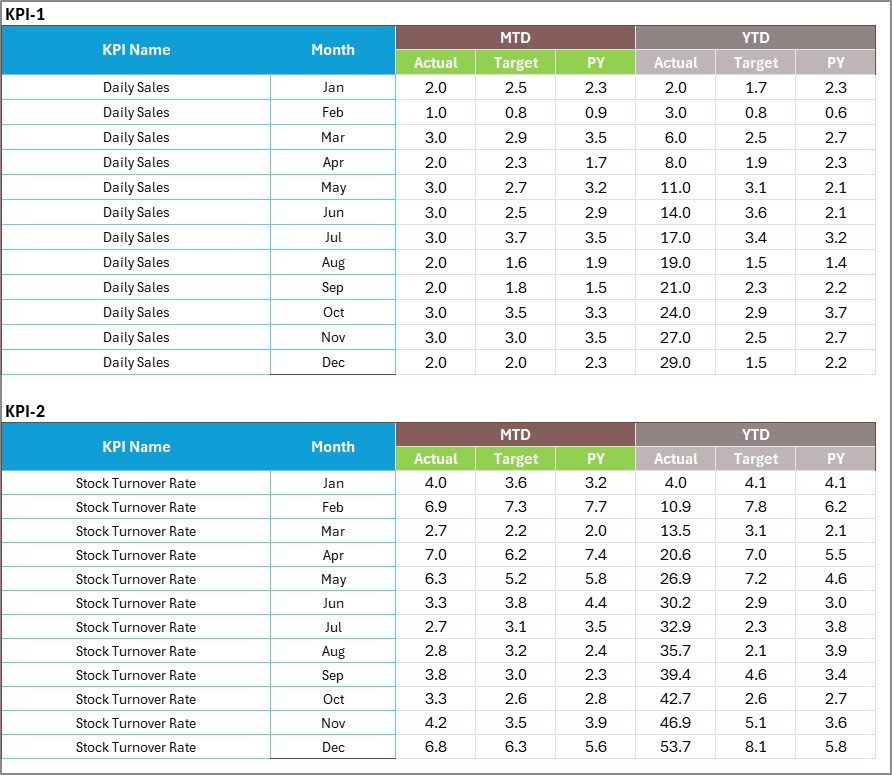
Input Data Sheet
The Input Data sheet is where you enter all KPI data. Record actual values, targets, and other metrics for each KPI here. You can easily update data as new results become available, ensuring the scorecard remains current throughout the year.
4. KPI Definition Sheet
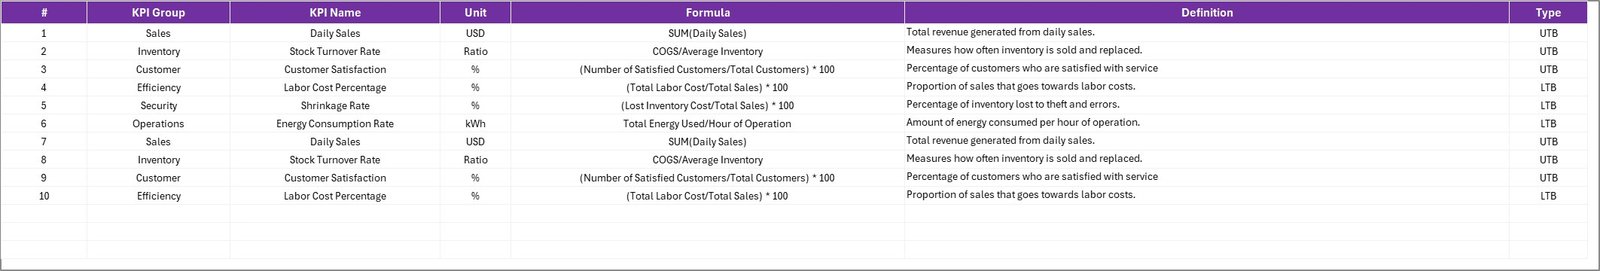
KPI Definition Sheet
In this sheet, enter the KPI Name, KPI Group, Unit, Formula, and KPI Definition. This serves as the master reference for every metric tracked in the scorecard. The KPI Trend sheet pulls directly from this sheet to display metadata alongside trend charts.
Convenience Store KPI Scorecard vs. Google Sheets Equivalent vs. Paid SaaS — Feature Comparison
| Feature | Convenience Store KPI Scorecard in Excel | Google Sheets KPI Template | Zenput / Mango (Paid SaaS) |
|---|---|---|---|
| Cost | $8.99 one-time | Free (limited) | $25–150/user/month |
| Platform | Microsoft Excel (desktop + online) | Browser-based | Cloud SaaS |
| Setup Time | Under 10 minutes | 30–60 minutes | 1–2 weeks |
| MTD/YTD Tracking | ✅ Built-in with auto-calculations | Manual formulas needed | ✅ Included |
| Trend Charts | ✅ Actual vs Target vs PY | Manual chart creation | ✅ Included |
| Customizable KPI Definitions | ✅ Full control | ✅ Full control | Limited to presets |
| Offline Access | ✅ Full offline | Limited offline | ❌ Internet required |
| Year-1 Cost (5 users) | $8.99 total | $0 | $1,500–$9,000+ |
| Data Ownership | ✅ 100% on your device | Google servers | Vendor servers |
For convenience store owners who want structured KPI tracking without paying monthly SaaS fees, the Convenience Store KPI Scorecard in Excel sits in the sweet spot between free templates that require manual work and paid platforms that cost thousands per year.
Who Should Use This Template
✅ Perfect for:
📦 Click here to Purchase Convenience Store KPI Scorecard in Excel
- Convenience store owners tracking 10–50+ locations’ monthly performance
- Retail managers who need MTD and YTD KPI comparisons for regional reporting
- Franchise operators comparing store performance against corporate benchmarks
- Small business consultants building performance reports for retail clients
❌ Not a fit if:
- You need real-time POS integration pulling live sales data automatically
- Your chain has 500+ locations requiring enterprise-level role-based access control
- You need mobile-first field inspection workflows (consider Zenput instead)
Real-World Use Cases
Ravi manages 8 convenience stores across Delhi NCR. He uses the Convenience Store KPI Scorecard in Excel to track monthly shrinkage rates, average basket size, and customer footfall across all locations. Every Monday, he updates the Input Data sheet with the previous week’s numbers, and the Scorecard instantly shows which stores are falling behind on sales per square foot — helping him allocate staff and promotions to underperforming locations.
Maria owns a single convenience store in Houston. She replaced her paper-based tracking with this scorecard to monitor gross margin, inventory turnover, and labor cost percentage. The KPI Trend sheet helps her spot seasonal patterns — she noticed her snack category margin drops every summer and adjusted her supplier contracts to fix it. Total investment: $8.99 instead of $200/month for a retail analytics platform.
James works as a regional manager for a franchise chain. He downloads each store’s monthly data into separate copies of the scorecard, then uses the YTD view to create quarterly performance reviews for corporate. The color-coded indicators make it easy to highlight which KPIs need attention without building PowerPoint slides from scratch.
Advantages of Convenience Store KPI Scorecard in Excel
📦 Click here to Purchase Convenience Store KPI Scorecard in Excel
- One-time cost of $8.99 replaces ongoing SaaS subscriptions that charge per user per month
- No learning curve — if you can use Excel, you can use this scorecard within minutes
- Full data ownership — your store performance data stays on your device, not on a vendor’s cloud server
- Works offline — update KPIs from any location without needing internet access
- Completely customizable — add, remove, or rename KPIs to match your store’s specific operations
- Previous Year comparison — track year-over-year trends that most free templates don’t include
Opportunities for Improvement
- The template does not connect to POS systems — data entry is manual, which adds 15–20 minutes of work per update cycle
- Multi-store tracking requires separate file copies for each location, which can get unwieldy above 15–20 stores
- No built-in alerts or notifications — you need to open the file to check status rather than receiving automated flags
- Chart formatting is fixed — changing the visual style of trend charts requires basic Excel charting knowledge
Best Practices
- Update weekly or monthly — set a recurring calendar reminder to enter data consistently. Gaps in the Input Data sheet break trend analysis.
- Start with the KPI Definition sheet — before entering any numbers, customize the KPI names, groups, and formulas to match your store’s actual operations.
- Use the LTB/UTB designation correctly — mark cost-related KPIs (shrinkage, waste, labor cost %) as “Lower the Better” and revenue KPIs (sales, margin, footfall) as “Upper the Better” so the color coding works properly.
- Compare against realistic targets — set targets based on your previous year’s actuals plus a 5–10% growth factor rather than arbitrary round numbers.
- Back up monthly — save a dated copy (e.g., “Scorecard_Jan2026.xlsx”) each month so you have a clean historical archive.
Explore Relevant Templates
If you found this Convenience Store KPI Scorecard useful, explore these related templates on NextGenTemplates:
- Bakery KPI Scorecard in Excel — Same scorecard structure adapted for bakery and food service operations with baking-specific KPIs.
- Meal Prep Business KPI Scorecard in Excel — Track meal prep operations including order fulfillment, ingredient waste, and customer retention.
- Distribution KPI Scorecard in Google Sheets — Similar scorecard format for supply chain and distribution tracking in Google Sheets.
Also check out the full Convenience Stores Dashboard in Excel for a multi-page dashboard version with more detailed analytics and charts.
Browse all KPI Dashboard Templates on NextGenTemplates for 200+ industry-specific options.
Frequently Asked Questions
📦 Click here to Purchase Convenience Store KPI Scorecard in Excel
What KPIs does the Convenience Store KPI Scorecard track?
The Convenience Store KPI Scorecard in Excel tracks 20+ retail metrics including sales per square foot, inventory turnover, shrinkage rate, average transaction value, customer footfall, gross margin percentage, and labor cost ratio. All KPIs auto-calculate when you enter data.
How long does it take to set up the scorecard?
Setup takes under 10 minutes. Open the file, customize KPI definitions on the KPI Definition sheet, enter your store’s actual and target numbers on the Input Data sheet, and the Scorecard updates automatically with MTD and YTD comparisons.
Can I add custom KPIs to the scorecard?
Yes. The KPI Definition sheet lets you add, remove, or rename any KPI. Enter the KPI name, group, unit, formula, and definition — the Scorecard and KPI Trend sheets pull from this master list automatically.
Does this work with Google Sheets?
This template is built for Microsoft Excel. For a Google Sheets version, check the Google Sheets Dashboard collection on NextGenTemplates for similar KPI tracking templates optimized for Google’s platform.
How does this compare to paid retail analytics software like Zenput?
The Convenience Store KPI Scorecard costs $8.99 one-time versus $25–150 per user per month for platforms like Zenput or Mango. The tradeoff: SaaS tools offer real-time POS integration and mobile inspection workflows, while this Excel scorecard gives you full customization and offline access at a fraction of the cost.
Can I track multiple store locations?
Each file tracks one location. For multi-store tracking, create separate copies for each store and use the same KPI definitions across all copies for consistent comparisons. This works well for up to 15–20 locations.
What Excel version do I need?
The Convenience Store KPI Scorecard works with Microsoft Excel 2016 and later, including Excel for Microsoft 365. It uses standard formulas and conditional formatting — no VBA macros or add-ins required.
About the Author
Built by PK — Microsoft Certified Professional with 15+ years of Excel, Google Sheets, and Power BI experience. Founder of NextGenTemplates, reaching 300K+ subscribers across YouTube channels (@PK-AnExcelExpert, @NextGenTemplates, @NeoTechNavigators). Every template is hand-built and tested before release.
Conclusion
The Convenience Store KPI Scorecard in Excel gives store owners and retail managers a structured, ready-to-use system for tracking monthly performance against targets and previous year benchmarks. With 4 purpose-built worksheets, automated MTD/YTD calculations, and visual trend analysis, it replaces manual tracking without the ongoing cost of SaaS platforms.
📦 Click here to Purchase Convenience Store KPI Scorecard in Excel
✅ Instant download · One-time payment · No subscription
👉 Visit our YouTube channel for step-by-step video tutorials: Youtube.com/@PK-AnExcelExpert
For more Excel and data analysis tutorials, visit Microsoft Learn — Excel Documentation.