The global film and television industry generated over $250 billion in revenue in 2023, yet most production companies, media analysts, and entertainment operations teams still rely on ad-hoc spreadsheets or expensive SaaS platforms to track performance. The Film & Television Report in Excel bridges that gap — delivering a structured, 4-sheet Excel report with 5 KPI cards, 5 pre-built interactive charts, dual-slicer filtering, and a detailed row-level Information Table. Setup takes under 10 minutes, and there are no recurring costs.
In this article, we walk through every feature of this template, explain how to use it, and show you why it outperforms expensive media analytics SaaS tools for most film and TV reporting needs.
👉 Click here to Purchase the Film & Television Report in Excel — Instant download · One-time payment · No subscription
Key Features of Film & Television Report in Excel
This Excel Report is built around four structured sheets that together give producers, analysts, and media operations teams a full picture of film and TV performance across regions, platforms, and time.
The Summary Page is the analytical core. It features 5 KPI cards at the top — covering total released films, total budget, total revenue, average rating, and platform distribution — alongside a right-side interactive slicer panel. The slicer filters all 5 charts simultaneously, allowing you to drill into a specific region, platform, or production status in a single click.
The Report Page provides a row-level analytical view. A left-side slicer controls the detailed Information Table, which displays individual film and TV show records including title, region, platform, budget, revenue, postproduction status, and rating. This page is ideal for team presentations and stakeholder Q&A sessions.
The Data Sheet is where you enter your own records. Replace the sample data with your actual film and TV production figures, and every chart, card, and table across all pages updates automatically — no formula editing required. The Support Sheet maintains pre-configured dropdown lists for platforms, regions, and production stages, ensuring consistent data entry and preventing input errors.
Dashboard Pages Explanation
Page 1 – Summary Page
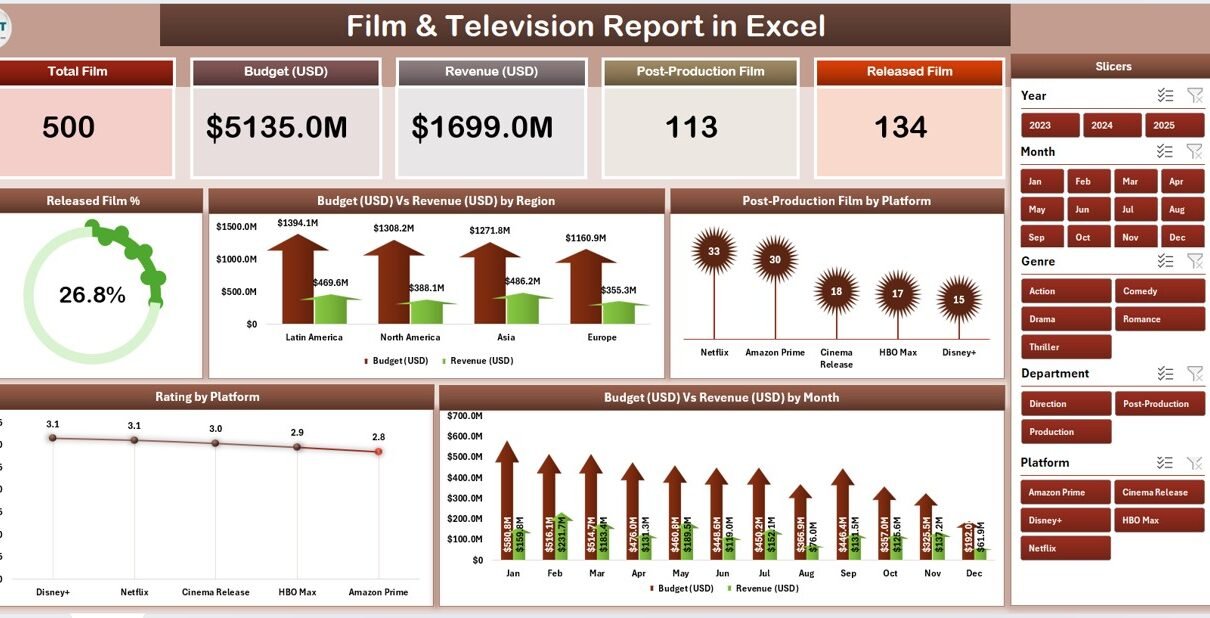
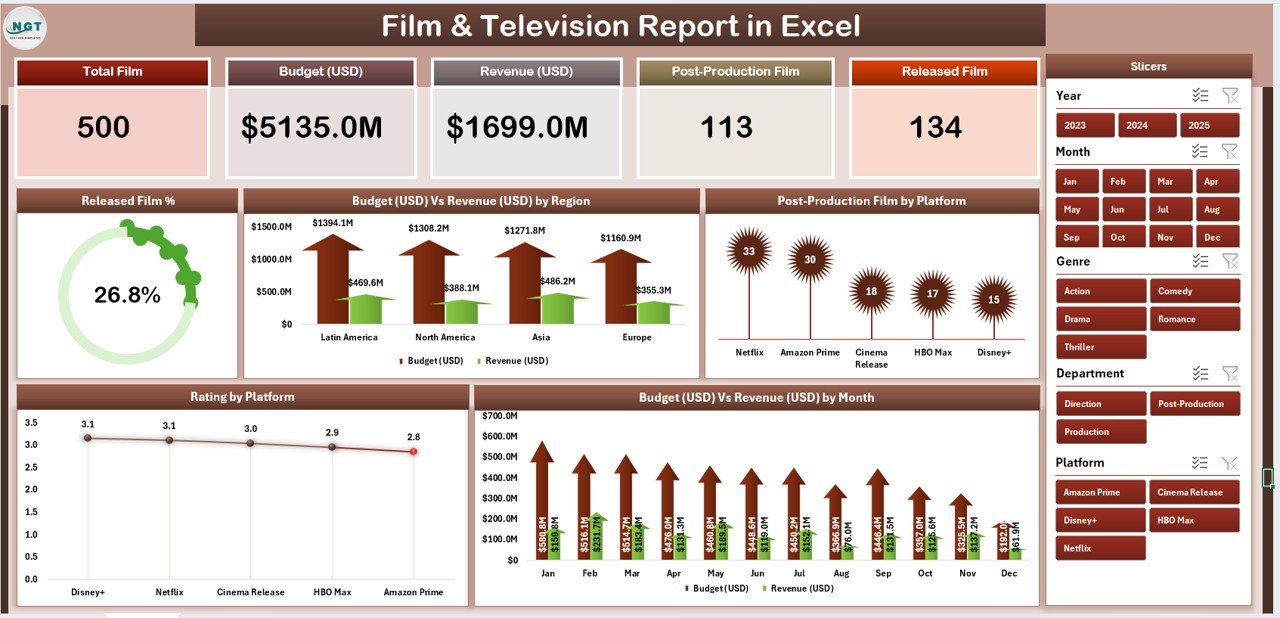
The Summary Page is the primary reporting view. Five KPI cards across the top provide instant metric snapshots: Released Films Count, Total Budget, Total Revenue, Average Rating, and Platform Count. Below the cards, five pre-built charts display the full analytics picture:
- Released Film % — A percentage breakdown of films by release status or genre, showing the proportion each category contributes to the total portfolio.
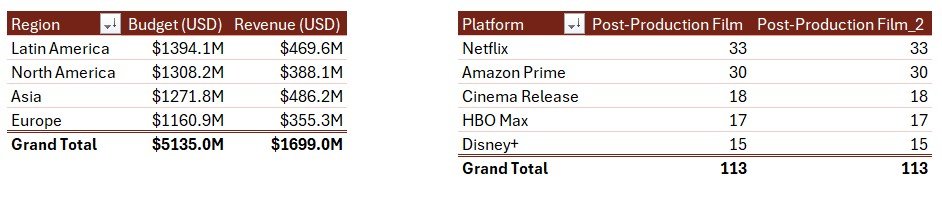
- Budget vs Revenue by Region — A clustered chart comparing production budget against revenue generated across geographic regions — essential for understanding which markets deliver the best returns.
- Postproduction Film by Platform — Platform-wise breakdown of films currently in postproduction, giving acquisition and operations teams visibility into pipeline health across streaming, broadcast, and theatrical channels.
- Rating by Platform — Average audience and critic ratings by platform, highlighting which distribution channels drive the highest-rated content.
- Budget vs Revenue by Month — A monthly trend view comparing budget spend against revenue, identifying seasonal patterns and peak performance windows.
The right-side slicer lets you filter all five charts at once by platform, region, or any other tracked dimension — no need to update charts individually.
Summary Page — 5 KPI Cards, 5 Charts, Right-Side Slicer
Page 2 – Report Page
The Report Page is built for detailed, row-level analysis. A left-side slicer filters the Information Table dynamically, letting you narrow down to a specific platform, region, or production stage. The Information Table displays all tracked fields for each film or TV show — title, region, platform, budget, revenue, postproduction status, and rating — in a clean, presentation-ready format. This page is particularly useful for weekly or monthly stakeholder reporting and for answering specific questions about individual titles during team reviews.
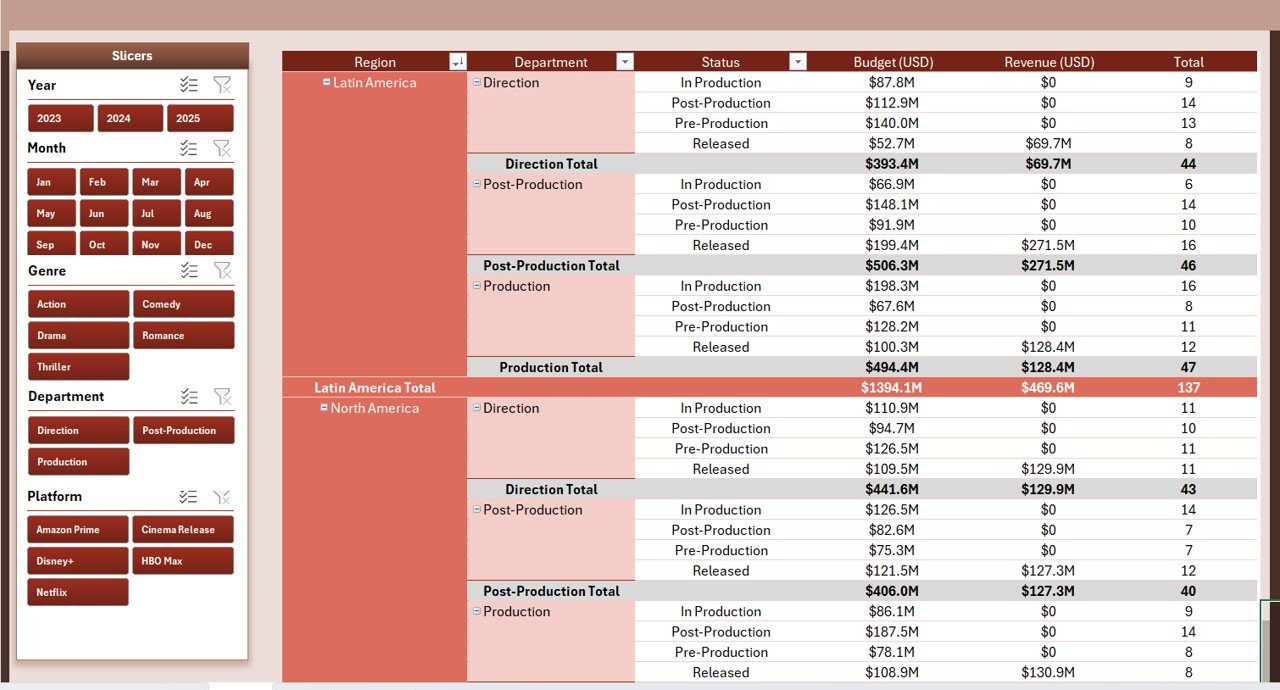
Report Page — Left Slicer and Information Table
Data Sheet
The Data Sheet is the engine of the template. It uses a structured table format where each row represents one film or TV show. Fields include title, region, platform, budget, revenue, production stage, and rating. When you populate this sheet with your real data, all charts, KPI cards, and the Information Table across the Summary and Report pages update automatically. You can add as many rows as needed — the template scales with your dataset.
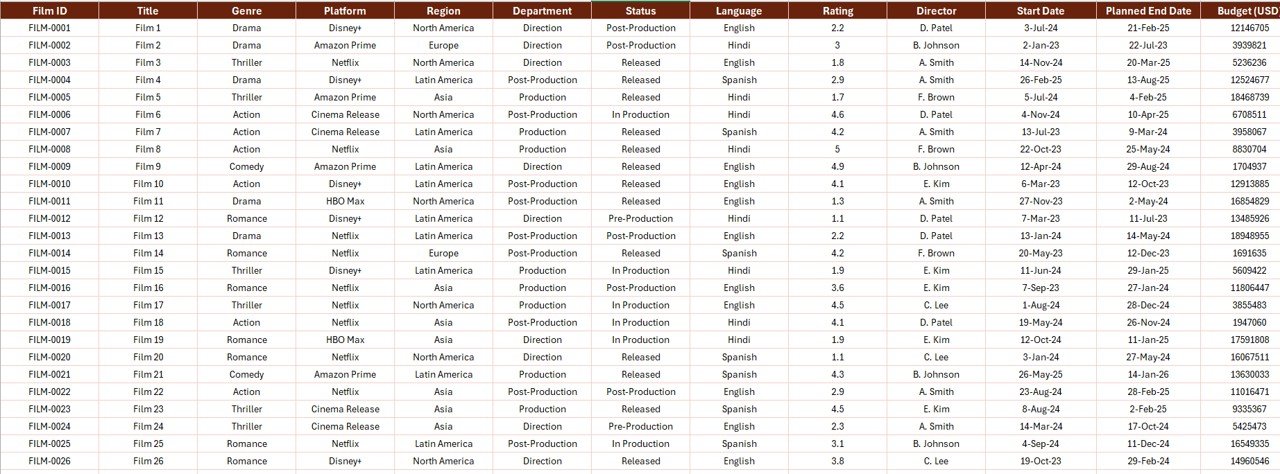
Data Sheet — Central Data Entry for All Report Pages
Support Sheet
The Support Sheet maintains the reference tables that power dropdowns in the Data Sheet. Platform names, regional categories, and production stage values are all stored here. Keeping these lists centralised means updates are immediate and consistent — change a platform name once in the Support Sheet and it updates everywhere.
Support Sheet — Reference Lists for Consistent Data Entry
Film & Television Report in Excel vs. Google Sheets vs. Paid Media Analytics SaaS — Feature Comparison
| Feature | Film & TV Report in Excel | Google Sheets Version | Paid SaaS (Tableau / Looker) |
|---|---|---|---|
| Cost | $7.99 one-time | Varies | $70–$150/user/month |
| Works offline | ✅ Yes | ❌ Requires internet | ❌ Cloud-only |
| Setup time | ✅ Under 10 minutes | Similar | 2–4 weeks + training |
| Interactive slicers | ✅ Dual slicers | Limited | ✅ Advanced filters |
| 5 pre-built charts | ✅ Ready to use | Varies | Custom build required |
| Customisable fields | ✅ Fully editable | ✅ Editable | Requires admin config |
| Data privacy | ✅ Local file, no cloud upload | Stored in Google Drive | Vendor cloud |
| Year-1 cost (5 users) | $7.99 total | ~$30–50 | $4,200–$9,000 |
| No subscription | ✅ One-time payment | ✅ | ❌ Monthly recurring |
For media teams who want structured film and TV analytics without the SaaS overhead, the Film & Television Report in Excel is the practical, cost-effective choice.
Who Should Use This Template
✅ Perfect for:
- Film producers and production managers tracking multi-project budget vs. revenue performance
- Media analysts reporting on platform and regional performance for film and television portfolios
- Entertainment operations and finance teams replacing manual spreadsheets with a structured reporting tool
- Students and researchers analysing film industry economics and platform trends in Excel
- Freelance consultants building film and TV performance reports for clients
❌ Not a fit if:
- You need live API connections to box office databases, streaming platforms, or CRM systems
- Your studio requires enterprise-grade data governance, SOC 2 compliance, or SSO authentication
- You prefer browser-based collaboration — consider the Media and Entertainment Dashboard in Google Sheets instead
Real-World Use Cases
Marcus manages operations at a regional film production house with five active projects. Each month he collects budget actuals and revenue figures from his project leads, pastes them into the Data Sheet, and within minutes the Summary Page shows him Budget vs Revenue by Region and Budget vs Revenue by Month side by side. He takes the Summary Page screenshot directly into his board deck — no Tableau licence needed, no per-seat fees.
Priya is a media analyst at an OTT studio tracking 30+ titles across three streaming platforms. She uses the Rating by Platform and Postproduction Film by Platform charts to identify which platform’s titles are underperforming in ratings relative to their production budgets. The left-side slicer on the Report Page lets her filter by platform and show individual title-level data during weekly editorial reviews.
Diego lectures in entertainment business strategy at a media arts college. He distributes this template to students with a populated Data Sheet containing real historical box office data. Students use the slicer on the Summary Page to explore how regional markets and platform types correlate with Budget vs Revenue ratios — making the analytics concepts concrete and interactive without requiring any data science tools or subscription software. According to Microsoft’s Excel documentation, Excel pivot-based charts and slicers are fully supported in Excel 2016 through Microsoft 365, which covers the majority of institutional and corporate installations.
Advantages of Film & Television Report in Excel
The biggest advantage is the combination of structured layout and zero ongoing cost. Unlike media analytics platforms that charge $70–$150 per user per month, this template is a one-time $7.99 purchase with lifetime access. The dual-slicer design — right-side on the Summary Page, left-side on the Report Page — means users can filter charts and tables independently for different analytical purposes without disrupting the overall report structure.
The template also offers data portability and privacy. All data lives in your local Excel file. Nothing is uploaded to a third-party cloud, which matters significantly in film production environments where pre-release financial data and title information are commercially sensitive.
For teams comparing this to our Film & Television Dashboard in Power BI, the key distinction is platform: the Power BI version offers larger dataset support and cross-report interactivity, while the Excel version is self-contained, works offline, and requires no additional Microsoft licences beyond Excel itself. Both are built and tested by PK, a Microsoft Certified Professional.
Opportunities for Improvement
The template currently works best as a periodic reporting tool (weekly, monthly) rather than a real-time live dashboard. If your team needs data to refresh automatically from a connected source (box office API, streaming platform data export), you would need to extend the Data Sheet with a Power Query connection — something achievable in Excel but beyond the out-of-the-box setup. Additionally, for organisations tracking 500+ titles across many regions and platforms, upgrading to the Media and Entertainment Dashboard in Power BI would provide more scalable data modelling and cross-filter performance.
Best Practices
- Keep the Support Sheet updated — Add new platforms or regions there first before entering records in the Data Sheet. This ensures dropdown consistency.
- Use consistent naming in the Data Sheet — Platform names must match exactly between the Data Sheet and Support Sheet for the charts and slicers to group them correctly.
- Back up your file before doing bulk data updates. Excel’s local file format means there’s no version history unless you save copies or use OneDrive with AutoSave.
- Refresh pivot connections after major data updates using Excel’s Data → Refresh All command to ensure all charts reflect the latest figures.
- Use the Report Page for stakeholder exports — Copy the Information Table to a new sheet when you need to share a specific filtered view without exposing the full dataset.
Explore Relevant Templates
If you’re building a film and media analytics stack in Excel, Power BI, or Google Sheets, these related templates from NextGenTemplates will complement the Film & Television Report:
- 🎬 Film & Television Dashboard in Power BI — Advanced multi-page dashboard for film industry analytics with large dataset support
- 🎞️ Film Production Houses KPI Dashboard in Excel — KPI-focused Excel dashboard for production house performance management
- 📊 Media & Entertainment KPI Dashboard in Excel — Comprehensive KPI tracking across the broader media and entertainment sector
- 📱 Media and Entertainment Dashboard in Google Sheets — Cloud-based Google Sheets version for remote and collaborative teams
Frequently Asked Questions
What does the Film & Television Report in Excel track?
The Film & Television Report in Excel tracks budget, revenue, ratings, platform distribution, and postproduction status across individual film and TV titles. It visualises this data across 5 KPI cards and 5 pre-built charts on the Summary Page, and displays row-level records in the Information Table on the Report Page.
How many sheets does the template include?
The template includes 4 sheets: Summary Page (KPI cards, charts, right-side slicer), Report Page (left-side slicer, Information Table), Data Sheet (data entry), and Support Sheet (dropdown reference lists). All sheets are interconnected — update the Data Sheet and everything else refreshes automatically.
Does this Excel report require macros or add-ins?
No macros or add-ins are required. The Film & Television Report in Excel uses native Excel features — pivot charts, slicers, and structured tables — compatible with Microsoft Excel 2016 through Microsoft 365 on both Windows and Mac without any additional installations.
Can I customise the chart types or add new KPI cards?
Yes — the template is fully editable. Chart types can be changed directly in Excel’s chart settings, and new KPI cards can be added by extending the pivot-based formulas on the Summary Page. The Data Sheet fields can also be expanded to include additional metrics specific to your production workflow.
How does this compare to Tableau or Looker for film analytics reporting?
Tableau and Looker start at $70–$150 per user per month and require weeks of setup and configuration. The Film & Television Report in Excel costs $7.99 as a one-time download, works offline, and is operational in under 10 minutes — making it the practical choice for individual analysts and small media teams.
Is there a Power BI version of this report?
Yes — for a more interactive Power BI experience, explore our Film & Television Dashboard in Power BI. The Power BI version supports larger datasets, cross-report filtering, and publishing to Power BI Service for team sharing. The Excel version is better for offline use and teams without Power BI licences.
What Excel version is needed to run this template?
The template requires Microsoft Excel 2016 or later (including Excel 2019, 2021, and Microsoft 365). Slicers and pivot-based charts work on both Windows and Mac in Excel Desktop. Excel for Web (browser) may have limited slicer functionality — desktop is recommended for the full experience.
About the Author
Built by PK — Microsoft Certified Professional with 15+ years of Excel, Google Sheets, and Power BI experience. Founder of NextGenTemplates, reaching 300K+ subscribers across YouTube channels. Every template is hand-built and tested before release. Visit YouTube.com/@PK-AnExcelExpert for step-by-step video tutorials on Excel reporting and dashboards.
Conclusion
The Film & Television Report in Excel gives media teams, producers, and analysts a structured, zero-subscription reporting solution for tracking film and TV performance across budgets, revenues, platforms, and regions. With 5 KPI cards, 5 interactive charts, dual slicers, and a detailed Information Table — all linked to a simple Data Sheet — it replaces hours of manual Excel work with a clean, ready-to-present report format.
👉 Click here to Purchase the Film & Television Report in Excel
✅ Instant download · One-time payment · No subscription · Lifetime access
📅 Last updated: May 2026