Angel investors globally deploy over $25 billion annually across 60,000+ startup deals in the United States alone — yet the majority of angel networks still rely on disconnected spreadsheets and manual email threads to manage deal flow, track portfolio returns, and report to limited partners. According to the Angel Capital Association, the average angel network evaluates 40+ deals per year but lacks a unified analytics layer to identify which sectors, regions, or funding stages consistently deliver the best outcomes. The Business Angel Networks Dashboard in Power BI solves this problem with a single .pbix file that consolidates your entire investment operation into 5 interactive, cross-filterable analytics pages.
This Power BI dashboard tracks 5 high-level KPIs, delivers 20+ purpose-built visuals, and connects directly to your existing deal data in Excel or CSV format. Whether you manage a 10-deal personal portfolio or a 200-deal angel syndicate, the Business Angel Networks Dashboard in Power BI gives you the geographic concentration analysis, portfolio performance benchmarking, and deal flow visibility that previously required expensive SaaS tools like Carta or Visible Capital.
👉 Click here to Purchase the Business Angel Networks Dashboard in Power BI
Key Features of the Business Angel Networks Dashboard in Power BI
The Business Angel Networks Dashboard in Power BI is built around the specific analytics needs of angel network managers, independent angels, and early-stage fund managers — not generic business intelligence templates repurposed for investment use. Here are the features that set it apart:
- 5 fully-interactive dashboard pages — Overview, Deal Flow, Portfolio Performance, Network Analysis, and Geographic Analysis, each answering a distinct investment question with purpose-built visuals.
- 5 headline KPI cards — Total Deals, Total Investment, Total Post-Money Valuation, Avg Returns Multiple, and Total Mentorship Hours, updating in real-time as slicers are applied.
- 20+ DAX-powered visuals — investment trend lines, success rate gauges, exit rate analysis, returns multiples by funding stage and sector, investor type distribution, and geographic breakdowns.
- Multi-dimensional slicers — filter simultaneously by sector, region, funding stage, investor type, and deal status for instant targeted portfolio insights.
- Free Power BI Desktop compatible — no Power BI Pro subscription required for local use; publish to Power BI Service only when team sharing is needed.
- Realistic sample data pre-loaded — start analyzing immediately; replace with your own deal data in under 10 minutes by connecting your existing Excel or CSV source.
Dashboard Pages Explanation
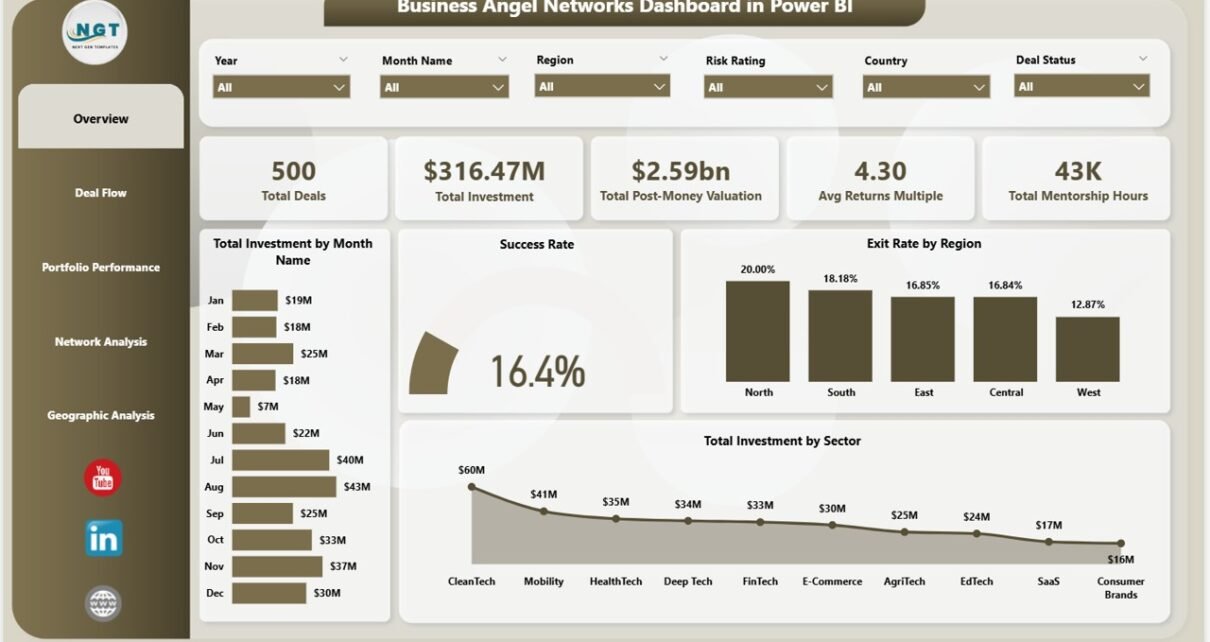
Page 1 — Overview
The Overview page is the command center of the Business Angel Networks Dashboard in Power BI, displaying 5 KPI cards at the top: Total Deals (the count of all investment deals in the portfolio), Total Investment (aggregate capital deployed in USD), Total Post-Money Valuation (combined post-investment valuation across all portfolio companies), Avg Returns Multiple (portfolio-wide average return on investment expressed as a multiple), and Total Mentorship Hours (total advisory hours contributed by network members to portfolio companies).
Below the KPI cards, four charts provide macro-level analysis: Total Investment by Month Name reveals investment pacing trends throughout the year, helping identify seasonal deployment patterns. Success Rate gauge shows the percentage of deals meeting or exceeding target return thresholds. Exit Rate by Region benchmarks exit performance across geographic markets. Total Investment by Sector maps capital concentration across technology, healthcare, fintech, and other industry verticals. Every chart on the Overview page responds to multi-dimensional slicers, making it a true command-and-filter hub for the dashboard.
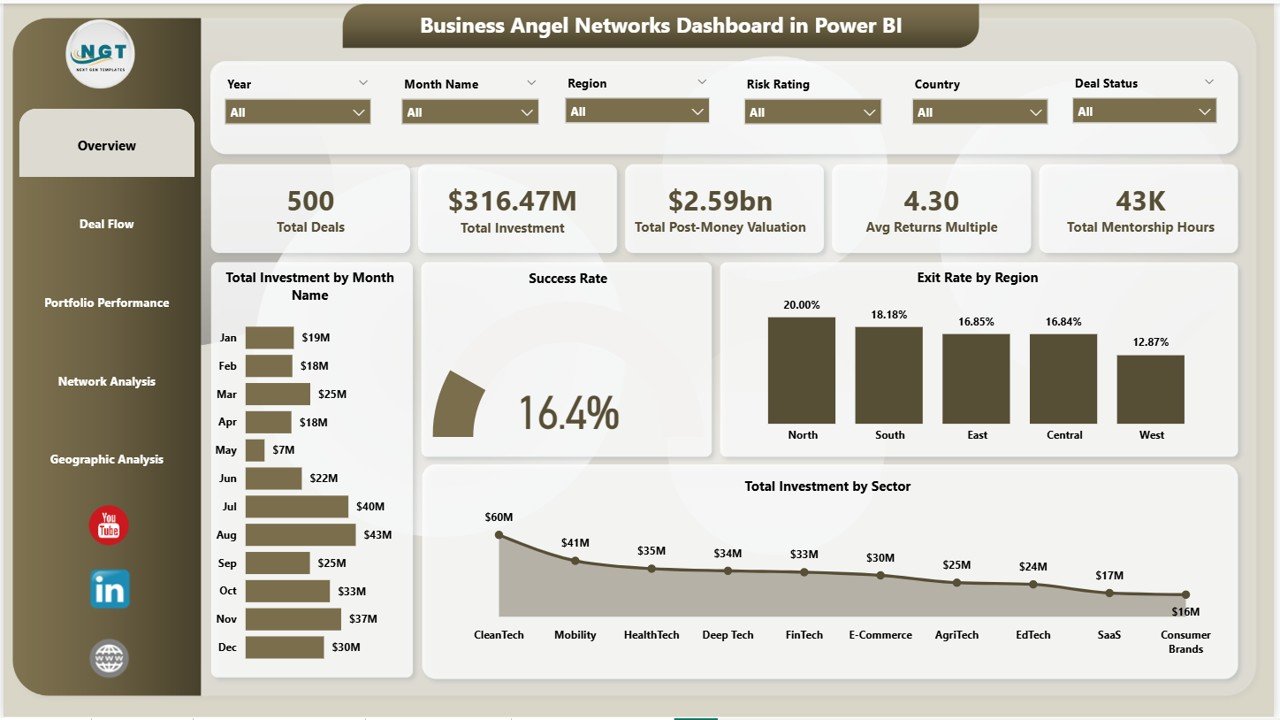
Business Angel Networks Dashboard in Power BI — Overview Page
Page 2 — Deal Flow
The Deal Flow page breaks down the pipeline and investment activity across structural dimensions of the portfolio. Total Deals by Sector shows deal count concentration across industry categories, helping network managers identify which sectors attract the most pitches versus which convert to funded deals. Success Rate by Region compares deal success rates across geographic markets, flagging which regions consistently produce better-quality deal flow. Total Investment by Funding Stage maps capital allocation across Pre-Seed, Seed, Series A, and later stages — critical for understanding if the network’s strategy aligns with its actual deployment. Total Investment by Industry provides a sub-sector lens, going deeper than the sector view to reveal emerging concentration opportunities or risks.
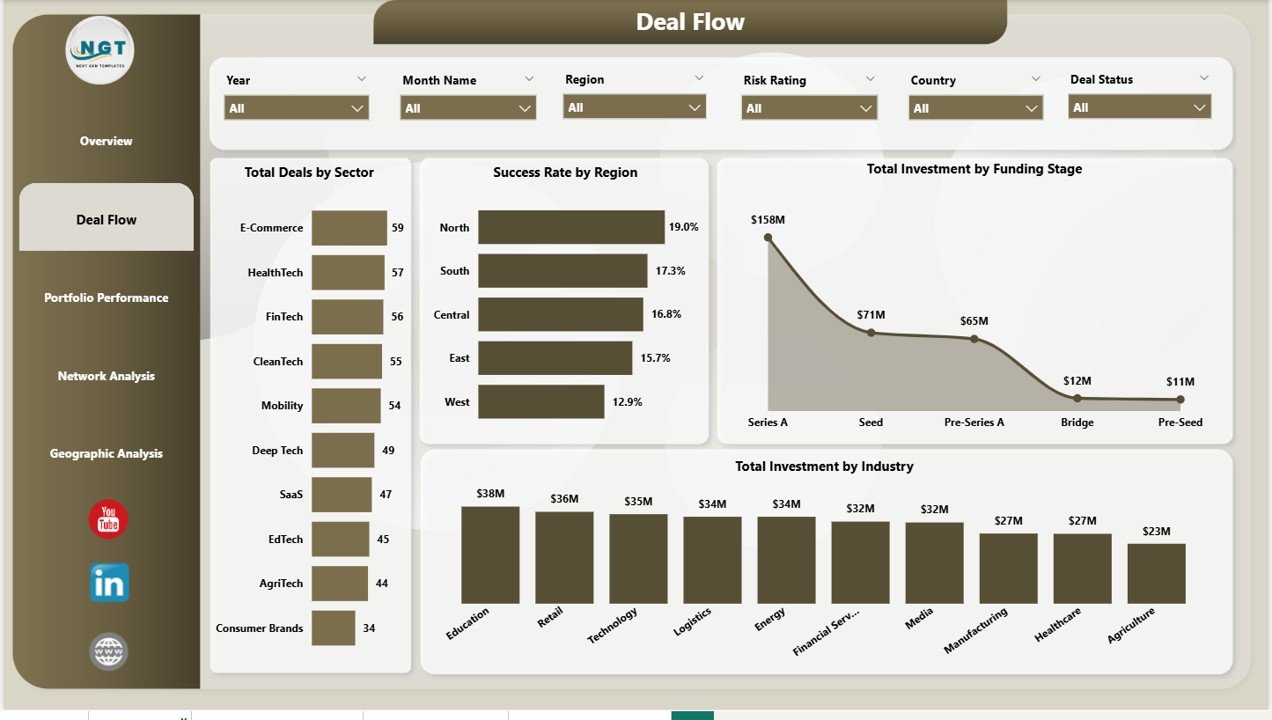
Business Angel Networks Dashboard in Power BI — Deal Flow Page
Page 3 — Portfolio Performance
The Portfolio Performance page focuses on return generation and deal quality across the portfolio’s structural dimensions. Avg Returns Multiple by Funding Stage answers one of the most important questions in early-stage investing: which stages generate the best multiples — Pre-Seed bets or later-stage, lower-risk Series A entries? Avg Returns Multiple by Sector benchmarks return performance across industry verticals, helping network managers double down on sectors with proven return profiles. Total Deals by Region maps deal count across geographic markets, providing the denominator for calculating region-level success and returns rates. Together these three visuals give portfolio managers the data needed for evidence-based investment thesis refinement.
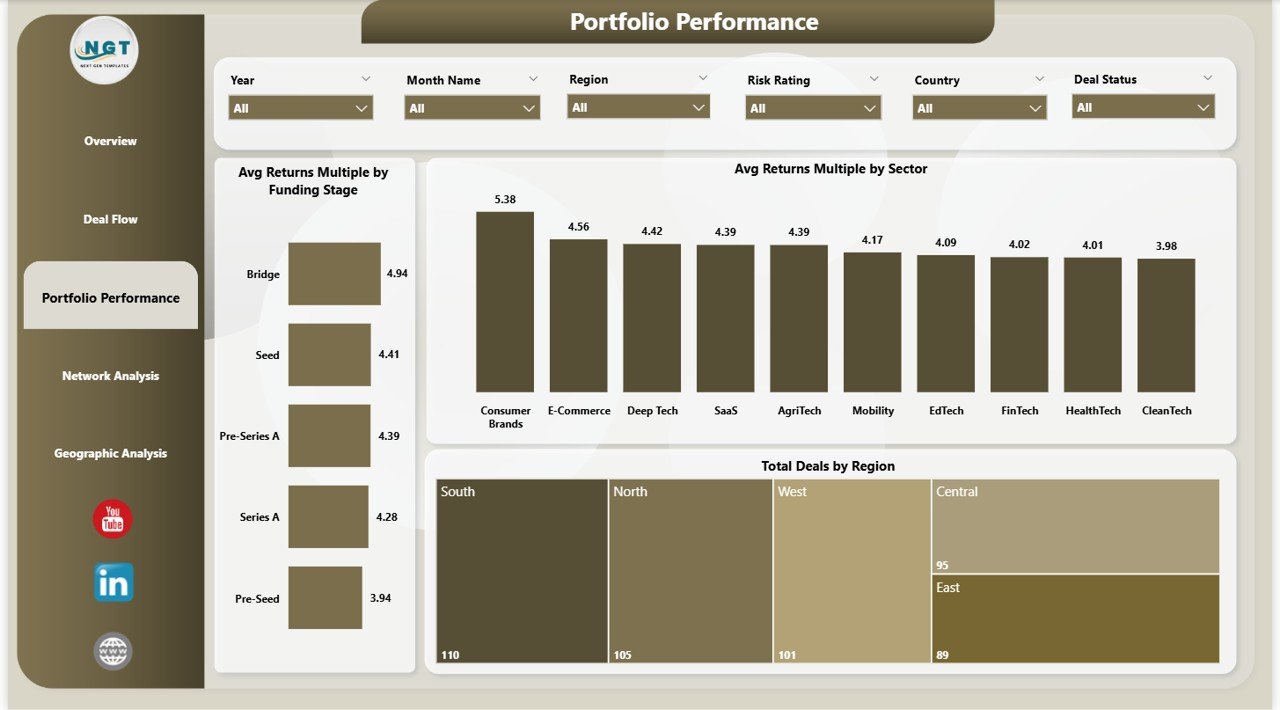
Business Angel Networks Dashboard in Power BI — Portfolio Performance Page
Page 4 — Network Analysis
The Network Analysis page examines the composition and dynamics of the investment network itself. Total Investment by Investor Type distinguishes capital deployed by individual angels, syndicates, corporate angels, and family office participants — showing which investor categories drive the most deal activity. Avg Returns Multiple by Sector appears here in the context of network composition, enabling cross-referencing between investor type and sector performance to identify which investor categories make the best sector bets. Total Investment by Deal Status tracks the pipeline distribution across Active, Exited, Written Off, and other deal statuses — a critical health metric showing how much of the portfolio is generating liquidity events versus remaining unrealized.
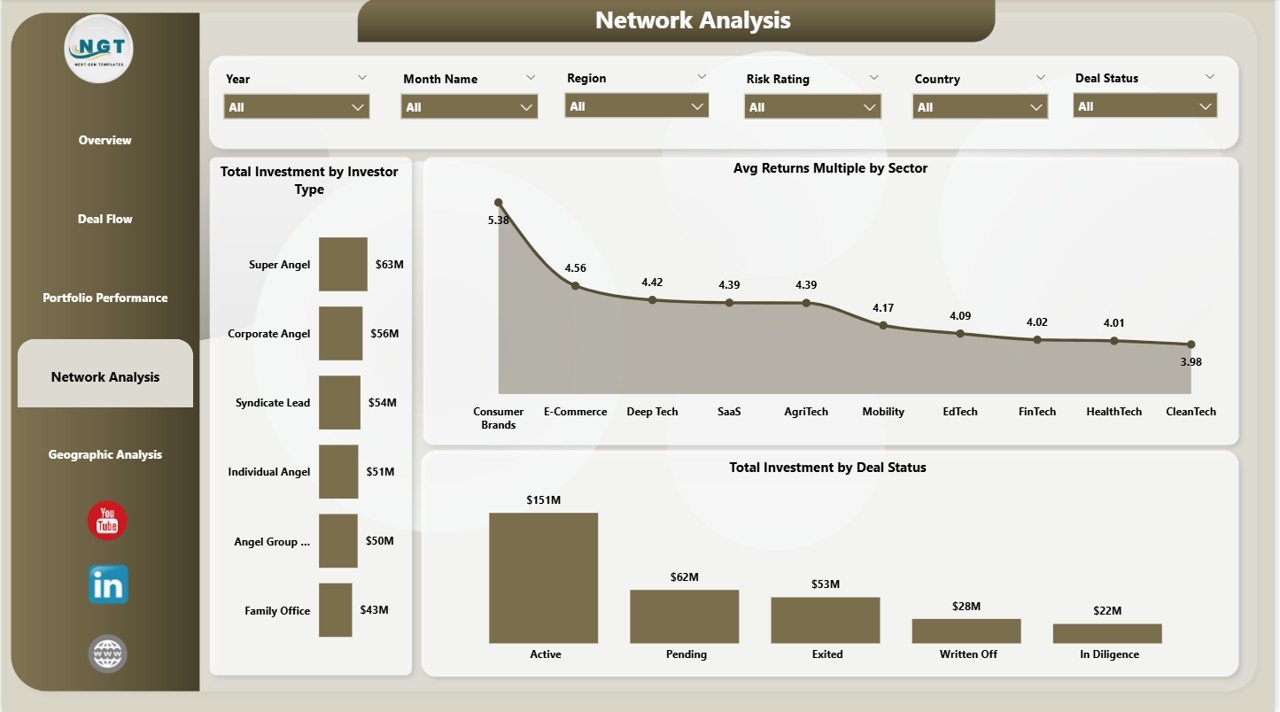
Business Angel Networks Dashboard in Power BI — Network Analysis Page
Page 5 — Geographic Analysis
The Geographic Analysis page provides a full map of investment activity and returns across the world. Avg Returns Multiple by Region benchmarks return performance across major geographic markets (North America, Europe, Asia-Pacific, etc.), enabling data-driven decisions about which regions to prioritize for future deal sourcing. Total Investment by Region quantifies capital deployment by region, revealing geographic concentration risks or diversification opportunities. Total Investment by Country drills down to the country level, critical for angel networks with a global mandate managing deals across multiple jurisdictions and regulatory environments. Cross-referencing all three visuals with the slicer panel gives fund managers a complete geographic intelligence layer.
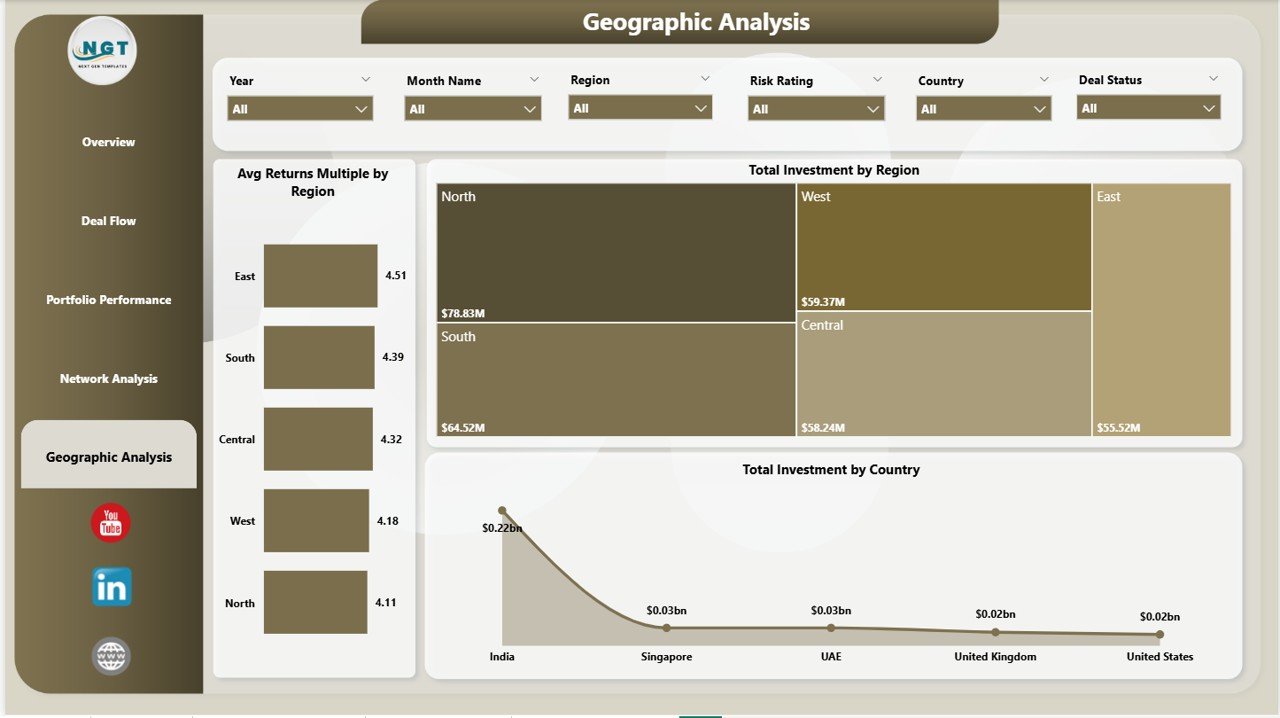
Business Angel Networks Dashboard in Power BI — Geographic Analysis Page
Business Angel Networks Dashboard in Power BI vs. Tableau vs. Paid Portfolio SaaS — Feature Comparison
| Feature | Business Angel Networks Dashboard in Power BI | Tableau Desktop | Visible Capital / Carta |
|---|---|---|---|
| Cost | $17.99 one-time | $70–$75 / user / month | $500–$2,000 / year |
| Platform | Power BI Desktop (free) | Tableau Desktop required | Web-only SaaS |
| Setup time | Under 10 minutes | 2–8 hours build time | 2–5 days onboarding |
| Angel-specific KPIs | ✅ Pre-built (Returns Multiple, Mentorship Hours, Exit Rate) | ❌ Build from scratch | ✅ Partial coverage |
| Geographic Analysis | ✅ Region + Country breakdowns | ✅ Available | ⚠️ Limited in base tier |
| DAX / Custom Measures | ✅ Full DAX flexibility | ✅ Calculated fields | ⚠️ Vendor-controlled |
| Offline access | ✅ Full offline via Desktop | ⚠️ Limited | ❌ Cloud-only |
| Year-1 cost (5 users) | $17.99 total | ~$4,500 | ~$1,000–$10,000 |
| No subscription required | ✅ | ❌ | ❌ |
For angel networks that want 5-page investment analytics without paying SaaS subscription fees, the Business Angel Networks Dashboard in Power BI sits in the sweet spot.
Who Should Use This Template
✅ Perfect for:
- Angel network managers tracking 10–200 active deals across sectors and regions
- Independent angel investors who want portfolio-level returns and deal status visibility
- Family offices and seed-stage funds analyzing deal flow by funding stage and industry
- Startup accelerators and incubators monitoring portfolio company performance
- Finance professionals building investment reports for LP updates or board presentations
❌ Not a fit if:
- You need SOC 2-compliant multi-team SaaS with API integrations for enterprise VC operations
- You require real-time live data streaming rather than refresh-on-demand updates
- You are not willing to install the free Power BI Desktop application
Real-World Use Cases
Priya manages a 40-member angel network in Southeast Asia. She uses the Business Angel Networks Dashboard in Power BI to track 80+ portfolio companies across 6 sectors. Each quarter, she filters by region and funding stage to prepare LP update presentations — a process that previously consumed 3 days of manual spreadsheet work now completes in under an hour.
Michael is an independent angel investor with 25 direct deals. He connects his existing deal tracker spreadsheet to the Power BI dashboard and can immediately see which sectors deliver the highest returns multiple, which deals are stalled by status, and how his mentorship hours correlate with portfolio company performance. For the first time, all his investment data lives in one interactive report rather than five different spreadsheets.
A Berlin-based startup accelerator tracks 60 cohort companies using this dashboard to benchmark exit rates by region, identify funding stages with the best post-money valuation growth, and report geographic investment spread to institutional backers — without the $2,000/year cost of a dedicated portfolio management SaaS tool.
Advantages of the Business Angel Networks Dashboard in Power BI
- Purpose-built for angel investing — KPIs like Avg Returns Multiple, Total Mentorship Hours, and Exit Rate by Region are not standard in generic business dashboards. They are specifically designed for the decisions angel network managers make.
- Dramatically lower cost than SaaS alternatives — $17.99 once versus hundreds or thousands per year for Carta, Visible Capital, or comparable portfolio management platforms.
- Data ownership and privacy — your deal data stays in your own Power BI Desktop environment. No third-party SaaS vendor holds your proprietary portfolio information.
- DAX flexibility for custom analytics — add new measures, modify existing calculations, or build additional pages without waiting for a vendor roadmap. Power BI’s DAX engine gives you full analytical control.
- Rapid time-to-insight — realistic sample data is pre-loaded so you can explore the dashboard immediately, understand the data model, then connect your own source in under 10 minutes.
For more on building investment analytics in Power BI, Microsoft’s Power BI documentation on Microsoft Learn provides authoritative guidance on DAX measures, data modeling, and Power BI Service publishing.
Opportunities for Improvement
- The dashboard uses a static/refresh-on-demand data model — teams needing live streaming data will need to configure DirectQuery or a real-time Power BI dataflow separately.
- Advanced financial metrics such as IRR (Internal Rate of Return) and TVPI (Total Value to Paid-In) are not included by default but can be added as custom DAX measures by users familiar with Power BI.
- The geographic map visual requires Power BI to recognize location field names correctly — minor field mapping adjustments may be needed if your source data uses non-standard region or country naming conventions.
- The current version does not include a dedicated Co-investor tracking page — a feature that larger syndicate networks with complex co-investment structures may want to add.
Best Practices
- Standardize your data structure first — before connecting your real data, review the sample data column names and ensure your deal records use consistent naming for sectors, regions, investor types, and deal statuses.
- Use the slicer panel to drive LP presentations — apply region and funding stage slicers to pre-filter the dashboard before screen-sharing, so your audience sees only the portfolio slice relevant to their interests.
- Refresh monthly — set a calendar reminder to update the source data monthly so KPI trends and deal status distributions stay current.
- Add custom DAX measures gradually — start with the pre-built visuals, understand how the existing measures work, then extend the data model with custom calculations as your reporting needs evolve.
- Export pages to PDF for board decks — Power BI Desktop’s File → Export → Export to PDF feature converts any dashboard page to a static slide-ready output for board meetings and LP reports.
Explore Relevant Templates
- 🔹 VC Portfolio Dashboard in Power BI — Track fund-level IRR, MOIC, and portfolio company performance across a full VC fund lifecycle.
- 🔹 Investor Relations Dashboard in Power BI — Manage LP communications, capital calls, and investor reporting in one unified Power BI report.
- 🔹 Business Angel Networks Dashboard in Excel — The same 5-page angel network analytics built in Microsoft Excel with pivot tables and slicers.
- 🔹 Investment Banking KPI Dashboard in Excel — Deal pipeline, valuation metrics, and revenue tracking for investment banking professionals.
- 🔹 Also available: Browse the full Power BI Dashboard Templates collection on NextGenTemplates.
Frequently Asked Questions
What KPIs does the Business Angel Networks Dashboard in Power BI track?
The Business Angel Networks Dashboard in Power BI tracks 5 headline KPIs: Total Deals, Total Investment, Total Post-Money Valuation, Avg Returns Multiple, and Total Mentorship Hours. All 5 KPI cards update automatically when slicers are applied, providing filtered portfolio snapshots in seconds.
Do I need a Power BI Pro subscription to use this dashboard?
No. The Business Angel Networks Dashboard in Power BI runs fully on the free Power BI Desktop application. Power BI Pro is only needed if you want to publish and share the report via Power BI Service for multi-user cloud access. Power BI Desktop is a free download from microsoft.com/powerbi.
How long does setup take?
Setup takes under 10 minutes. Open the .pbix file in Power BI Desktop, connect it to your own deal data source in Excel or CSV format matching the sample column structure, and click Refresh. All 5 pages, 5 KPI cards, and 20+ visuals update instantly — no DAX expertise required.
How does this compare to Carta or Visible Capital?
The Business Angel Networks Dashboard in Power BI costs $17.99 as a one-time purchase versus $500–$2,000/year for Carta or Visible Capital. It includes angel-specific KPIs — Returns Multiple, Mentorship Hours, Exit Rate by Region — that most SaaS platforms don’t expose in their base-tier plans.
Can I add custom metrics to this Power BI dashboard?
Yes. The .pbix file is fully editable in Power BI Desktop. You can write new DAX measures for metrics like IRR or TVPI, add new report pages, modify chart types, or extend the data model with additional tables — giving you complete analytical control without vendor lock-in.
What data format does this dashboard require?
The Business Angel Networks Dashboard in Power BI uses an Excel-linked data model by default. Replace the source Excel file with your own deal records following the same column structure. You can also reconnect to any Power BI-supported source including CSV files, SQL databases, or SharePoint lists.
Is there an Excel version available?
Yes. The Business Angel Networks Dashboard in Excel is available on NextGenTemplates for users who prefer pivot-table-driven analytics in Microsoft Excel without needing Power BI Desktop installed.
About the Author
Built by PK — Microsoft Certified Professional with 15+ years of Excel, Google Sheets, and Power BI experience. Founder of NextGenTemplates, reaching 300K+ subscribers across YouTube channels (@PK-AnExcelExpert, @NextGenTemplates, @NeoTechNavigators). Every template is hand-built and tested before release.
Conclusion
The Business Angel Networks Dashboard in Power BI gives angel network managers, independent investors, and early-stage fund professionals a purpose-built analytics layer that replaces disconnected spreadsheets and expensive SaaS tools. With 5 interactive pages, 5 headline KPIs, 20+ DAX-powered visuals, and full slicer-based filtering, it delivers Carta-level portfolio intelligence at a fraction of the cost — in a .pbix file you own forever.
👉 Click here to Purchase the Business Angel Networks Dashboard in Power BI
✅ Instant download · One-time payment · No subscription
🎥 Watch step-by-step tutorials on our YouTube channel:
Youtube.com/@PK-AnExcelExpert
📅 Last updated: May 2026