Corporate travel is one of the top three controllable expense categories for mid-size organizations — yet most teams still track it with spreadsheets or rely on costly SaaS platforms that charge per user per month. The Business Travel Services Dashboard in Power BI is a $17.99 one-time-purchase .pbix template that tracks 5 KPIs across 5 interactive report pages, with 13 pre-built visualizations covering spend, compliance, destinations, cost breakdowns, and monthly trends. Open it in free Power BI Desktop, connect your travel data, and your first management-ready report is ready in under 30 minutes.
🌍 Join 8,400+ teams in 40+ countries using NextGenTemplates to replace paid SaaS tools with one-time-purchase Excel, Google Sheets, Power BI, and HTML templates.
🔗 Click here to Purchase the Business Travel Services Dashboard in Power BI
✅ Instant download · One-time payment · No subscription · No per-user fees · Lifetime access
Key Features of the Business Travel Services Dashboard in Power BI
This Power BI dashboard delivers 5 top-level KPI cards — Total Trips, Total Spend, Total Travelers, Total Approved Budget, and Avg Satisfaction — on the Overview page, giving executives and finance managers a complete picture of the entire corporate travel program at a glance. Every metric updates automatically when you refresh the data connection.
The template includes 13 pre-built visualizations, each answering a specific business question:
- Spend distribution across geographic regions
- Policy compliance rate as a dashboard-level gauge
- Employee satisfaction broken down by service type (flights, hotels, car hire)
- Monthly spend vs approved budget trend comparison
- Travel cost ranking by airline and by travel class
- Spend breakdown by trip type (domestic vs international, client vs internal)
- Top 5 destination cities by traveler count
- Approval rate by department and compliance rate by booking channel
Multi-dimensional slicers on the Overview page let finance and HR teams filter the entire report instantly — no formula editing required. This makes the template equally useful for weekly management reviews and quarterly executive presentations.
Dashboard Pages Explanation
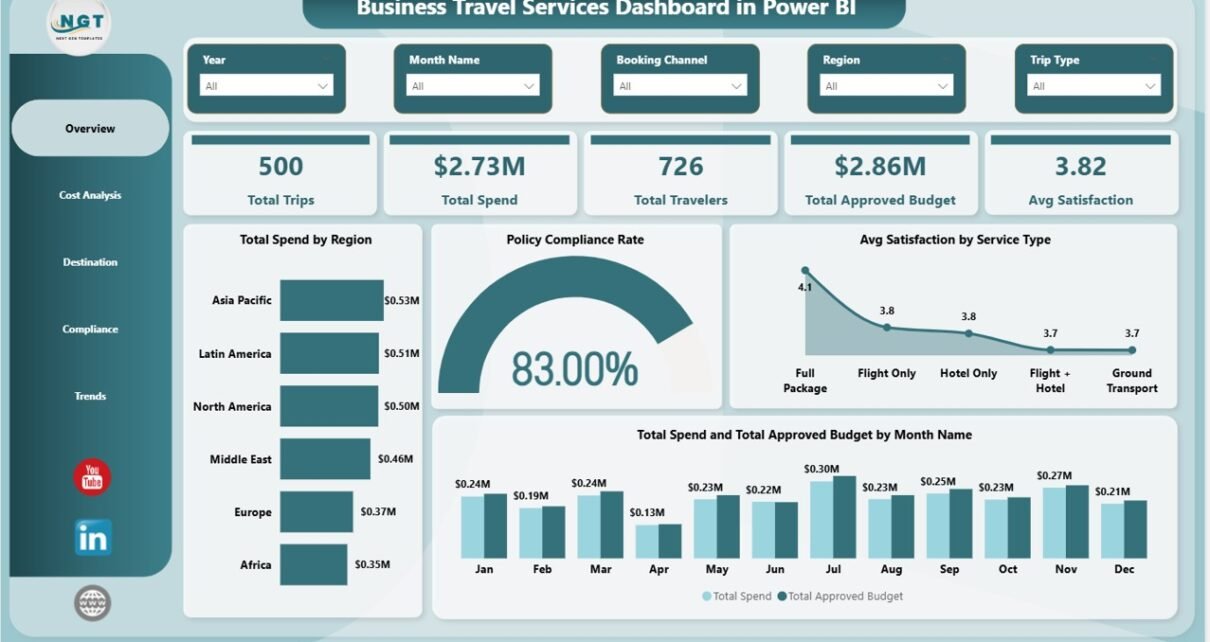
Page 1 — Overview
The entry point of the dashboard presents five KPI cards across the top: Total Trips, Total Spend, Total Travelers, Total Approved Budget, and Avg Satisfaction. Below the cards, four charts tell the story at the program level. Total Spend by Region immediately shows which geographic zones are driving the highest travel costs — essential for resource planning and regional budget reviews. Policy Compliance Rate distils compliance across the entire program into a single visible number, giving compliance managers and auditors an instant read without drilling into detail pages. Avg Satisfaction by Service Type surfaces whether flight providers, hotel chains, or ground transport services are consistently underperforming employee expectations. Total Spend and Total Approved Budget by Month Name overlays actual spend against the approved budget line month by month, making over-spend moments visible before they become end-of-year surprises. Slicers at the top allow instant filtering by any available dimension.
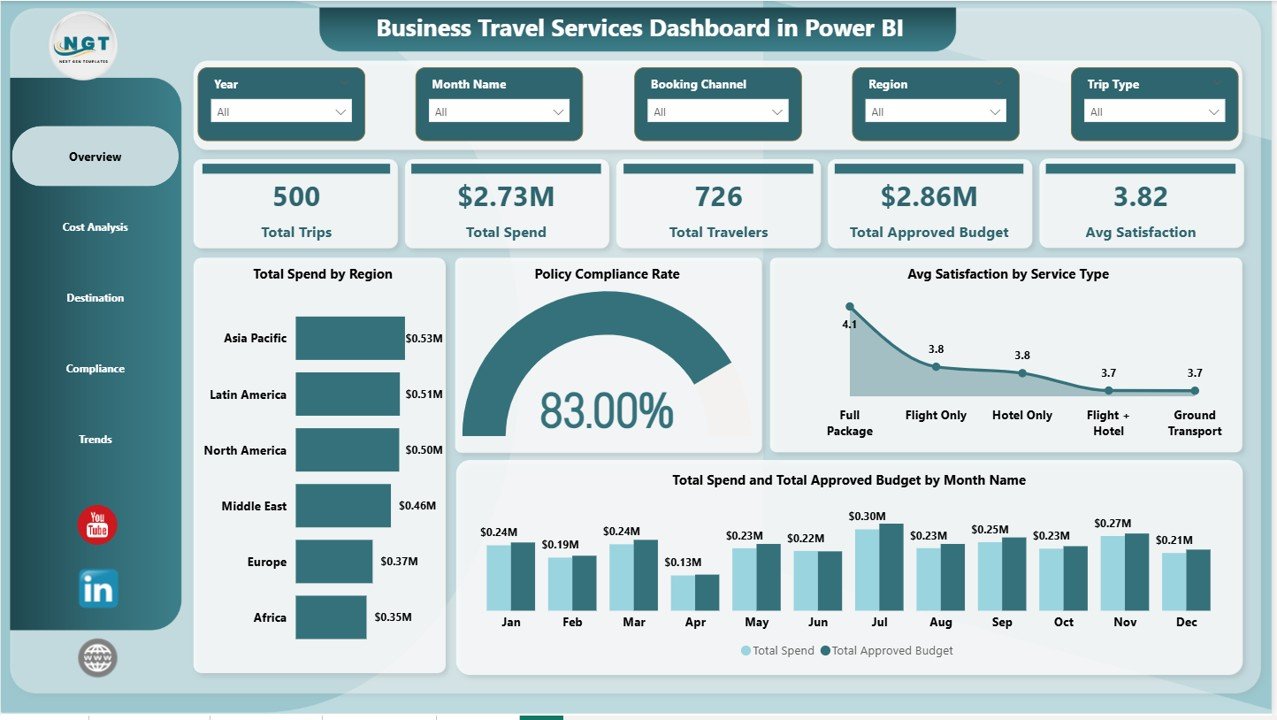
Business Travel Services Dashboard in Power BI — Overview Page
Page 2 — Cost Analysis
Four targeted cost visualizations let finance teams drill into the drivers of travel expenditure. Total Travel Cost by Airline ranks carriers by cumulative spend, supporting data-backed negotiations for preferred airline agreements or volume discounts. Total Travel Cost by Travel Class separates economy, business, and first-class bookings so operations managers can evaluate whether a class-upgrade policy is being followed or whether business-class spend is exceeding guidelines. Total Spend by Trip Type compares domestic and international travel or client-facing vs internal travel to clarify which category is consuming the budget. Total Spend and Total Approved Budget by Service Type overlays actuals against budget for flights, hotels, and ground transport, immediately highlighting which service categories are running over.
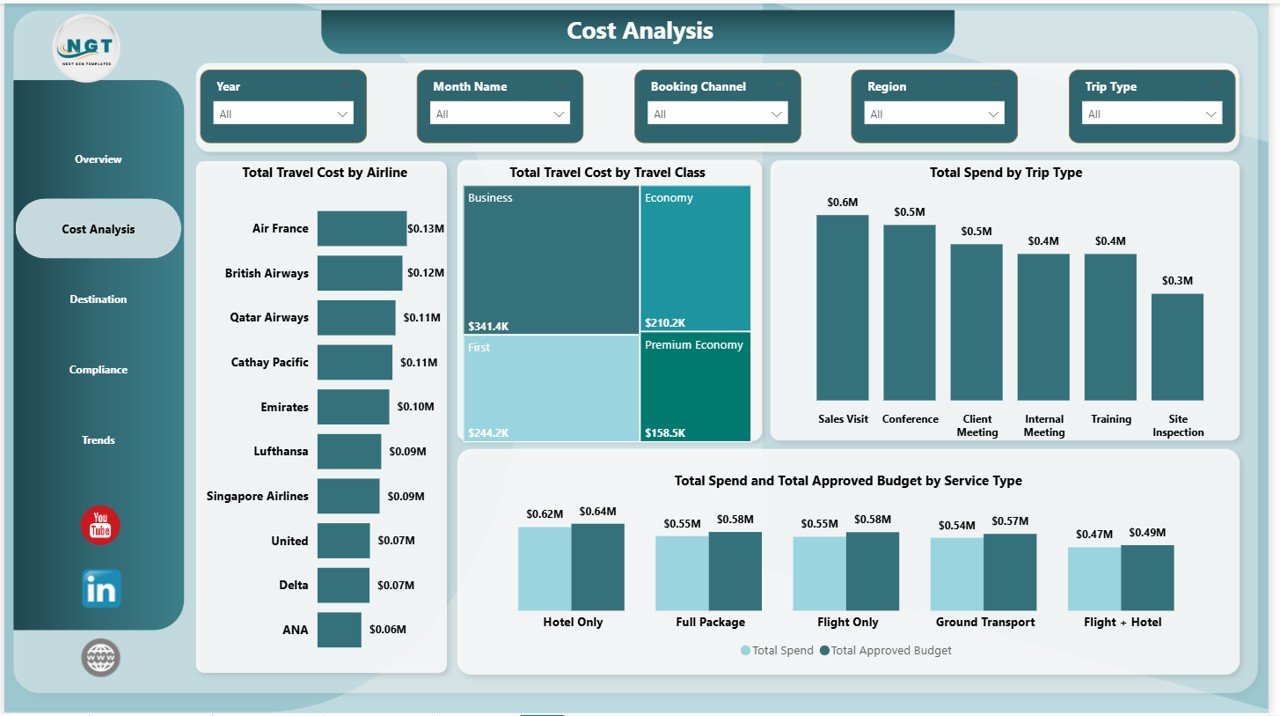
Business Travel Services Dashboard in Power BI — Cost Analysis Page
Page 3 — Destination
Three destination-focused visuals help organizations understand where their people are travelling and how budget is distributed geographically. Total Travelers by Top Five Destination City identifies the cities that generate the highest travel volume — useful for negotiating preferred hotel rates or setting up regional travel desks. Total Travelers by Region maps activity at a continental or country-group level, supporting strategic decisions about which markets justify more travel investment. Total Approved Budget by Region reveals whether the budget allocation matches where employees are actually going, enabling finance to rebalance approvals for the next planning cycle.
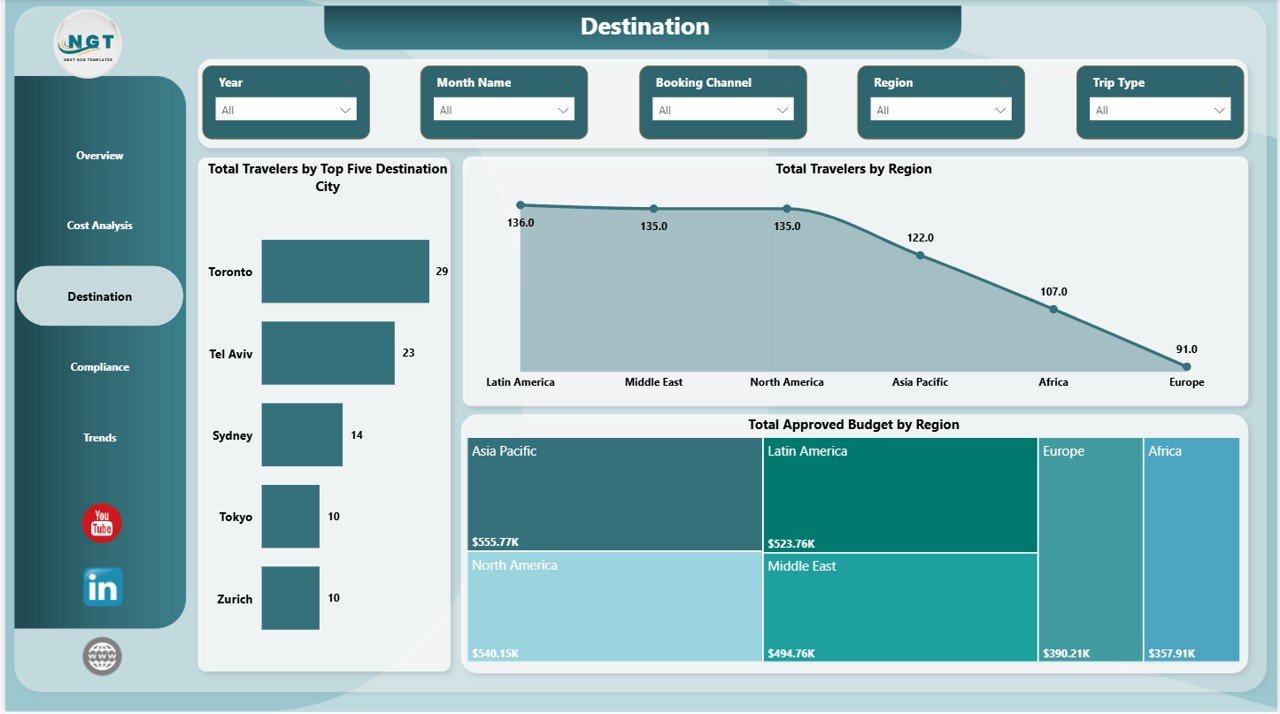
Business Travel Services Dashboard in Power BI — Destination Page
Page 4 — Compliance
Three compliance-centric charts make audit preparation faster and policy enforcement more data-driven. Approval Rate by Department shows which business units are consistently pre-approving travel vs booking ad hoc outside the approval workflow — allowing HR and management to target coaching or policy reminders at specific teams. Total Spend by Policy Compliance translates compliance status into dollar values, quantifying exactly how much spend is occurring outside policy guidelines. Policy Compliance Rate by Booking Channel identifies whether employees using corporate travel management tools comply at higher rates than those booking directly — a critical input for deciding whether to enforce a single mandatory booking platform.
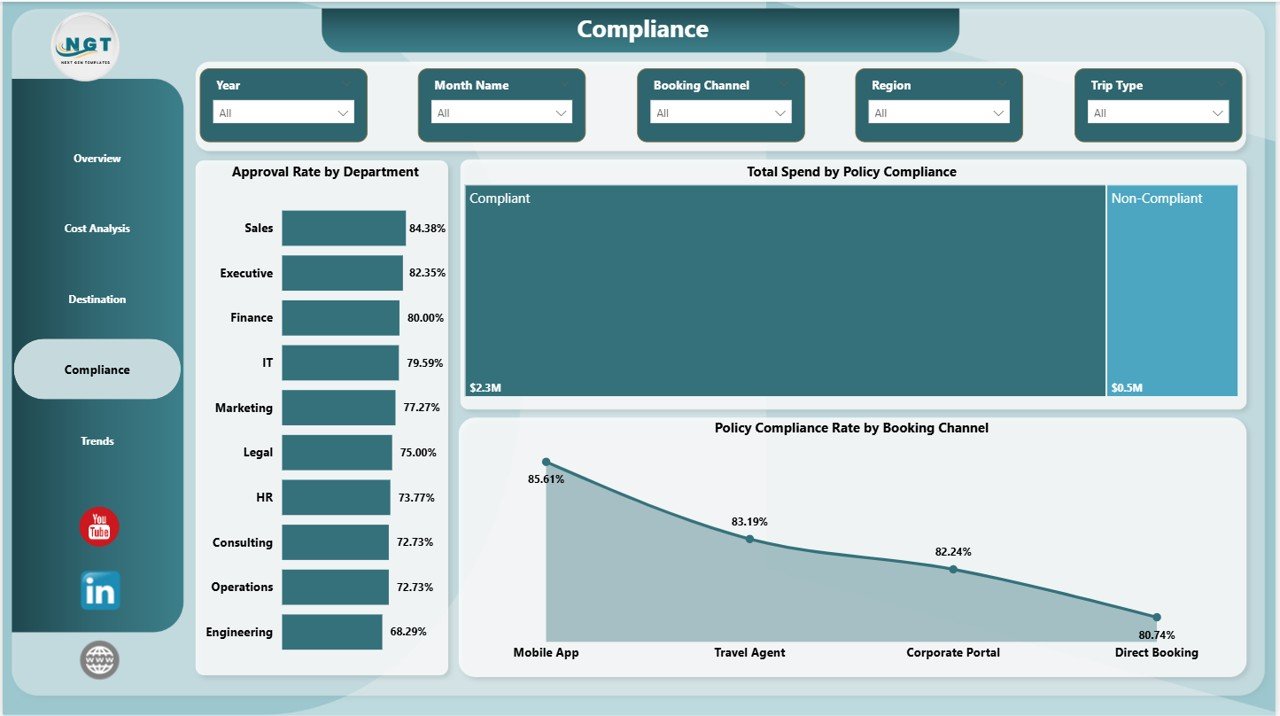
Business Travel Services Dashboard in Power BI — Compliance Page
Page 5 — Trends
Three time-series views support longitudinal analysis and future planning. Total Trips by Month Name tracks travel volume through the year, revealing seasonal peaks that HR and operations teams can use for capacity planning, advance booking campaigns, or quarterly budget forecasting. Total Spend and Total Approved Budget by Booking Channel compares how different booking methods — travel agencies, corporate portals, direct booking — track against budget over time, informing channel strategy decisions. Avg Satisfaction by Month Name monitors whether employee experience with travel services varies seasonally, helping identify if peak travel periods correlate with lower satisfaction scores that could signal service quality issues.
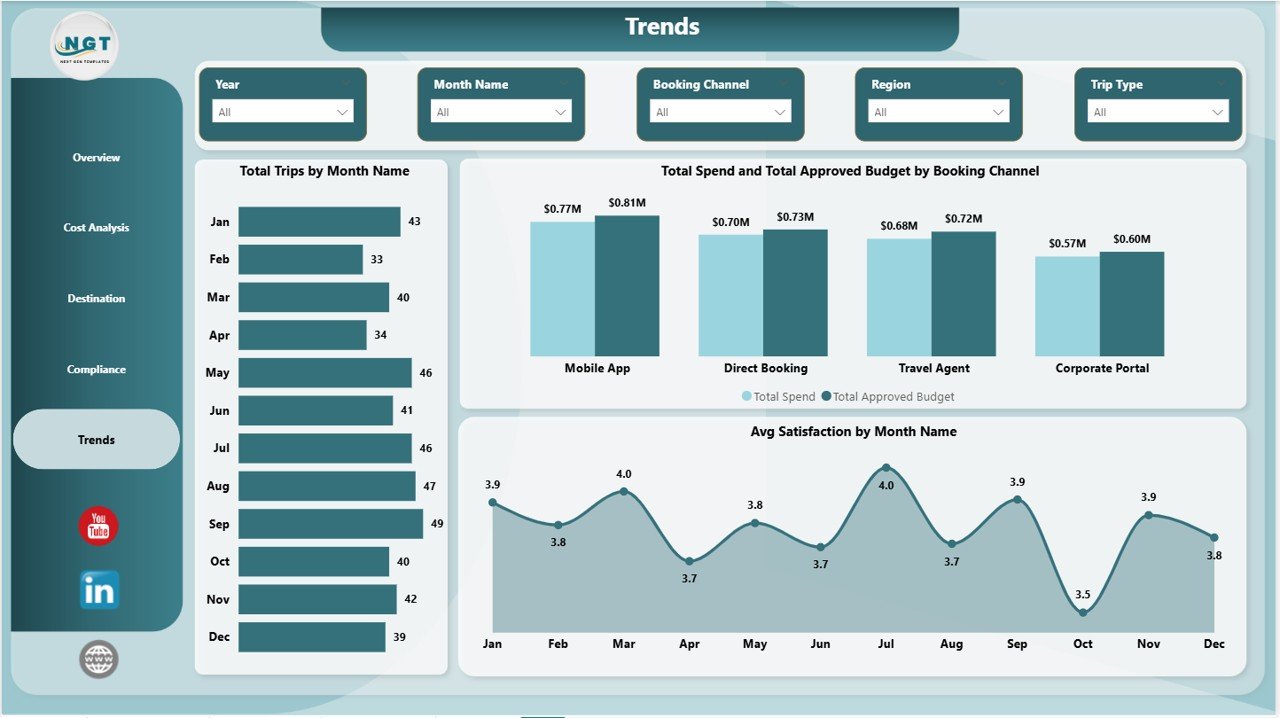
Business Travel Services Dashboard in Power BI — Trends Page
Business Travel Services Dashboard in Power BI vs. Tableau Alternative vs. SAP Concur — Feature Comparison
| Feature | Business Travel Services Dashboard in Power BI | Tableau Desktop | SAP Concur Travel |
|---|---|---|---|
| Cost | $17.99 one-time | $70/user/month | $8–25/user/month + setup |
| Platform | Power BI Desktop (free) | Tableau Desktop required | Cloud SaaS only |
| Setup time | Under 30 minutes | Hours of custom build | Weeks of implementation |
| Policy compliance tracking | ✅ 3 dedicated charts | Custom build required | ✅ Native |
| Satisfaction by service type | ✅ Built-in | Custom build required | Limited |
| Destination analytics | ✅ Top 5 cities + regions | Custom build required | Basic |
| Fully editable | ✅ .pbix file | ✅ | ❌ |
| Year-1 cost (5 users) | $17.99 total | $4,200+ | $480–1,500+ |
| No per-user fees | ✅ | ❌ | ❌ |
For teams that need corporate travel visibility without a SaaS subscription or custom BI build, the Business Travel Services Dashboard in Power BI sits in the sweet spot between a spreadsheet and an enterprise travel platform.
Who Should Use This Template
Perfect for:
- Finance managers tracking corporate travel spend, compliance, and budget variances
- Travel coordinators and operations teams at 20–500 person companies needing audit-ready reporting
- HR and admin teams responsible for employee travel satisfaction and policy enforcement
- Power BI practitioners who want a complete travel analytics template without starting from scratch
- Consultants building travel spend dashboards for corporate clients
Not a fit if:
- You need real-time automated expense ingestion from booking platforms (requires custom Power BI connectors)
- Your organization requires enterprise-grade SSO, SOC 2 compliance, or role-based row-level security
- You don’t have access to Power BI Desktop (free from Microsoft)
Real-World Use Cases
Priya manages finance operations at a 120-person technology firm. Each quarter she exports travel records from their booking system, loads the data into the Business Travel Services Dashboard in Power BI, and within minutes she has a complete report showing which departments are overspending, which booking channels have the lowest compliance, and whether satisfaction with hotel services has dipped. She presents it to the CFO without building a single custom visual.
Marcus is a travel policy manager at a professional services firm. He uses the Compliance page to identify that one regional office consistently books flights outside the approved airline list. The Policy Compliance Rate by Booking Channel chart gives him the data to present to HR leadership and make a case for enforcing a single corporate booking portal.
Tanuja handles vendor management for a mid-size consulting group. Using the Destination page she identifies the top 5 cities where her employees travel most, and uses that data to negotiate preferred hotel rates. The Cost Analysis page helps her show the CFO that shifting 20% of business-class bookings to economy class could reduce the annual travel budget by $40K.
Advantages of the Business Travel Services Dashboard in Power BI
- One-time cost vs ongoing SaaS fees — $17.99 replaces tools that charge $8–25 per user per month
- Five focused pages — each page answers a specific question, making stakeholder presentations faster
- Compliance tracking built in — most travel dashboards skip compliance; this one dedicates a full page and a KPI card to it
- Satisfaction analytics included — tracking employee satisfaction by service type is rare in template dashboards and high-value for HR reporting
- No DAX expertise required — all measures and calculations are pre-built; just connect your data and refresh
- Fully editable .pbix — rename fields, adjust colors, add pages, or connect different data sources without restriction
Opportunities for Improvement
- Does not include a real-time booking data connector — data must be imported manually via Excel, CSV, or a Power Query connection
- Row-level security (limiting which departments see which data) requires additional Power BI Pro configuration not included in the template
- Map visuals for destination data require a Bing Maps connection, which may not be available in all Power BI Desktop environments
Best Practices
- Standardize your data schema first — ensure your travel data includes consistent field names for Region, Service Type, Booking Channel, Department, and Travel Class before connecting
- Refresh monthly at minimum — the Trends page is most valuable when it has at least 6 months of data to show seasonal patterns
- Use the Compliance page in policy reviews — share the Approval Rate by Department chart directly with department heads during quarterly business reviews to drive behaviour change
- Bookmark the Overview slicers — create Power BI bookmarks for your most common filter combinations (e.g., Q1 + International + Business Class) to make recurring reports one-click
- Export pages to PDF for distribution — stakeholders who don’t have Power BI access can receive static PDF exports of each page via the File → Export menu
Explore Relevant Templates
Also available as: Business Travel Services Dashboard in Excel — the same 5-page analysis in a pivot-table format for Excel users who prefer working without Power BI.
More Power BI Dashboard Templates you may find useful:
- Business Angel Networks Dashboard in Power BI
- Bridge Construction Dashboard in Power BI
- Security Company Dashboard in Power BI
- HVAC Service Dashboard in Power BI
Frequently Asked Questions
What KPIs does the Business Travel Services Dashboard in Power BI include?
The Business Travel Services Dashboard in Power BI includes 5 top-level KPIs on the Overview page: Total Trips, Total Spend, Total Travelers, Total Approved Budget, and Avg Satisfaction. All 5 metrics update automatically when you connect your own travel data and refresh the report in Power BI Desktop.
Do I need a Power BI Pro license to use this template?
No. The template opens and runs in Power BI Desktop, which Microsoft provides completely free. Power BI Pro is only needed if you want to publish the finished report to the Power BI Service cloud and share a live link with colleagues who don’t have Desktop access.
How does this template compare to SAP Concur for corporate travel analytics?
SAP Concur costs $8–25 per user per month plus weeks of implementation. The Business Travel Services Dashboard in Power BI is a $17.99 one-time purchase that covers the same core analytics — spend, compliance, destinations, and trends — and is ready to use in under 30 minutes with no ongoing fees or per-user charges.
Can I connect my own travel data to this Power BI template?
Yes. Open the template in Power BI Desktop and use Transform Data (Power Query) to connect your own Excel file, CSV export, SQL database, or any other supported data source. Map your column names to match the template fields and click Refresh — all 5 report pages update with your live data.
How long does it take to set up the Business Travel Services Dashboard in Power BI?
Most users complete the full setup in under 30 minutes. The process involves downloading Power BI Desktop (free, if not already installed), opening the .pbix file, connecting your travel data source, mapping column names, and clicking Refresh. No DAX coding or custom measure development is required for the standard configuration.
Is this template suitable for a team of 50 people?
Yes. The Business Travel Services Dashboard in Power BI works equally well for teams of 10 or 500. The only limitation is that a Power BI Pro license is required to share a live report with 50+ colleagues via the Power BI Service. For smaller teams or senior stakeholder reporting, PDF exports work without any additional licensing.
What is included in the download?
The download is a ZIP file containing one .pbix Power BI report file with all 5 pages pre-built and populated with sample travel data. Replace the sample data with your own records, click Refresh, and your dashboard is live.
About the Author
Built by PK — Microsoft Certified Professional with 15+ years of Excel, Google Sheets, and Power BI experience. Founder of NextGenTemplates, reaching 300K+ subscribers across YouTube channels. Every template is hand-built and tested before release.
Conclusion
The Business Travel Services Dashboard in Power BI gives finance managers, travel coordinators, and operations teams a structured, audit-ready view of their entire corporate travel program — spend, compliance, destinations, costs, and trends — across 5 dedicated report pages with 13 pre-built visualizations. At $17.99 one-time, it replaces SaaS tools that charge thousands per year with a fully customizable .pbix file that works in free Power BI Desktop.
🔗 Click here to Purchase the Business Travel Services Dashboard in Power BI
✅ Instant download · One-time payment · No subscription
📅 Last updated: May 2026
📺 Visit our YouTube channel for step-by-step tutorials: Youtube.com/@PK-AnExcelExpert