The global sports and recreation market is projected to surpass $614 billion by 2027 (Allied Market Research, 2024), and clubs, fitness studios, and recreation centers now juggle 5–15 event organizers per facility with 20+ revenue lines per month. Yet most program directors still rebuild monthly profitability views from scratch in Excel — losing 4–6 hours every week and gaining zero visibility into which organizers, departments, or event types are actually paying the bills.
The Sports & Recreation Report in Excel replaces that weekly rebuild with a single .xlsx file — four structured sheets, five KPI cards, five interactive charts, and slicers on both visible pages. Setup takes under ten minutes, the report opens in Microsoft Excel 2016 or later on Windows and Mac, and the workbook is yours forever. This post walks through every sheet, who it’s built for, how it stacks up against paid club management SaaS, and the practical setup steps.
👉 Click here to Purchase the Sports & Recreation Report in Excel
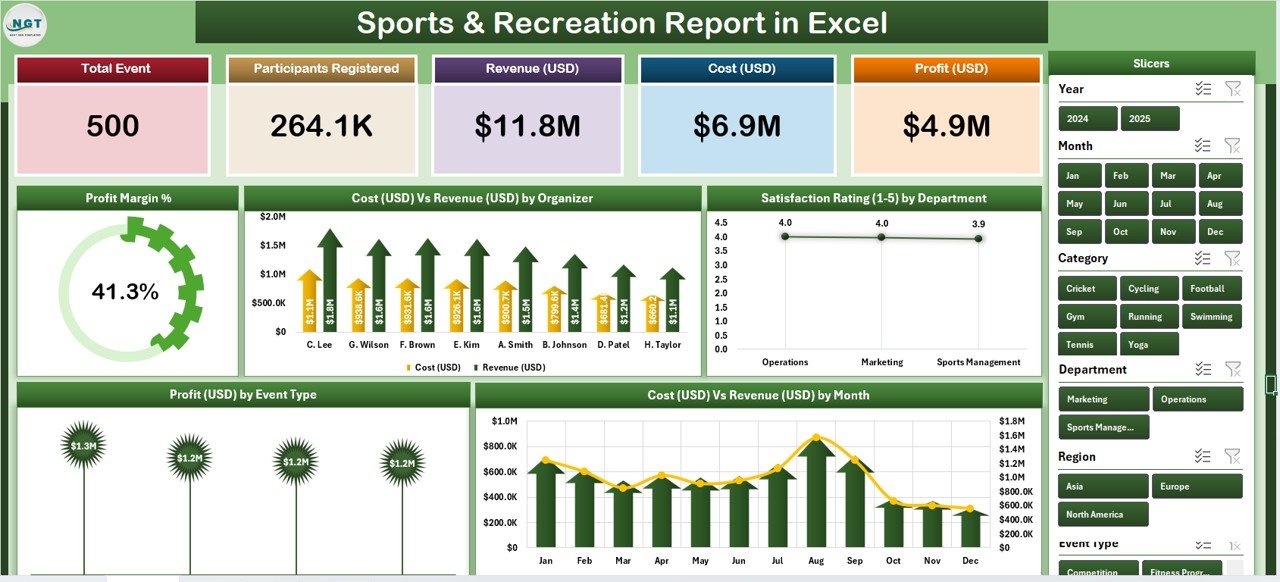
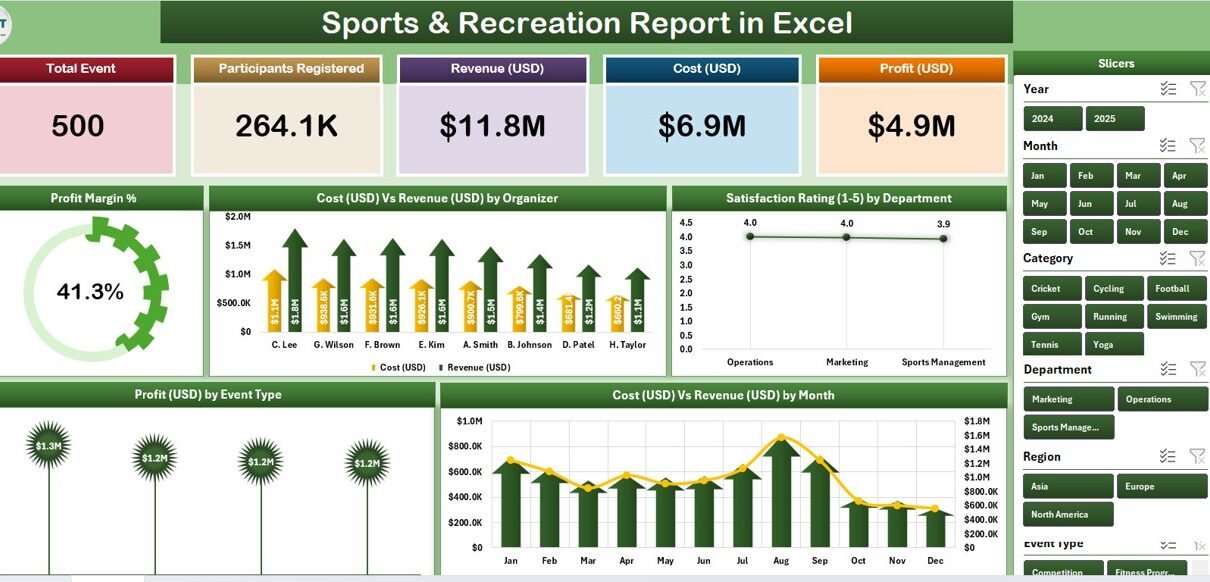
Sports & Recreation Report in Excel — Summary Page
Key Features of the Sports & Recreation Report in Excel
This report gives sports club managers, recreation directors, fitness studio owners, and event finance teams a single Excel file for tracking event profitability, organizer cost-revenue ratios, departmental satisfaction, and monthly financial trends. The dashboard is purpose-built around the five questions program directors ask every Monday morning.
- Five-KPI Summary Page — Five card-style KPIs at the top of the Summary Page give leadership an instant snapshot of sports and recreation performance, with a right-side slicer panel that filters the entire report by event type, organizer, department, or time period.
- Profit Margin % chart — A headline profitability gauge for your entire program portfolio. Recreation directors use this to flag loss-making events before they erode the quarterly budget.
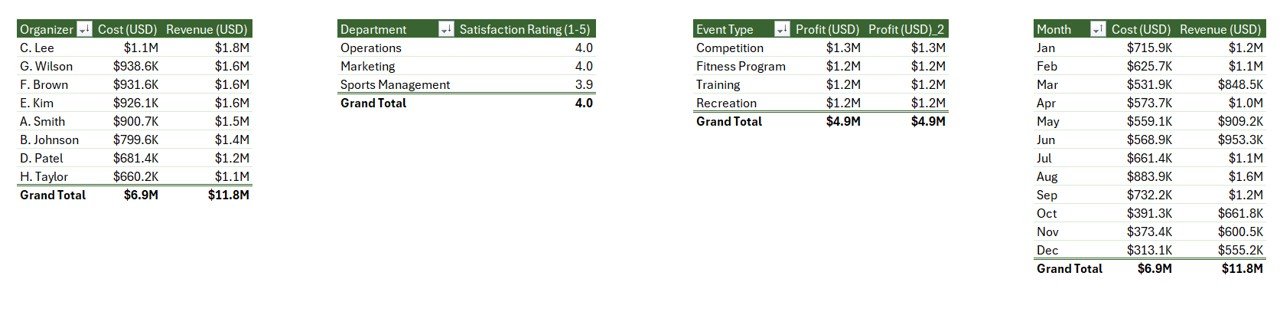
- Cost Vs Revenue by Organizer — A side-by-side financial comparison across every event organizer, so program managers see exactly which organizers run profitable events and which need pricing or expense reviews.
- Satisfaction Rating by Department — Tracks member and participant satisfaction across departments like Aquatics, Fitness, Youth Programs, Adult Leagues, and Tournaments — a leading indicator of renewal and word-of-mouth growth.
- Profit by Event Type — Groups net profit by event type (Tournaments, Leagues, Camps, Clinics, Special Events) so club owners know exactly which formats pay for themselves and which need a pricing review.
- Cost Vs Revenue by Month — A 12-month trend view of total event cost against total revenue, useful for cash-flow forecasting, spotting seasonal dips, and measuring the ROI of marketing campaigns or new program launches.
- Detailed Report Page with Information Table — A dedicated Report Page with a left-side slicer and a transaction-level information table, built for auditing individual events, preparing finance reports, and exporting line-item data for accountants.
- 100% Pivot-Table Driven — The Support sheet holds every pivot table that feeds the dashboard. Update the Data sheet once, hit Data → Refresh All, and every card, chart, and slicer rebuilds automatically — no formulas to edit, no DAX, no macros.
Sheets Explanation
The file includes 4 Excel sheets, each with a specific role in the monthly reporting workflow. The two visible pages — Summary and Report — are the ones your team will use day-to-day; the Data and Support sheets sit underneath as the engine.
Page 1: Summary Page
The main dashboard view. At the top, 5 KPI cards display headline metrics at a glance. A right-side slicer panel filters the entire page by event type, organizer, department, and time period. Five interactive charts cover the core questions sports and recreation leadership ask every month: Profit Margin %, Cost Vs Revenue by Organizer, Satisfaction Rating by Department, Profit by Event Type, and Cost Vs Revenue by Month.
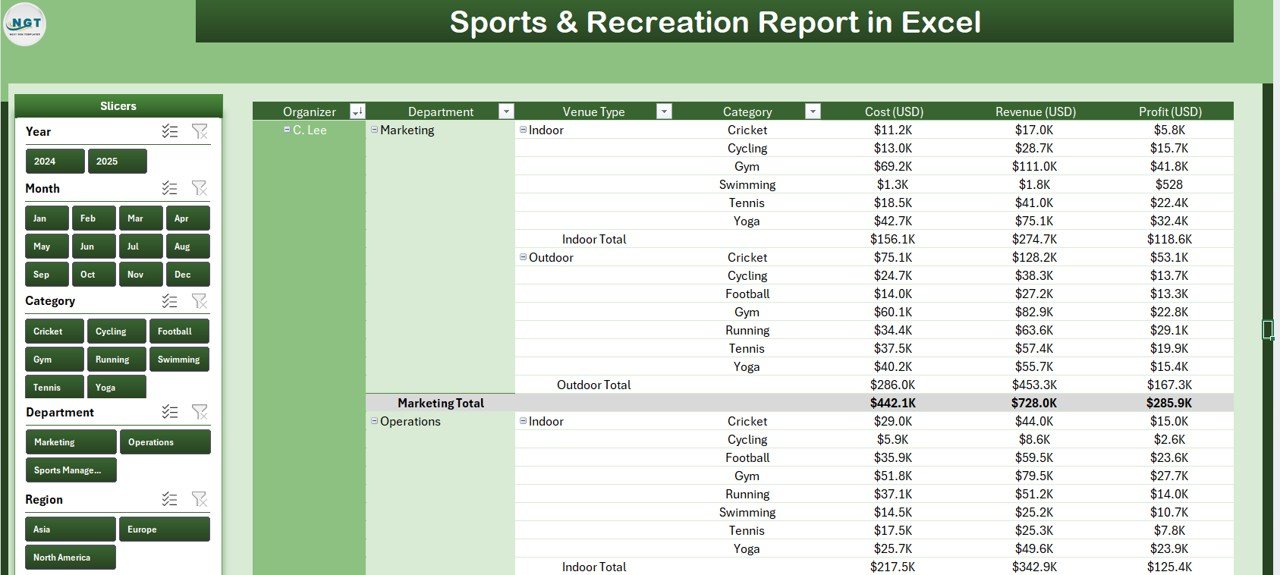
Page 2: Report Page
A left-side slicer drives a detailed information table with transaction-level event records. Use this page to pull event-level lists for finance reviews, organizer audits, or month-end reconciliation with the accounting team.
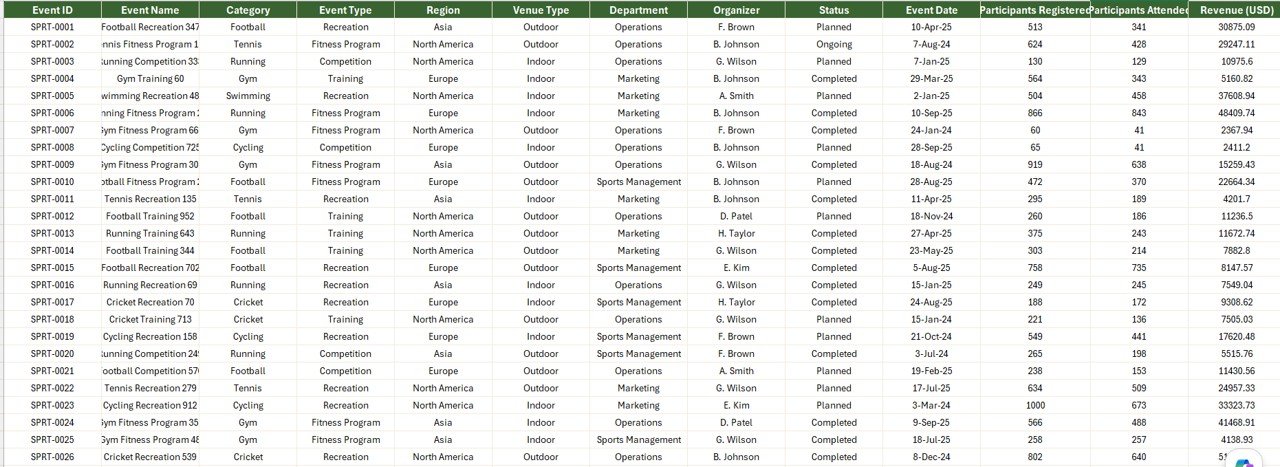
Page 3: Data Sheet
The raw input sheet. Paste your event-level records into the same column structure — Date, Event Type, Organizer, Department, Revenue, Cost, Satisfaction Rating, and any other operational fields you track. Keep the headers identical; every pivot in the Support sheet references them directly.
Page 4: Support Sheet
Holds every pivot table that feeds the Summary Page charts and KPI cards. After updating the Data sheet, click Data → Refresh All in the Excel ribbon and every pivot recalculates. Hide this sheet in production — your team only needs to see the Summary Page and Report Page.
Sports & Recreation Report in Excel vs. Google Sheets Equivalent vs. Jonas Club / EZFacility — Feature Comparison
| Feature | Sports & Recreation Report in Excel | Google Sheets equivalent | Jonas Club / EZFacility / MINDBODY |
|---|---|---|---|
| Cost | $7.99 one-time ✅ | ~$10 one-time template | $150–$400 / facility / month |
| Platform | Microsoft Excel (desktop) | Google Sheets (browser) | Web + mobile SaaS |
| Works offline | ✅ Yes | ❌ Requires internet | ❌ Requires internet |
| Setup time | Under 10 minutes ✅ | ~15 minutes | 2–6 weeks onboarding |
| Customizable KPIs & charts | ✅ Fully editable | ✅ Editable | ❌ Fixed reporting modules |
| Per-user licence fees | None — share freely | None | $150+ per facility / month |
| Data stays on your device | ✅ Yes | ❌ Cloud (Google servers) | ❌ Vendor cloud |
| Year-1 cost at 3 facilities | $7.99 ✅ | ~$10 | $5,400–$14,400 |
| Organizer + event-type breakdown | ✅ Pre-built | Needs rebuild | ✅ Pre-built |
For sports clubs and recreation centers that want organizer, event-type, and departmental profit visibility without paying $5,000+ per year in SaaS fees, the Sports & Recreation Report in Excel sits in the sweet spot.
Who Should Use This Template
Perfect for:
- Sports club managers tracking event profitability and organizer performance month over month
- Recreation center directors running 2–10 program areas who need departmental cost-revenue comparisons
- Fitness studio and gym owners preparing monthly finance reports for stakeholders or franchise HQ
- Event finance teams reviewing tournament, league, and camp profitability across organizers
- Sports consultants and program managers delivering monthly client reports without rebuilding charts in PowerPoint
Not a fit if:
- You run an enterprise sports federation needing certified cloud infrastructure with SSO, role-based access, and audit logs
- Your team needs integrated member registration, online booking, payment processing, and access control in one platform (use Jonas Club Software or MINDBODY)
- Your club only uses Google Sheets — browse the Google Sheets Dashboards collection instead
- You need real-time scoreboards or live event tracking with sub-second updates
Real-World Use Cases
David runs operations at a 12-court tennis club in Phoenix. Every month he opens the Sports & Recreation Report in Excel, refreshes the pivots, and reviews the Profit by Event Type chart with his head pro. The chart helped him identify that junior camps were running a 9% margin while adult leagues sat at 34% — he repriced the camp packages and recovered an estimated $18,000 per season. The 4-sheet workflow replaced three separate spreadsheets and a monthly slide deck.
Sarah is a recreation director for a municipal sports complex in Manchester. She uses the Cost Vs Revenue by Organizer and Satisfaction Rating by Department views every Monday to compare third-party organizer performance. After spotting that her tournament organizer had 22% higher costs but matching revenue, she renegotiated the contract and saved roughly £14,000 in the next quarter — without paying $300 per month for EZFacility’s analytics module.
Priya is a freelance sports consultant working with mid-size Indian fitness chains. She uses the Sports & Recreation Report as her standard monthly client deliverable. Each engagement gets the same 4-sheet model — replace data, refresh, screenshot the Summary Page into the client’s deck. Her reporting prep dropped from 5 hours to 40 minutes per client.
Advantages of the Sports & Recreation Report in Excel
The report pays for itself the moment it replaces a single month of paid club management analytics. At $7.99 one-time versus $150–$400 per facility per month, a 3-facility operator saves $5,392–$14,392 in year one alone. Beyond the cost, the .xlsx file is a complete asset you own — no vendor lock-in, no data trapped behind a SaaS API, and free updates whenever the template is improved. Refreshing the data against a new month of records takes one click in Excel’s pivot table refresh rather than a half-day of CSV stitching.
Opportunities for Improvement
This is an honest section because it builds trust. The Sports & Recreation Report in Excel is a refresh-based file — it’s not a real-time scoring system and won’t replace a POS, registration, or member-management platform. It assumes your event-level data lives in a standard Date / Event Type / Organizer / Department / Revenue / Cost / Satisfaction column structure; if your export uses different field names, you’ll spend an extra 10–15 minutes mapping headers the first time. The report also doesn’t include forecasting (ARIMA, exponential smoothing) — those would need to be added through Excel’s Forecast Sheet or external models. None of these are blockers for monthly reporting, but worth knowing before deployment.
Best Practices
To get the most out of the Sports & Recreation Report in Excel: standardize organizer names in your source data before refresh (inconsistent spellings like “YMCA” vs “Y.M.C.A.” will create duplicate slicer entries); use a fixed weekly or monthly refresh cadence so the team is always reviewing the same window; hide the Support sheet before sharing the file with non-finance staff so they only see the Summary and Report pages; and pair the Excel file with the Sports & Recreation KPI Dashboard in Excel if you need MTD/YTD target tracking alongside the profitability lens this report provides.
Explore Relevant Templates
The dashboard sibling of this report is the Sports & Recreation KPI Dashboard in Excel, which tracks MTD/YTD KPIs across 7 sheets with combo charts and target-vs-actual indicators. For Power BI teams, the Sports & Recreation KPI Dashboard in Power BI delivers the same structure with drill-through pages and DAX measures. Operators running ticketed events should look at the Event Production KPI Dashboard in Power BI. And if you want a peer Excel Report in another vertical to see how the 4-sheet pivot structure adapts to a different industry, the Healthcare Services Report in Excel uses the same architecture. Browse the full Excel Reports collection on NextGenTemplates.
Frequently Asked Questions
What KPIs does the Sports & Recreation Report in Excel track?
The Sports & Recreation Report in Excel tracks 5 headline KPIs as card visuals on the Summary Page, plus 5 interactive charts: Profit Margin %, Cost Vs Revenue by Organizer, Satisfaction Rating by Department, Profit by Event Type, and Cost Vs Revenue by Month. All metrics update automatically when you click Data → Refresh All after pasting new data.
How long does setup take?
Setup takes under 10 minutes. Open the .xlsx file in Microsoft Excel 2016 or later, paste your event-level data into the Data sheet keeping the column headers identical, then click Data → Refresh All. Every card, chart, and slicer on the Summary Page of the Sports & Recreation Report in Excel updates automatically — no formulas to rewrite, no DAX, no macros.
How does this compare to Jonas Club Software or EZFacility?
Jonas Club Software and EZFacility charge $150 to $400 per facility per month — roughly $1,800 to $4,800 per facility per year. The Sports & Recreation Report in Excel is a $7.99 one-time purchase with no per-facility fees, works offline, and keeps member data on your device. It’s a reporting layer, not a replacement for a club management or POS platform.
Does this template work on Mac Excel?
Yes. The Sports & Recreation Report in Excel is built entirely with pivot tables and slicers — no VBA, no macros — so it runs identically on Windows Excel and Mac Excel 2016 or later. No internet connection is required, which makes it ideal for facilities with strict data-isolation policies.
Can I add my own event types, organizers, or departments?
Yes. Add new event types, organizers, departments, or satisfaction levels directly to the Data sheet. After adding rows, click Data → Refresh All in the ribbon and every pivot table on the Support sheet picks up the new categories. The Summary Page charts populate automatically — no manual chart edits required.
Is member data safe with this template?
Event and member data stays entirely on your device. The Sports & Recreation Report in Excel doesn’t connect to any cloud service, API, or external database. You control encryption, access, and sharing — unlike vendor-cloud SaaS tools where data sits on third-party servers by default.
Will updates be free if the template is improved?
Yes. Customers receive free updates whenever the Sports & Recreation Report in Excel is revised — new charts, layout fixes, or column additions are pushed to existing buyers at no extra cost.
About the Author
Built by PK — Microsoft Certified Professional with 15+ years of Excel, Google Sheets, and Power BI experience. Founder of NextGenTemplates, reaching 300K+ subscribers across YouTube channels. Every template is hand-built and tested before release.
Conclusion
The Sports & Recreation Report in Excel is the simplest way to consolidate event-level profitability, organizer performance, and departmental satisfaction into a single Excel file — without committing to multi-thousand-dollar club management SaaS or weeks of custom dashboard work. 4 sheets, 5 KPI cards, 5 charts, slicers on both visible pages, and an .xlsx you own forever for $7.99.
👉 Click here to Purchase the Sports & Recreation Report in Excel
✅ Instant download · One-time payment · No subscription · Lifetime access
🎥 Visit our YouTube channel for step-by-step video tutorials: Youtube.com/@PK-AnExcelExpert
📅 Last updated: May 2026