Digital Microloans Dashboard in Excel is a ready-to-use reporting template for digital lenders, microfinance institutions, NGO lending programs, branch managers, and portfolio analysts who need quick visibility into loan amount, outstanding balance, repayment, default %, risk category, borrower type, branch, and loan officer performance. Instead of rebuilding pivot tables every month, you can update the Data sheet, click Refresh All, and review 5 KPI cards plus 19 dashboard charts across focused Excel pages.
This template is designed for teams that already manage loan records in Excel exports, CSV files, or core-system downloads and want a clean management dashboard without buying a monthly analytics tool. You can also review Microsoft’s guidance on creating PivotTables in Excel if you want to understand the reporting engine behind the workbook.
Download the Digital Microloans Dashboard in Excel from NextGenTemplates.
Digital Microloans Dashboard in Excel
Key Features of Digital Microloans Dashboard in Excel
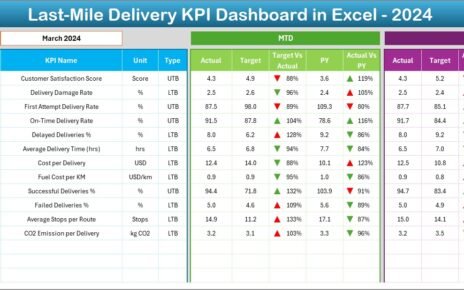
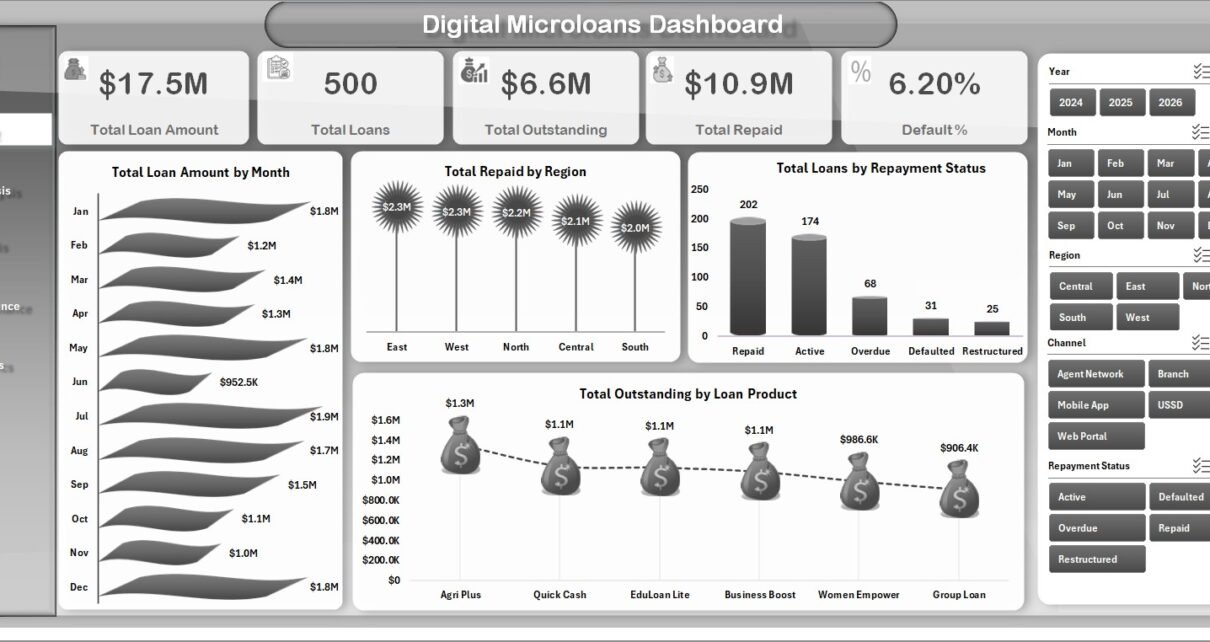
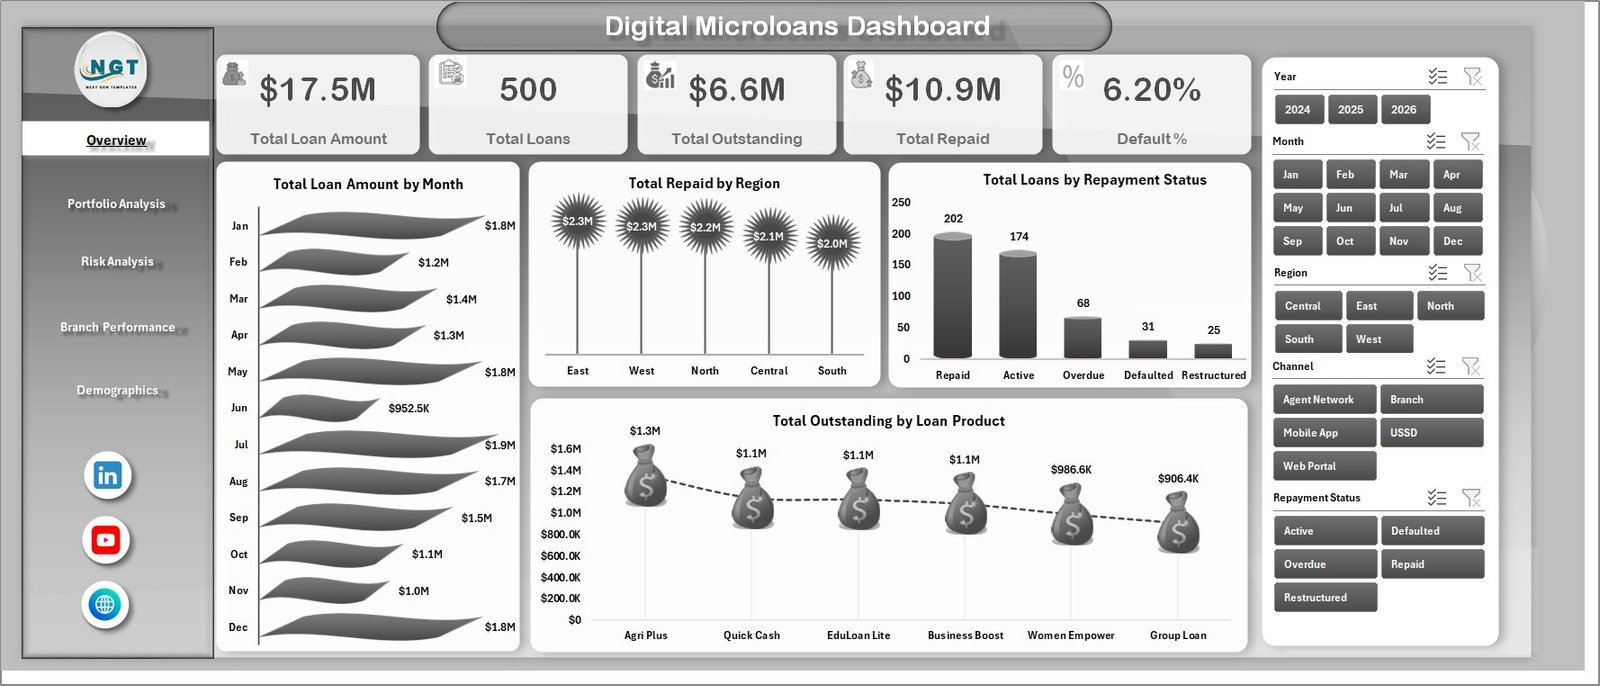
5 high-level KPI cards. The Overview page shows Total Loan Amount, Total Loans, Total Outstanding, Total Repaid, and Default %. These cards help lending teams understand portfolio size, repayment progress, and risk exposure at a glance.
19 analysis charts across 5 dashboard pages. The workbook includes charts for loan amount by month, repaid amount by region, repayment status, outstanding by product, loan purpose, borrower type, channel, risk category, branch, gender, loan officer, and demographics.
Multiple slicers for faster filtering. Slicers let users click through portfolio segments and see the charts update quickly. This is useful for monthly review meetings, branch comparisons, risk monitoring, and field officer performance discussions.
Data sheet plus support pivots. The Data sheet is where you paste or enter records in the same structure. The Support sheet contains pivot tables that power the charts, so after updating data you can use Data > Refresh All in the Excel Ribbon.
No subscription required. The dashboard works as an Excel file, making it suitable for small and mid-sized teams that want file-based reporting, one-time purchase pricing, and full control over workbook customization.
Dashboard Pages Explanation
1 – Overview Page
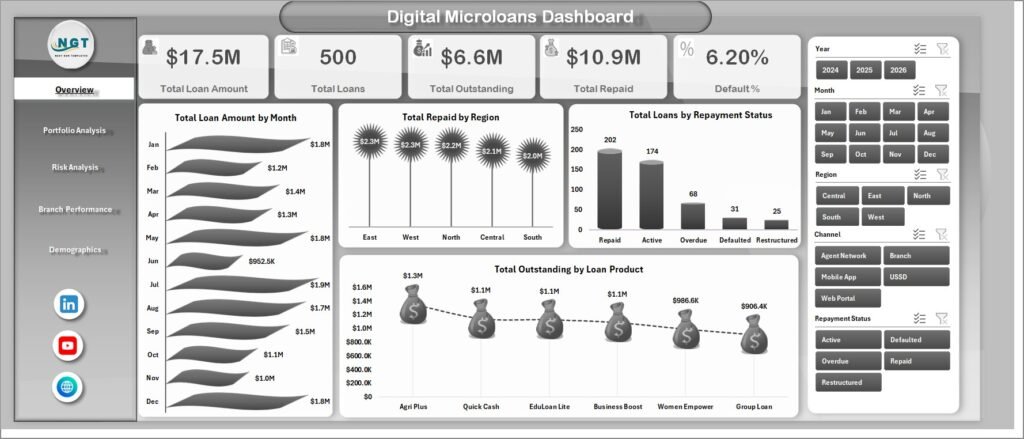
The Overview page is the executive page of the workbook. It brings together high-level portfolio cards and the most important trend/status charts in one place.
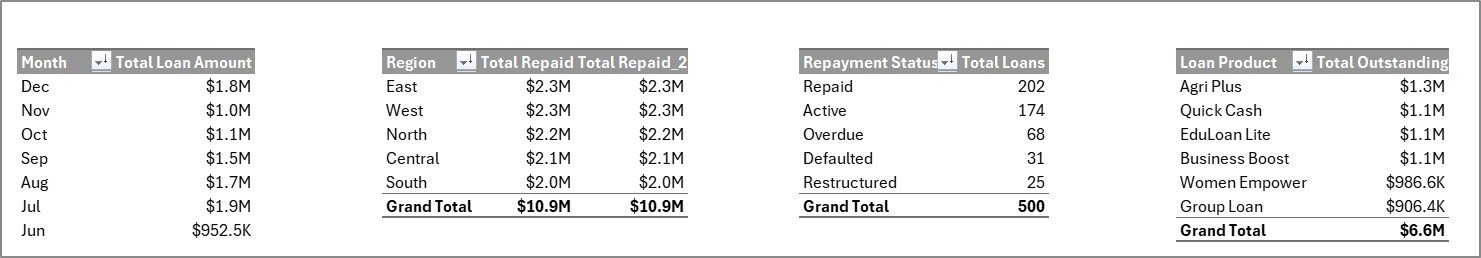
Total Loan Amount by Month shows how lending volume moves month by month. It helps managers identify seasonal growth, low-disbursement periods, or months that need deeper review.
Total Repaid by Region compares repayment amounts across regions. This view is useful for spotting strong collection areas and regions that may need extra follow-up.
Total Loans by Repayment Status shows how loans are distributed across repayment categories. It helps the team understand how much of the portfolio is active, repaid, delayed, or defaulted.
Total Outstanding by Loan Product highlights exposure by product type. If one product carries a large outstanding balance, management can review pricing, tenure, risk policy, or collection focus.
2 – Portfolio Analysis
The Portfolio Analysis page explains how lending is distributed by purpose, borrower type, channel, and risk category.
Total Loan Amount by Loan Purpose shows why borrowers are taking loans and which purposes drive the highest disbursement amount. It can support product planning and borrower education programs.
Total Outstanding by Borrower Type shows where unpaid exposure is concentrated by customer group. This helps portfolio teams understand which borrower types need closer monitoring.
Total Loan Amount by Channel compares disbursement value across origination channels. Digital lenders can use this chart to compare app, branch, agent, partner, or online channels.
Total Loan Amount by Risk Category shows how much lending volume falls into each risk group. It gives risk teams a quick way to compare growth against risk appetite.
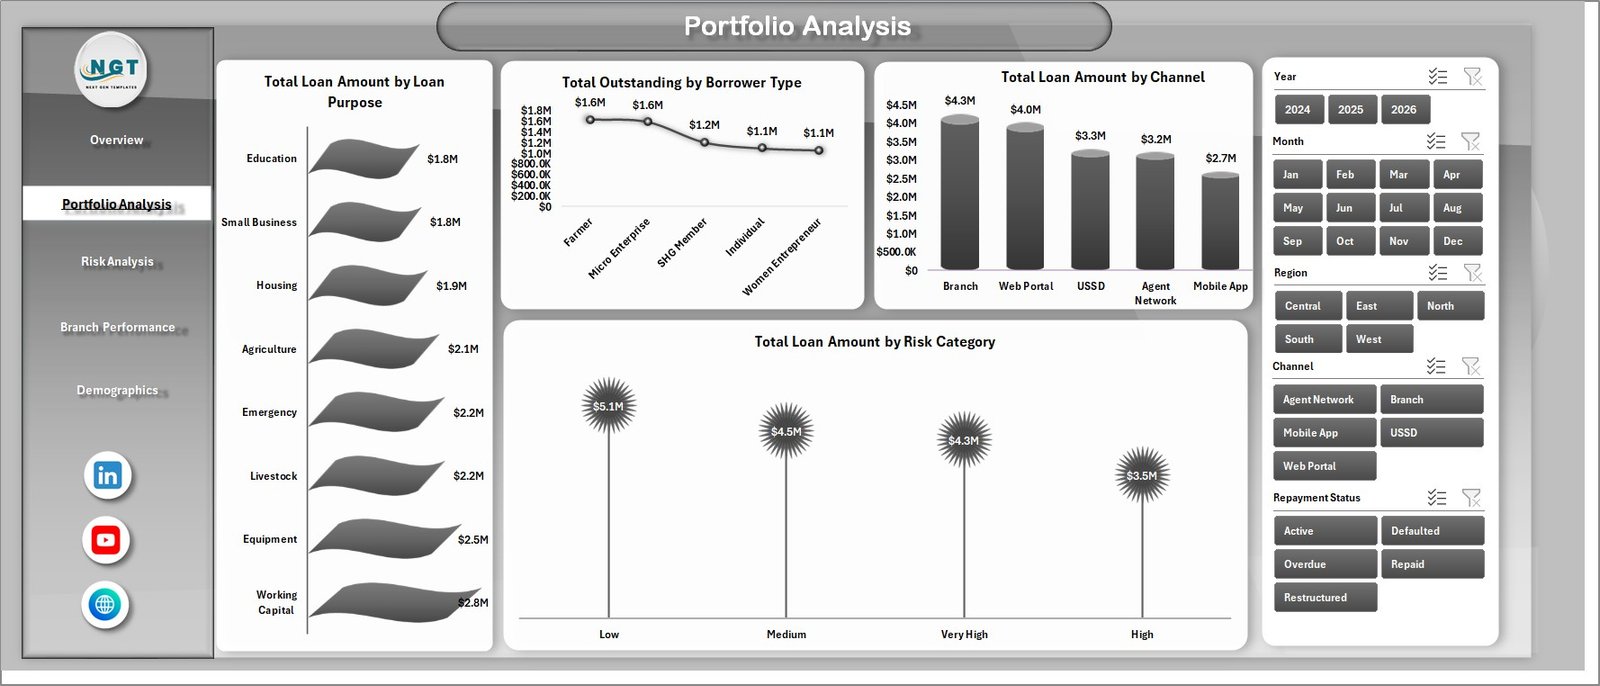
Portfolio Analysis
3 – Risk Analysis
The Risk Analysis page focuses on default, outstanding balance, repayment status, and branch-level exposure.
Default % by Risk Category helps confirm whether higher-risk groups are behaving as expected. If a low-risk category shows unexpected default %, it may require underwriting review.
Total Outstanding by Repayment Status separates the outstanding balance by current repayment state. It helps prioritize follow-up based on unpaid exposure.
Total Loans by Risk Category counts the number of loans in each risk group. This chart is useful for seeing whether the portfolio is becoming more conservative or more risk-heavy.
Total Loan Amount by Branch compares lending value across branches. Branch managers can use it to review growth, capacity, and portfolio quality together.
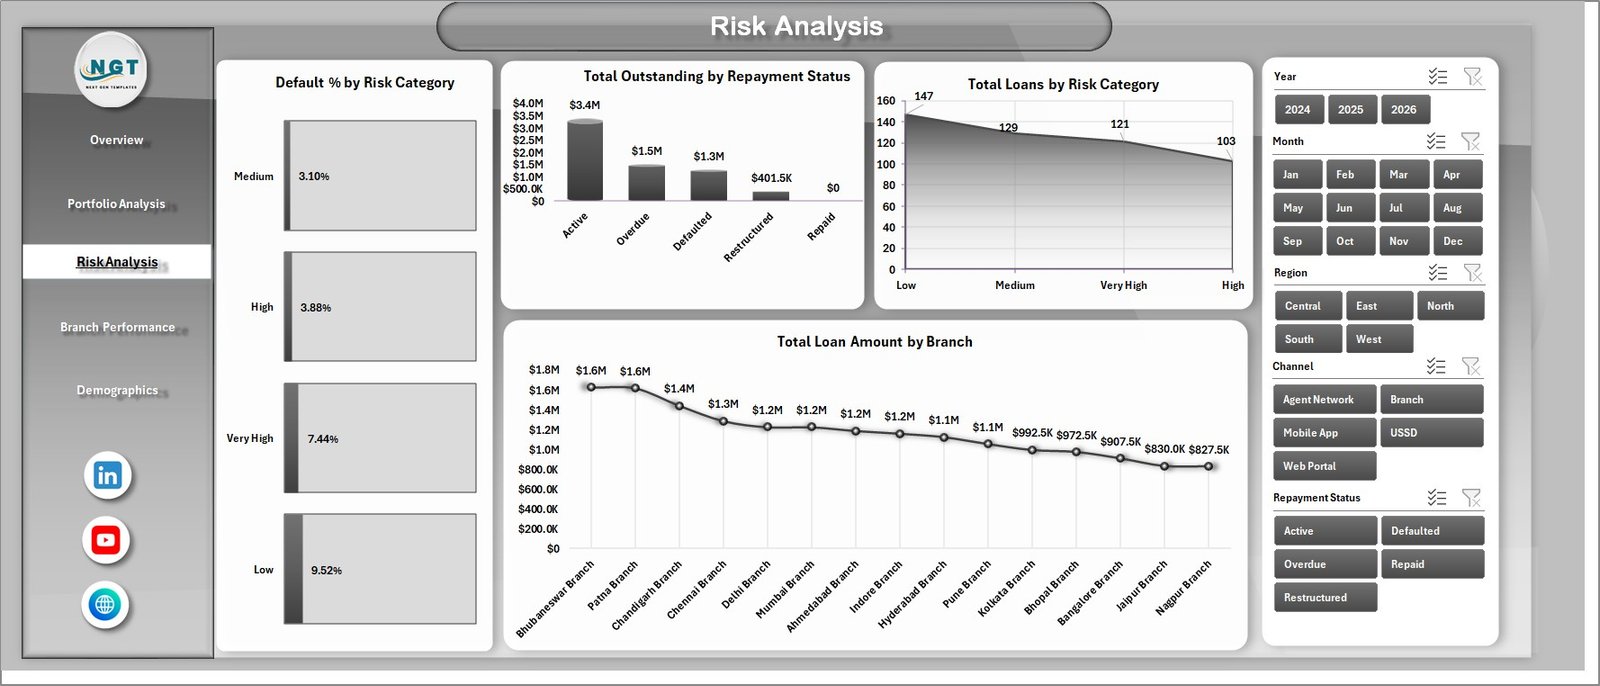
Risk Analysis
4 – Branch Performance
The Branch Performance page is built for branch managers and operations leaders who want to compare branch output, borrower mix, repayment by officer, and loan officer volume.
Total Loans by Branch shows the number of loans managed by each branch. It helps compare branch activity and workload.
Total Loan Amount by Gender shows how lending amount is distributed by borrower gender. This can support inclusion reporting and product outreach decisions.
Repayment % by Loan Officer compares collection effectiveness across officers. It helps identify coaching opportunities and recognize strong field performance.
Total Loan Amount by Loan Officer compares managed lending volume by officer. Used with repayment %, it gives a balanced view of volume and quality.
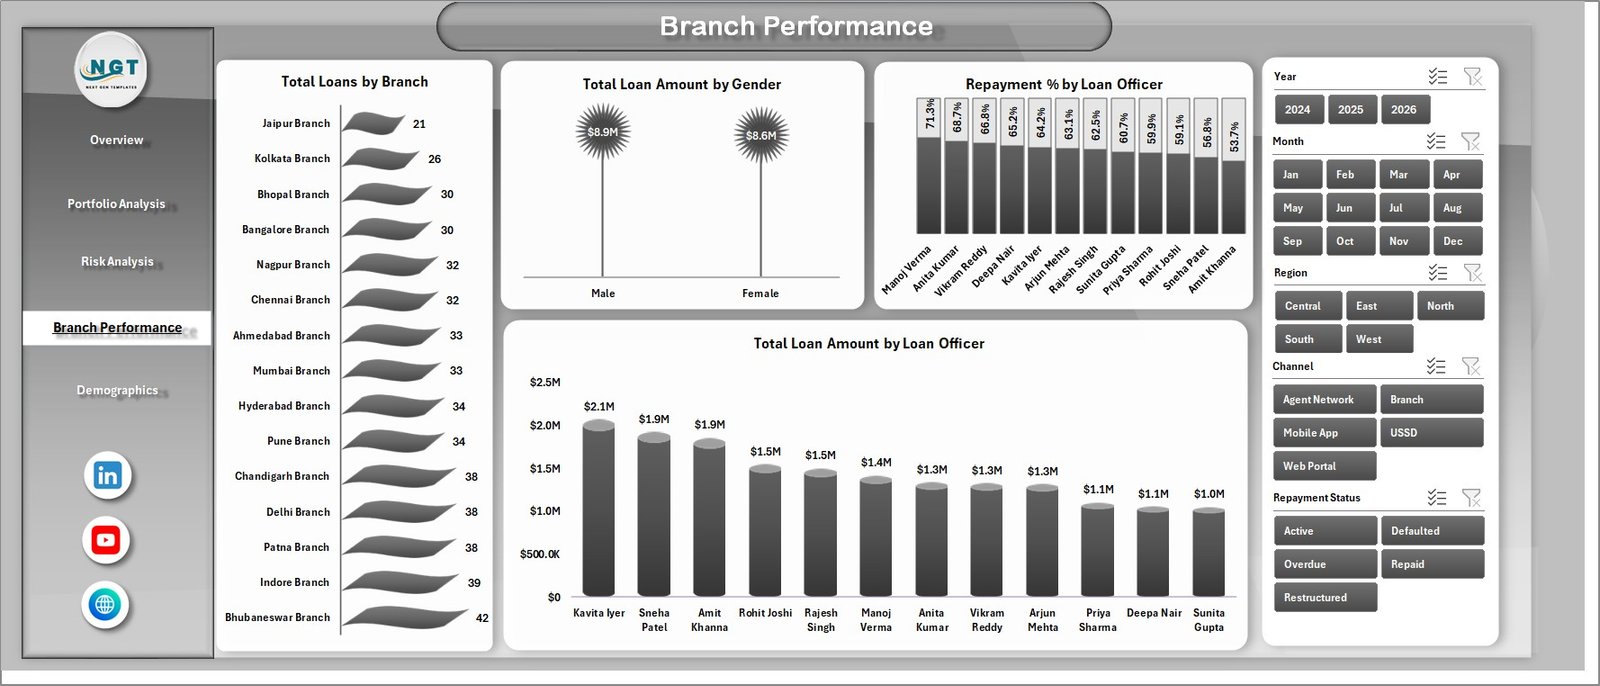
Branch Performance
5 – Demographics
The Demographics page helps the team understand borrower composition and repayment behavior.
Avg. Loan Size by Borrower Type compares average ticket size across borrower groups. It can help identify whether certain borrower types need different limits or product structures.
Repayment % by Gender compares repayment behavior by gender. This can be useful for inclusion reporting, borrower support programs, and portfolio review.
Total Loans by Loan Purpose shows loan count by use case. It helps separate high-volume purposes from high-value purposes seen on the Portfolio Analysis page.
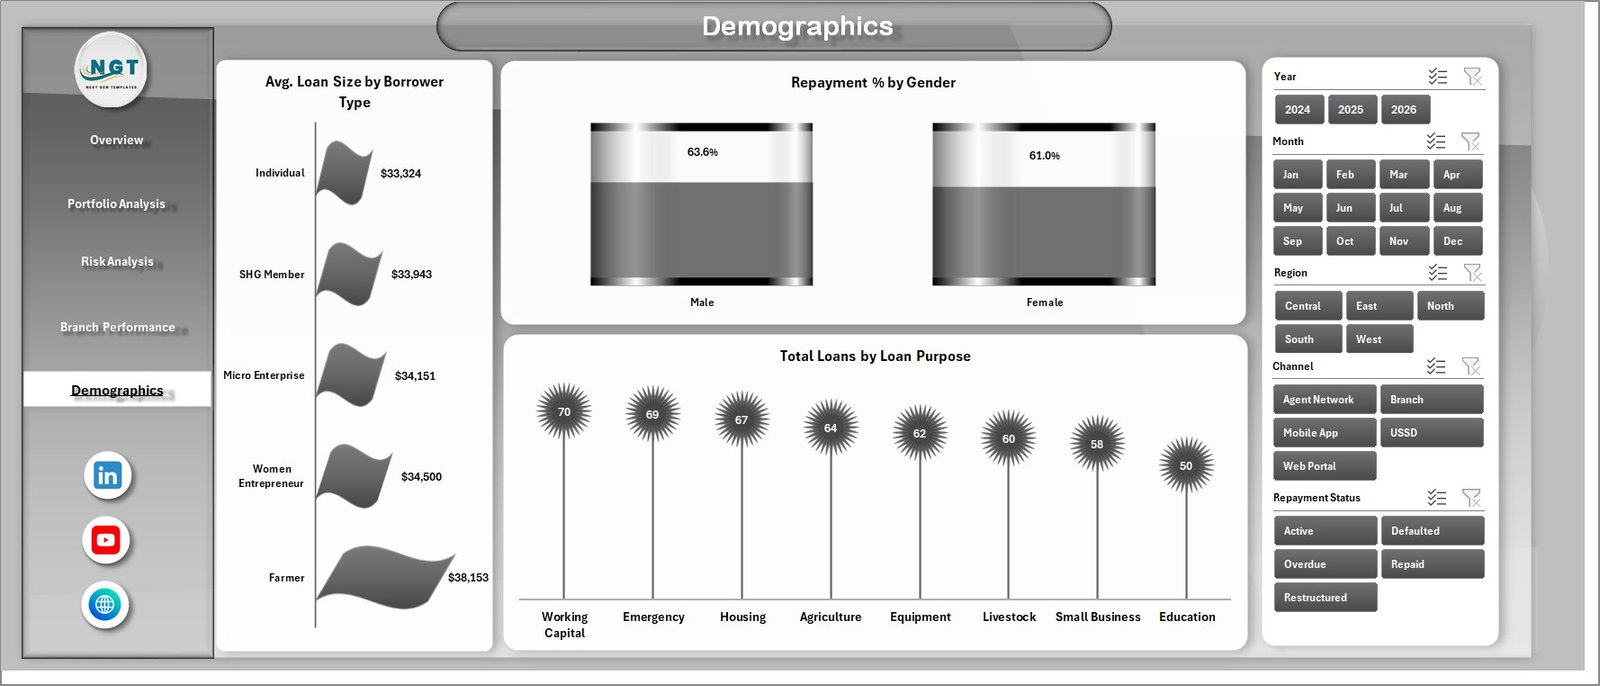
Demographics
6 – Data Sheet Tab
The Data sheet is the input table for the workbook. Add your own microloan records in the same format as the sample data and keep the existing headers. Once the data is updated, refresh the workbook so the pivots and charts use the latest records.
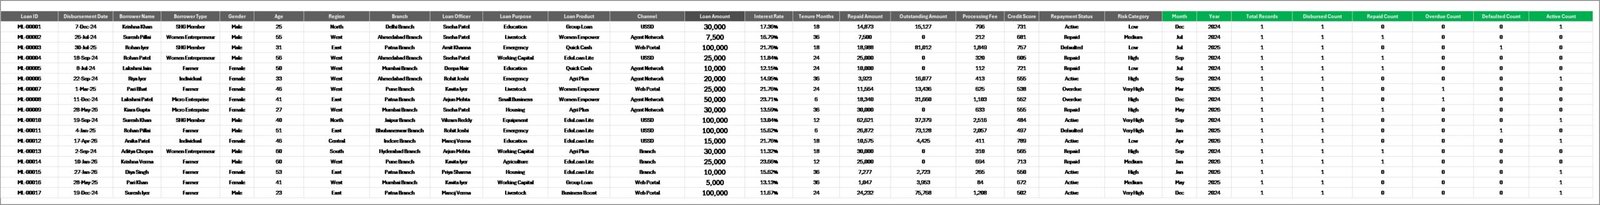
Data Sheet tab
7 – Support Sheet Tab
The Support sheet contains the pivot tables used to create the dashboard dynamically. After updating the Data sheet, go to the Data tab in the Excel Ribbon and click Refresh All. The pivots and charts will refresh together. You can keep this sheet hidden when sharing the workbook with end users.
Support sheet tab
Digital Microloans Dashboard in Excel vs. Google Sheets vs. Paid CRM/SaaS – Feature Comparison
| Feature | Digital Microloans Dashboard in Excel | Google Sheets tracker | Paid lending SaaS |
|---|---|---|---|
| Cost | $17.99 one-time | Free to low-cost, but needs manual build | Monthly or annual subscription |
| Platform | Microsoft Excel | Browser spreadsheet | Vendor-hosted system |
| Setup time | Under 10 minutes | 30 minutes to several hours | Days or weeks |
| Offline access | Yes | Limited | No |
| Customizable fields | Yes, editable workbook | Yes, manual setup | Depends on plan |
| Dashboard charts | 19 included | Build manually | Included at higher cost |
| Year-1 cost at 5 users | $17.99 total | $0 plus build time | Often hundreds or thousands |
Who Should Use This Template
This template is useful for microfinance institutions, digital lending startups, NGO finance programs, cooperative lending teams, field operations managers, branch managers, loan officers, finance analysts, portfolio managers, and consultants who prepare loan portfolio reports in Excel.
It is not intended to replace a full loan origination system, core banking system, repayment collection app, borrower communication workflow, or live API-connected BI platform.
Real-World Use Cases
Asha manages a microfinance portfolio across 6 regions. She updates the Data sheet monthly, refreshes the workbook, and uses Total Repaid by Region plus Default % by Risk Category to prepare her management review.
Daniel works at a digital lending startup. He uses Total Loan Amount by Channel and Total Loans by Repayment Status to compare acquisition channels and see whether new digital channels are producing healthy repayment behavior.
Meera supervises branch loan officers. She reviews Repayment % by Loan Officer and Total Loan Amount by Loan Officer before coaching sessions so that performance discussions are based on data rather than only activity reports.
Advantages of Digital Microloans Dashboard in Excel
The main advantage is speed. You do not need to create a new workbook structure, build charts, design slicers, or connect every visual to a pivot table from scratch. The pages are already organized around the questions lending teams usually ask: how much was disbursed, how much is outstanding, how much was repaid, where are defaults, which branches are growing, and which borrower segments matter most.
The second advantage is control. Because the dashboard is built in Excel, you can adjust labels, colors, chart types, formulas, and pivot tables according to your reporting style.
Opportunities for Improvement
This dashboard is a file-based reporting tool, so it does not provide live database sync, automatic borrower reminders, mobile data collection, or role-based web access. Larger institutions may want to connect their loan management system to Power BI or a dedicated database. Smaller teams, however, often need a practical Excel reporting layer first, and that is where this template fits well.
Best Practices
Keep the Data sheet headers unchanged, validate dates and amount fields before refreshing, and maintain consistent names for branches, officers, regions, borrower types, and loan products. After adding new data, use Data > Refresh All and review slicers to make sure new values appear. Keep a clean backup copy before making major layout changes.
Explore Relevant Templates
You may also like Microfinance Institutions Dashboard in Excel, Buy-Now-Pay-Later Platforms Dashboard in Excel, Credit Union Dashboard in Excel, and Buy-Now-Pay-Later Platforms Dashboard in Power BI. Browse more Excel Dashboard Templates on NextGenTemplates.
Frequently Asked Questions
What KPIs are included in the Digital Microloans Dashboard in Excel?
The Overview page includes Total Loan Amount, Total Loans, Total Outstanding, Total Repaid, and Default %. Additional pages include portfolio, risk, branch, officer, and borrower demographic analysis.
Does this dashboard require macros?
No. It uses standard Excel sheets, pivot tables, slicers, and charts.
How do I update the dashboard?
Replace the sample data in the Data sheet, keep the same format, and click Data > Refresh All in the Excel Ribbon.
Can I add my own branches and loan officers?
Yes. Add them as values in the Data sheet and refresh the workbook. The pivots and slicers will include the new values.
Is this dashboard suitable for digital lending startups?
Yes. It is useful for startups that want Excel-based portfolio reporting by channel, risk, branch, borrower type, repayment status, and officer.
Can this replace lending software?
No. It is an analysis dashboard, not a loan origination, repayment collection, or borrower communication system.
About the Author
Built by PK – Microsoft Certified Professional with 15+ years of Excel, Google Sheets, and Power BI experience. Founder of NextGenTemplates, reaching 300K+ subscribers across YouTube channels. Every template is hand-built and tested before release.
Conclusion
The Digital Microloans Dashboard in Excel helps microfinance and digital lending teams turn structured loan data into clear portfolio reporting. With 5 KPI cards, 19 analysis charts, multiple slicers, a Data sheet, and a Support sheet, it gives teams a practical way to monitor lending volume, repayment, outstanding balances, default %, branch performance, and borrower demographics in Excel.
Visit YouTube.com/@PKAnExcelExpert for Excel tutorials and dashboard walkthroughs.