Food Trucks Dashboard in Excel helps mobile food businesses turn daily sales records into clear operating decisions. Food truck operators often manage several moving parts at once: event type, city, region, cuisine, truck name, service window, order volume, operating cost, average ticket, and customer rating. When these numbers sit in separate files or POS exports, it becomes hard to see which route, menu, truck, or month is actually working.
This Excel dashboard brings those moving parts into one pivot-driven workbook with 5 analysis pages, KPI cards, charts, slicers, a data sheet, and a support sheet. Replace the sample records with your own, click Refresh All, and the dashboard updates without rebuilding formulas or charts. You can also learn more about Excel pivots from Microsoft Support’s PivotTable guide.
Click here to purchase Food Trucks Dashboard in Excel
Food Trucks Dashboard in Excel
Key Features of Food Trucks Dashboard in Excel
- 5 dashboard pages: Overview, Sales Trend, Truck Analysis, Menu Insights, and Location Mix.
- 5 KPI cards: Total Revenue, Total Orders, Total Operating Cost, Average Ticket, and Average Customer Rating.
- Interactive slicers: Filter dashboard views by available business fields such as truck, month, region, cuisine, city, event type, and service window.
- Pivot-driven charts: Analyze profit, revenue, order count, operating cost, payment method, customer rating, and location mix.
- Data sheet included: Replace the sample data with your own records while keeping the same column structure.
- No VBA required: The workbook uses native Excel features such as pivot tables, charts, slicers, and formulas.
- One-time purchase: Use it as a reusable reporting template without a monthly SaaS subscription.
Dashboard Pages Explanation
1. Overview Page
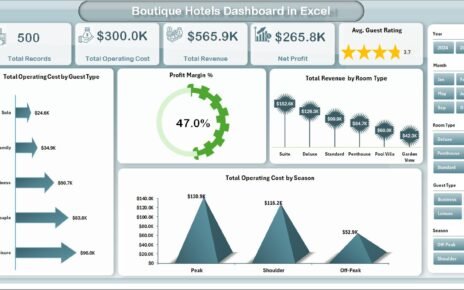
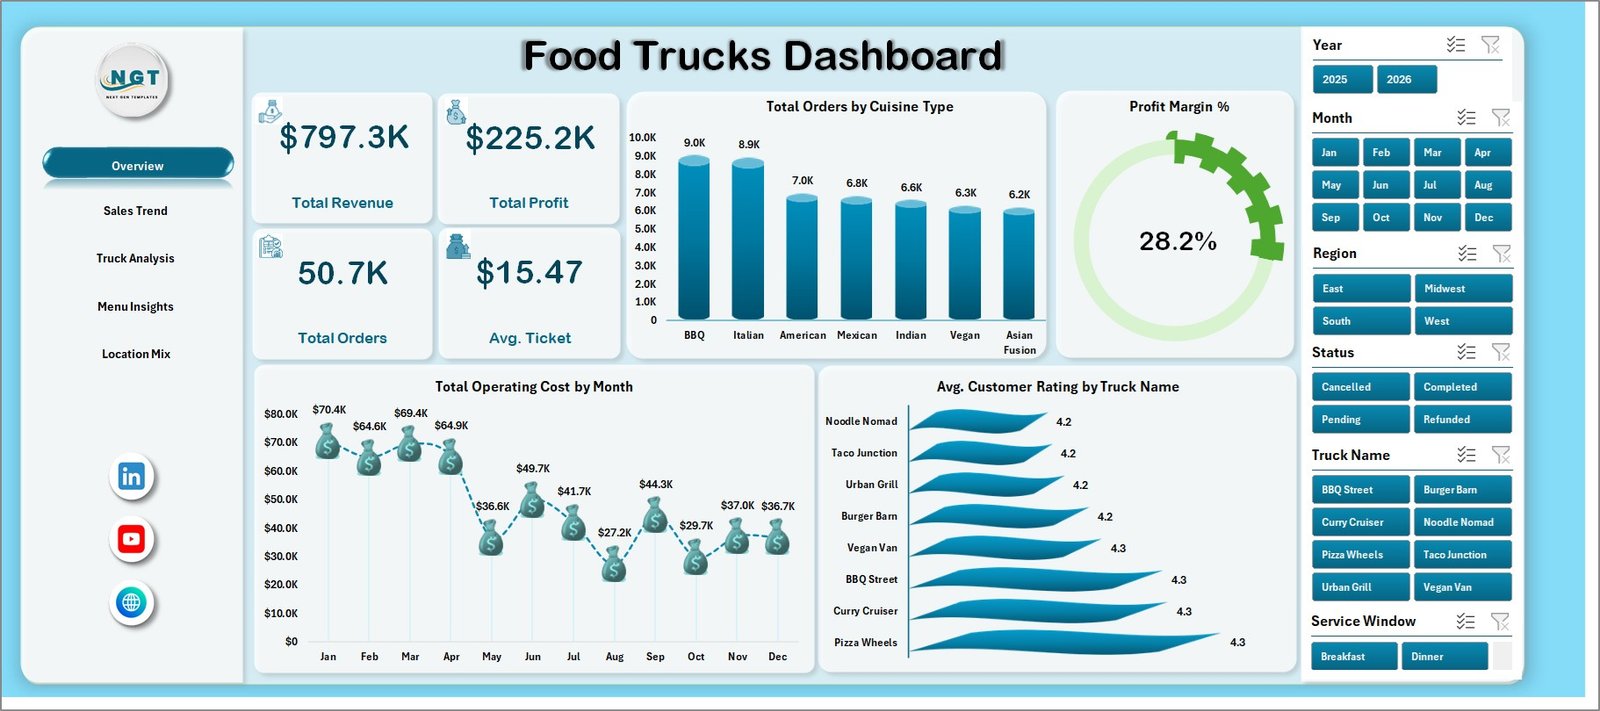
The Overview page shows the top-line food truck business numbers in one place. The card section includes Total Revenue, Total Orders, Total Operating Cost, Average Ticket, and Average Customer Rating. These metrics answer the first questions most owners ask: how much did we sell, how many orders did we serve, what did it cost, how much did customers spend per order, and how satisfied were they?
Total Profit by Region compares profitability across operating regions, which helps identify stronger markets. Total Orders by Cuisine Type shows demand by cuisine and supports menu planning. Total Operating Cost by Month Name reveals monthly cost movement, useful for spotting seasonal increases or months where margins need attention.
Overview Page
2. Sales Trend
The Sales Trend page focuses on margin and time-based revenue behavior. Profit Margin by Event Type compares how profitable different event formats are after cost, so owners can prioritize the event types that produce better returns.
Total Revenue by Service Window shows when customers buy most, such as lunch, dinner, late-night, or event windows. Total Profit by Month Name tracks monthly profitability and helps with inventory planning, labor planning, and seasonal promotions.
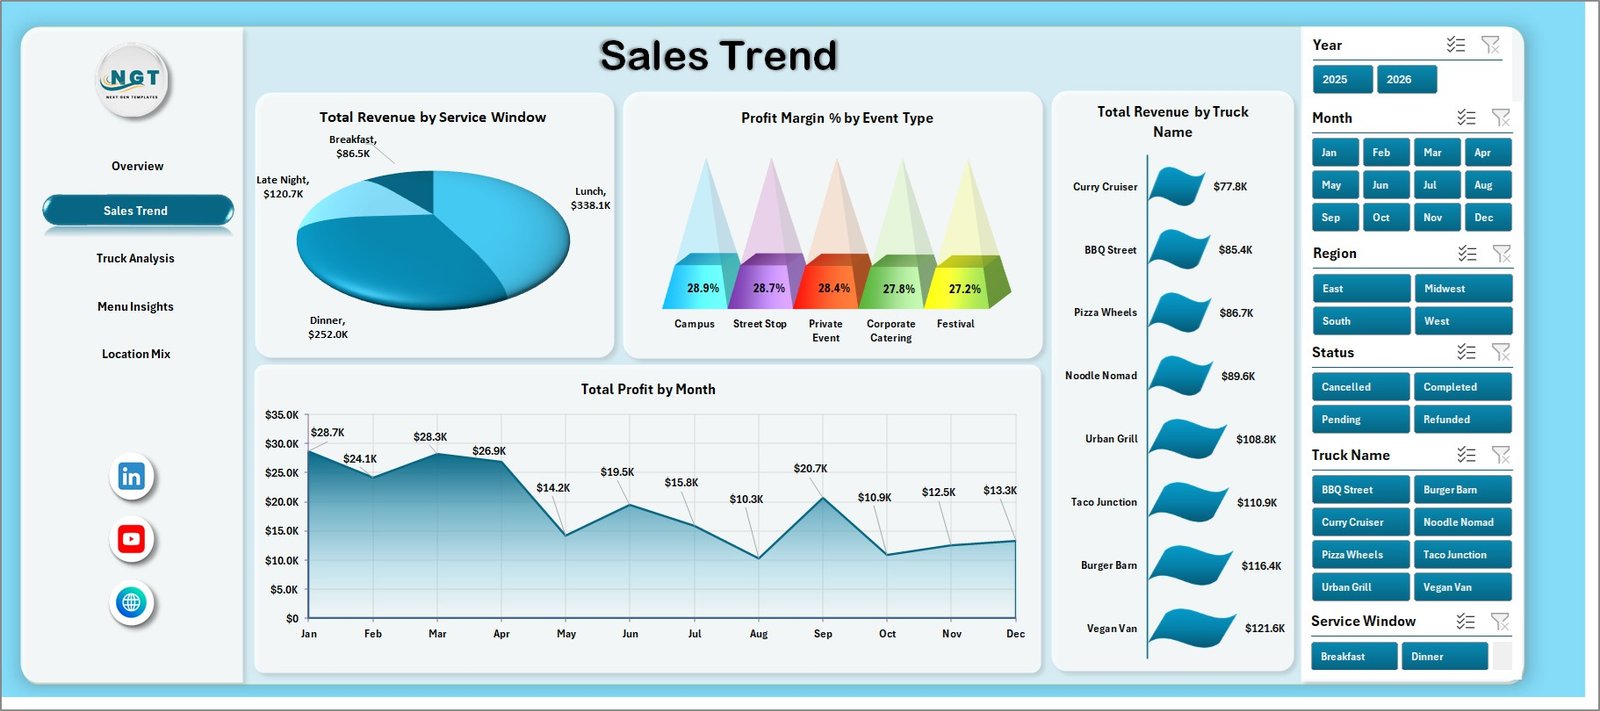
Sales Trend
3. Truck Analysis
The Truck Analysis page is useful for operators managing more than one truck. Total Revenue by Event Type shows which event categories contribute the most revenue, helping the business understand where each truck should be deployed.
Total Operating Cost by Cuisine Type helps identify cuisine lines that are more expensive to operate. Total Orders by Truck Name compares order volume by truck, which can reveal staffing needs, truck-level demand, or operational bottlenecks.
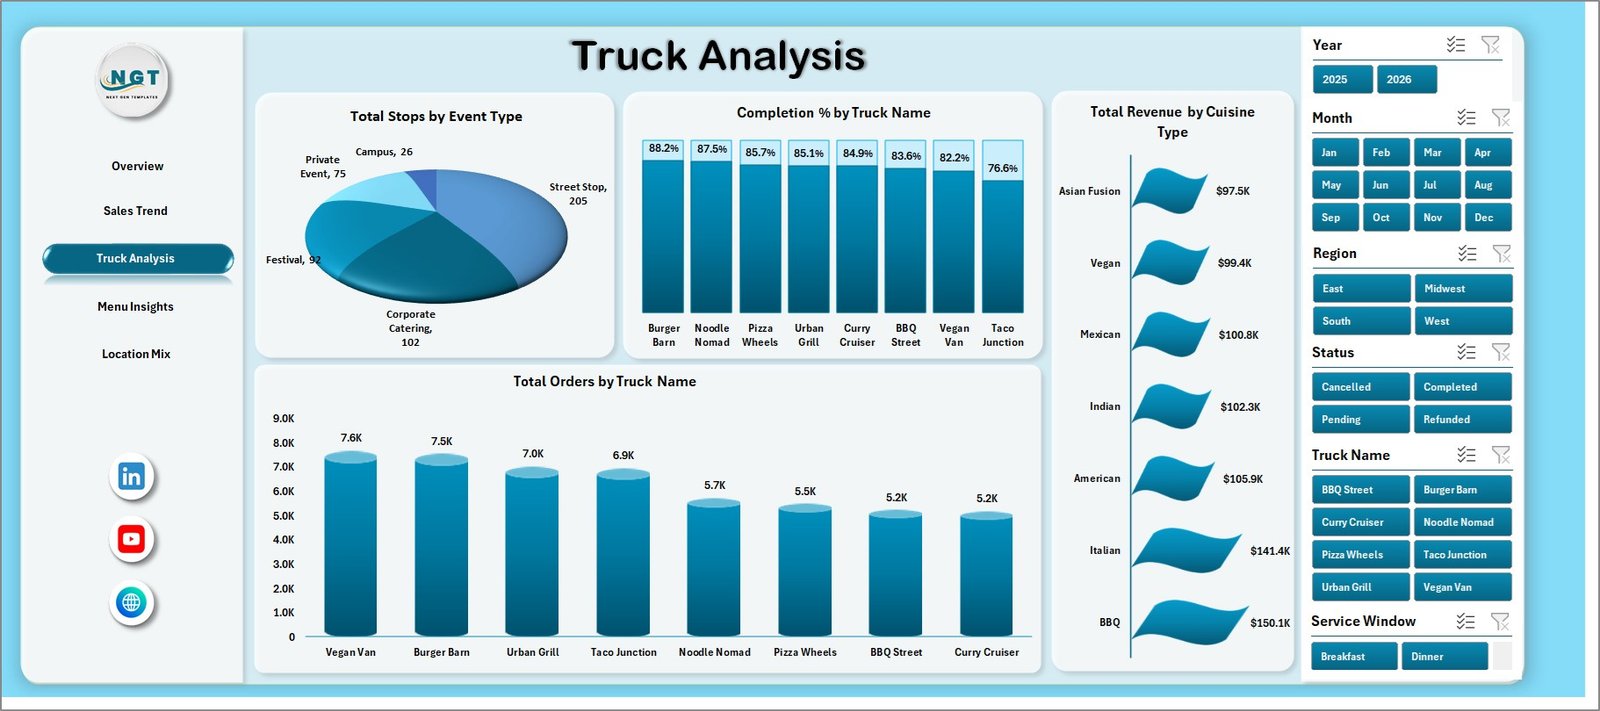
Truck Analysis
4. Menu Insights
The Menu Insights page connects menu decisions with customer behavior. Total Orders by Menu Category shows which menu groups drive the highest volume, helping teams prepare inventory and simplify offerings.
Total Revenue by Payment Method shows the payment mix across the business. Average Customer Rating by Cuisine Type helps identify cuisine categories that customers enjoy most and where quality improvements may be needed.
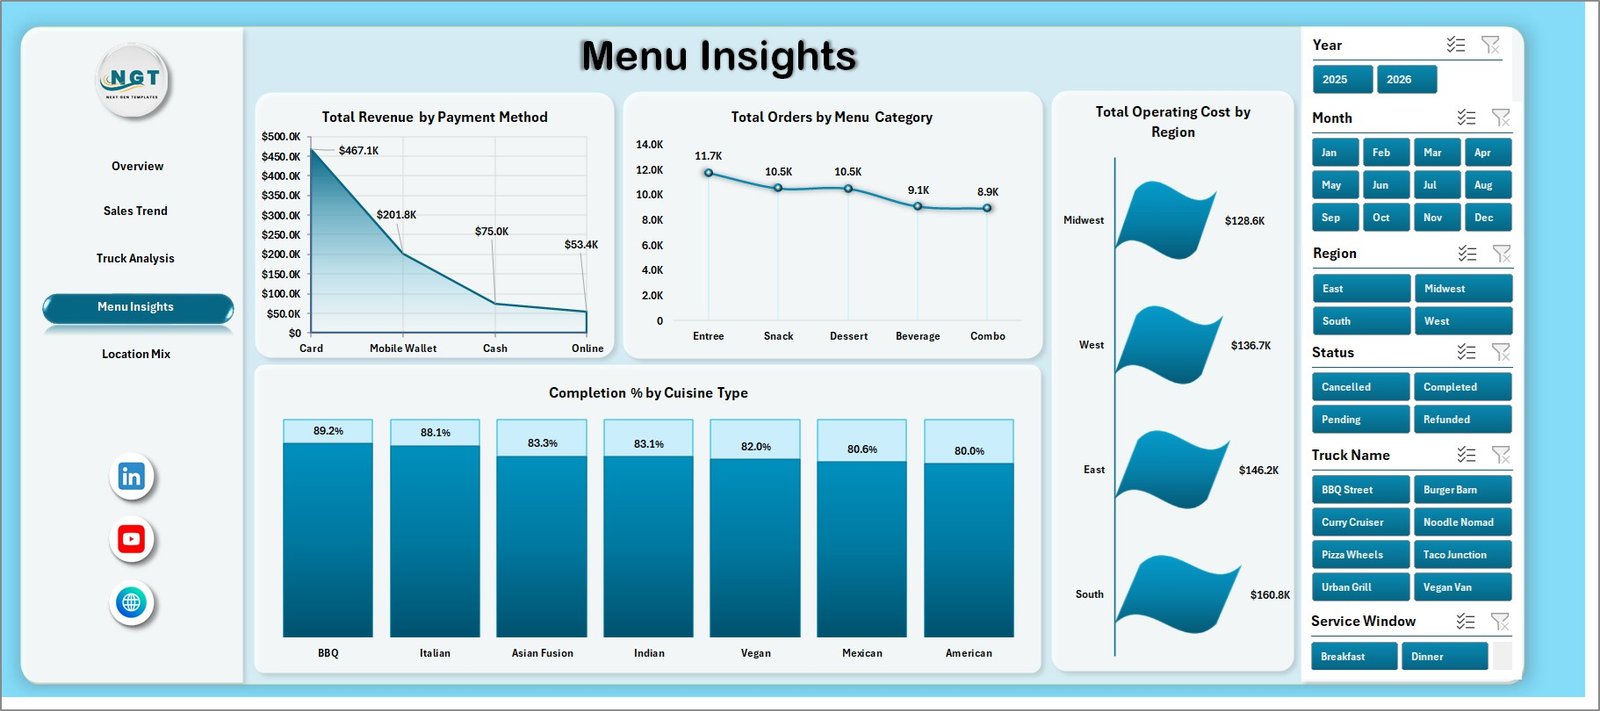
Menu Insights
5. Location Mix
The Location Mix page helps turn city and region data into better route decisions. Average Ticket by Region shows where customers spend more per order, which can influence pricing, menu mix, and event selection.
Total Orders by City compares demand across cities. Total Revenue by Month Name gives a monthly sales trend, so owners can separate temporary spikes from repeatable seasonal patterns.
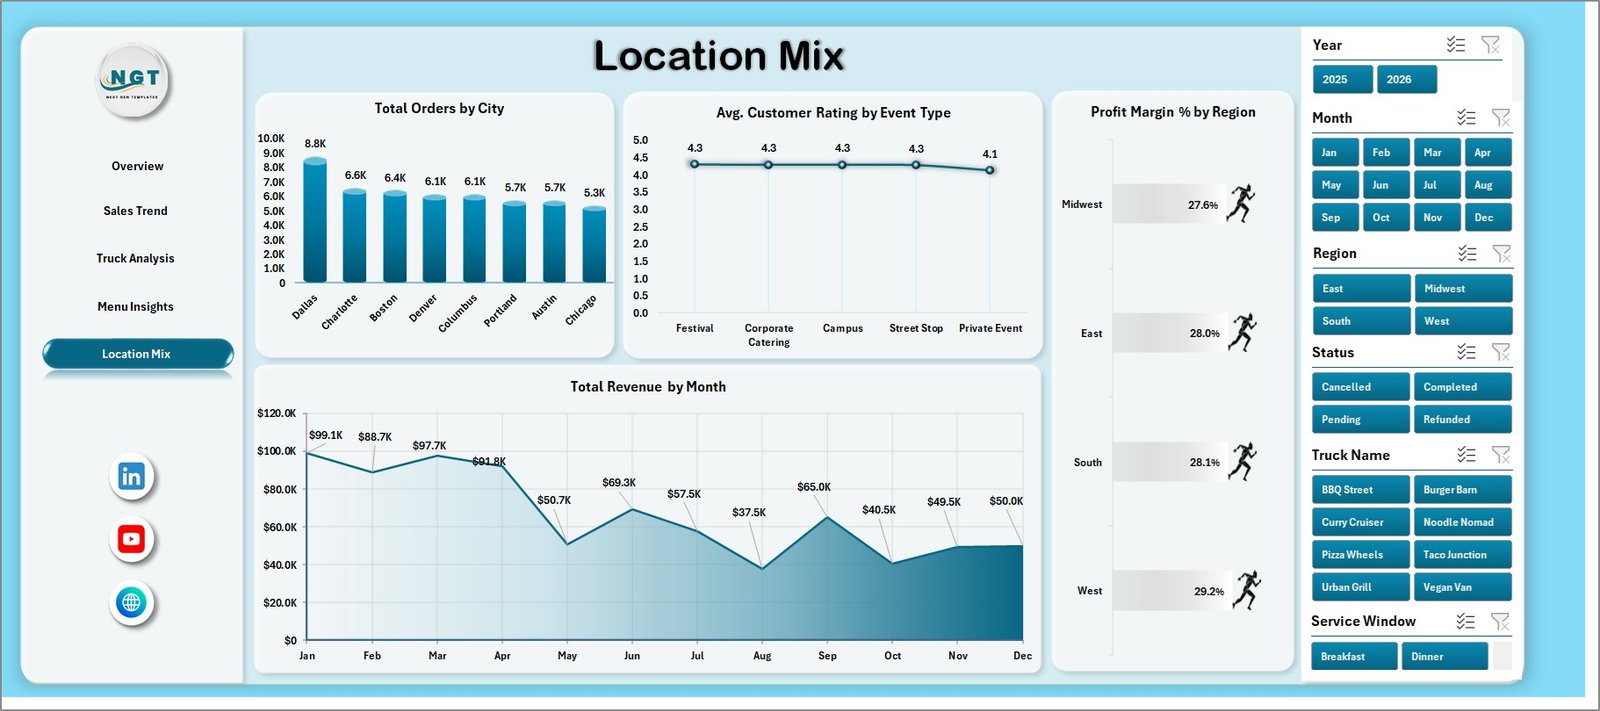
Location Mix
6. Data Sheet
The Data Sheet is where the source records are stored. Add your own transactions in the same structure as the sample data, then refresh the workbook. The dashboard pages, cards, charts, and slicers read from this source table.
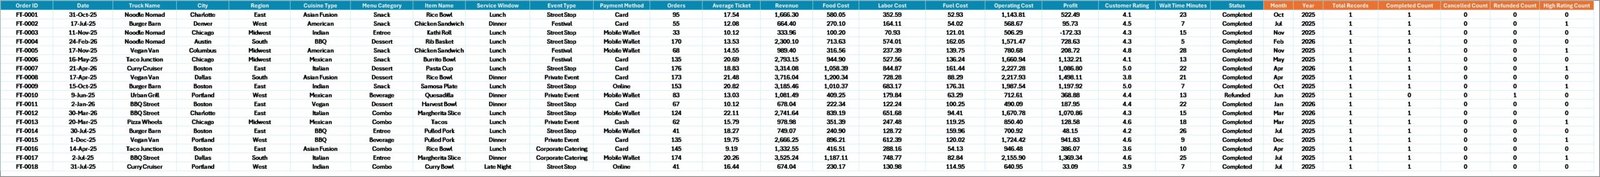
Data Sheet tab
7. Support Sheet
The Support sheet contains the pivot tables that power the dashboard. After updating the Data Sheet, go to the Excel Data tab and click Refresh All. The support sheet can remain hidden while users work with the dashboard pages.
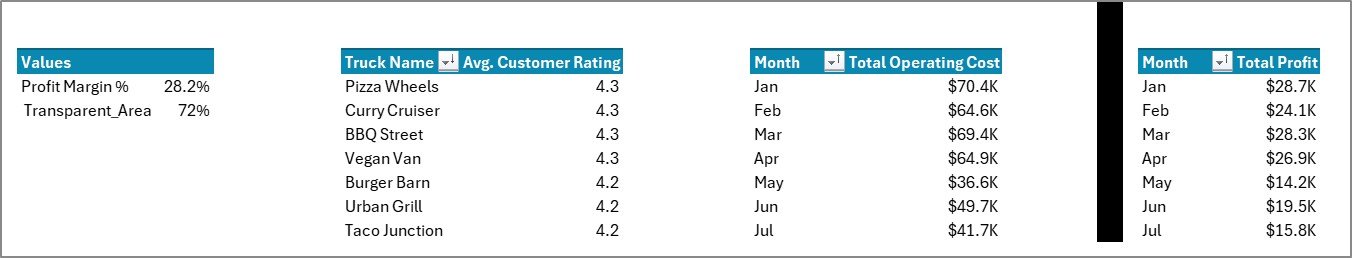
Support Sheet tab
Food Trucks Dashboard in Excel vs. Google Sheets vs. Paid Restaurant SaaS – Feature Comparison
| Feature | Food Trucks Dashboard in Excel | Google Sheets Alternative | Paid Restaurant SaaS |
|---|---|---|---|
| Cost | $17.99 one-time | Template cost or shared sheet setup | Monthly subscription |
| Platform | Microsoft Excel | Browser-based Google Sheets | Vendor-hosted cloud |
| Setup time | Replace data and refresh | Copy sheet and replace data | Onboarding and configuration |
| Real-time team collaboration | Possible with OneDrive | Native collaboration | Built in |
| Mobile access | Excel app or browser | Google Sheets app | Vendor app |
| Customizable fields | Editable workbook | Editable spreadsheet | Limited by plan |
| Share with link | OneDrive or SharePoint | Google Drive link | Built in |
| Food truck-specific analysis | Truck, cuisine, city, region, event, and service window | Possible with setup | Depends on vendor |
| Year-1 cost at 5 users | $17.99 plus Excel access | Template cost plus Google access | Often hundreds or thousands of dollars |
Who Should Use This Template
This template is useful for single-truck owners, food truck fleets, event catering teams, street food vendors, mobile coffee businesses, food market operators, and analysts who report on mobile food sales in Excel. It is especially helpful when you already export data from a POS or order system and need a clean reporting layer.
Real-World Use Cases
Maria runs two taco trucks. She checks Total Orders by Truck Name and Average Ticket by Region every week to decide which truck should serve premium locations.
Daniel manages event bookings. He uses Profit Margin by Event Type to choose between weekend markets, corporate lunch bookings, private events, and festivals.
Aisha handles menu performance. She reviews Total Orders by Menu Category and Average Customer Rating by Cuisine Type before changing seasonal menu items.
Advantages of Food Trucks Dashboard in Excel
- It keeps revenue, cost, orders, ticket value, and ratings in one workbook.
- It gives owners a quick view of region, city, event, cuisine, and truck performance.
- It works with standard Excel features, so users do not need VBA skills.
- It can be reused every month by replacing the Data Sheet records and refreshing pivots.
- It provides a low-cost reporting option compared with paid restaurant analytics platforms.
Opportunities for Improvement
Teams can expand the workbook by adding weather, staffing hours, fuel cost, inventory, customer segment, and POS channel fields. Larger fleets may also connect the workbook to Power Query or a central database to reduce manual data preparation.
Best Practices
- Keep the Data Sheet column structure consistent.
- Refresh all pivots after every data update.
- Review Overview weekly and the deeper pages monthly.
- Compare profit with order volume before changing routes.
- Use customer rating trends alongside revenue, not as a separate metric.
- Keep a backup copy before making major workbook changes.
Explore Relevant Templates
You may also like Food Truck Dashboard in Excel, Food Truck Dashboard in Power BI, Food Delivery Dashboard in Google Sheets, and Restaurants & Food Services KPI Dashboard in Excel.
Frequently Asked Questions
What is Food Trucks Dashboard in Excel?
It is an Excel dashboard template for tracking food truck revenue, orders, operating cost, average ticket, customer ratings, truck performance, menu insights, and location mix.
Can I use my own data?
Yes. Replace the sample records in the Data Sheet while keeping the same column layout, then refresh the workbook.
Does the dashboard include slicers?
Yes. The workbook includes slicers so you can filter the dashboard quickly by available business fields.
Do I need macros or VBA?
No. The template is built with native Excel pivots, charts, slicers, and formulas.
Is this useful for multiple trucks?
Yes. The Truck Analysis page includes Total Orders by Truck Name, and other pages help compare performance by region, city, cuisine, month, and event type.
Can this replace a POS system?
No. It is a reporting dashboard, not a POS, accounting, inventory, or staff scheduling system.
About the Author
Built by PK – Microsoft Certified Professional with 15+ years of Excel, Google Sheets, and Power BI experience. Founder of NextGenTemplates, reaching 300K+ subscribers across YouTube channels. Every template is hand-built and tested before release.
Conclusion
Food Trucks Dashboard in Excel gives mobile food businesses a practical way to review revenue, orders, operating cost, average ticket, customer ratings, menu demand, truck performance, and location mix. If your food truck data already lives in Excel or can be exported from another system, this template can become a repeatable weekly or monthly reporting file.
Click here to purchase Food Trucks Dashboard in Excel
Visit our YouTube channel for step-by-step Excel tutorials: Youtube.com/@PKAnExcelExpert