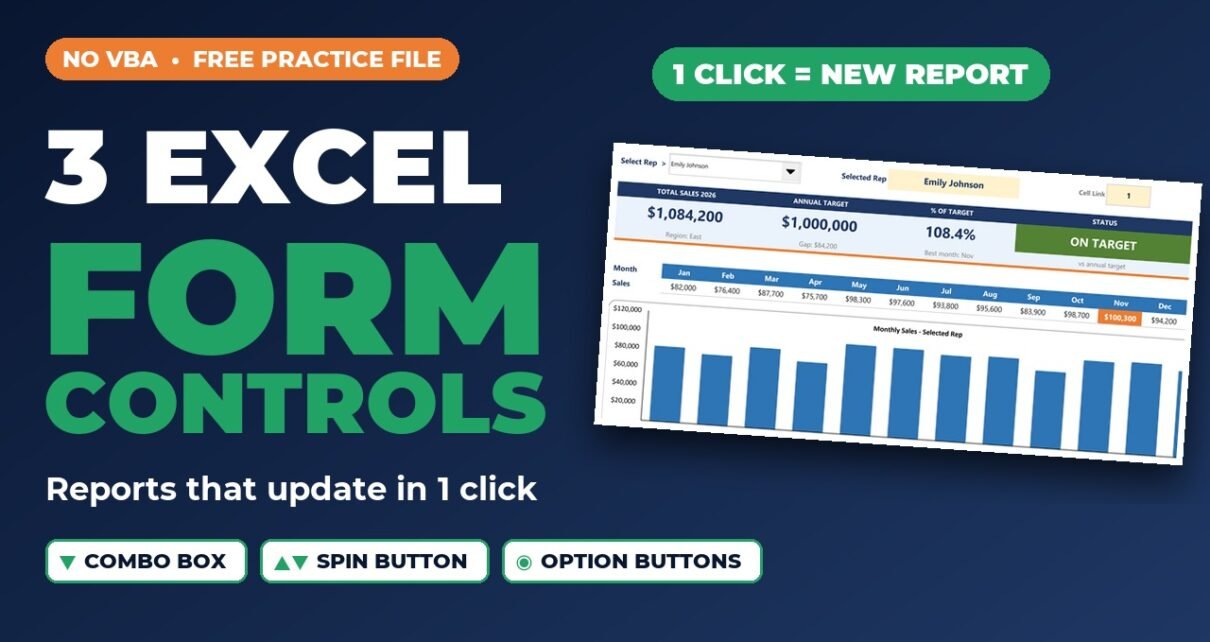
Excel form controls turn a static sheet into an interactive tool that anyone can use with a click. In this tutorial we solve three real business problems with the three most useful form controls: a Combo Box that builds a one-click Sales Rep Scorecard for 12 sales reps, Spin Buttons that turn a car loan into a live payment quote ($489.15 a month on $25,000 at 6.50% for 60 months), and Option Buttons inside Group Boxes that switch one regional report between 6 views. No VBA and no macros – the file stays a normal .xlsx workbook.
Most reports make people type. They scroll through long tables, retype the same inputs and copy the same chart six times. Form controls fix that: the user clicks, and every formula, card and chart on the sheet updates.
⬇️ Download the Free Practice File
Practice file + solution workbook · .zip · Excel 2007 or later
Watch the Video Tutorial
Video Overview
In this 11-minute video, PK first shows where form controls live (Developer › Insert) and the one idea behind all of them: a control never calculates anything, it only writes a number into its cell link. He then builds three tools. For the sales manager, a Combo Box linked to M8 lists 12 reps and an INDEX formula turns the position number into the rep’s name, so the KPI cards, the ON TARGET / BEHIND TARGET badge and the monthly chart update with one click. For a car dealership, three Spin Buttons control the amount financed, the loan term and the interest rate; because spin buttons only return whole numbers, the rate is linked to a helper cell and divided by 400. A PMT formula calculates the payment and a budget check turns from red to green when the term moves to 72 months. Finally, five Option Buttons in two Group Boxes drive a CHOOSE-based regional report for a vice president, switching Revenue, Units Sold and Gross Profit for 2025 and 2026 in one table and one chart.
What You Will Build
- 📋 Use Case 1 – Combo Box: a one-click Sales Rep Scorecard with Total Sales, Annual Target, % of Target, a green/red status badge and a monthly sales chart.
- 🚗 Use Case 2 – Spin Buttons: a Car Dealership Payment Quote with amount, APR and term buttons, a PMT payment, total interest and a budget check.
- 📊 Use Case 3 – Option Buttons + Group Boxes: a Regional VP Report that shows Revenue, Units Sold or Gross Profit for 2025 or 2026 in one table and one chart, with the top region highlighted.
- ⭐ Bonus: hide the helper cell links so the report looks clean.
Before You Start: Show the Developer Tab
All form controls live on the Developer tab. If you don’t see it, go to File › Options › Customize Ribbon and tick Developer. Then click Developer › Insert. The top half of the menu is Form Controls – the ones we use in this tutorial. They need no macros at all.
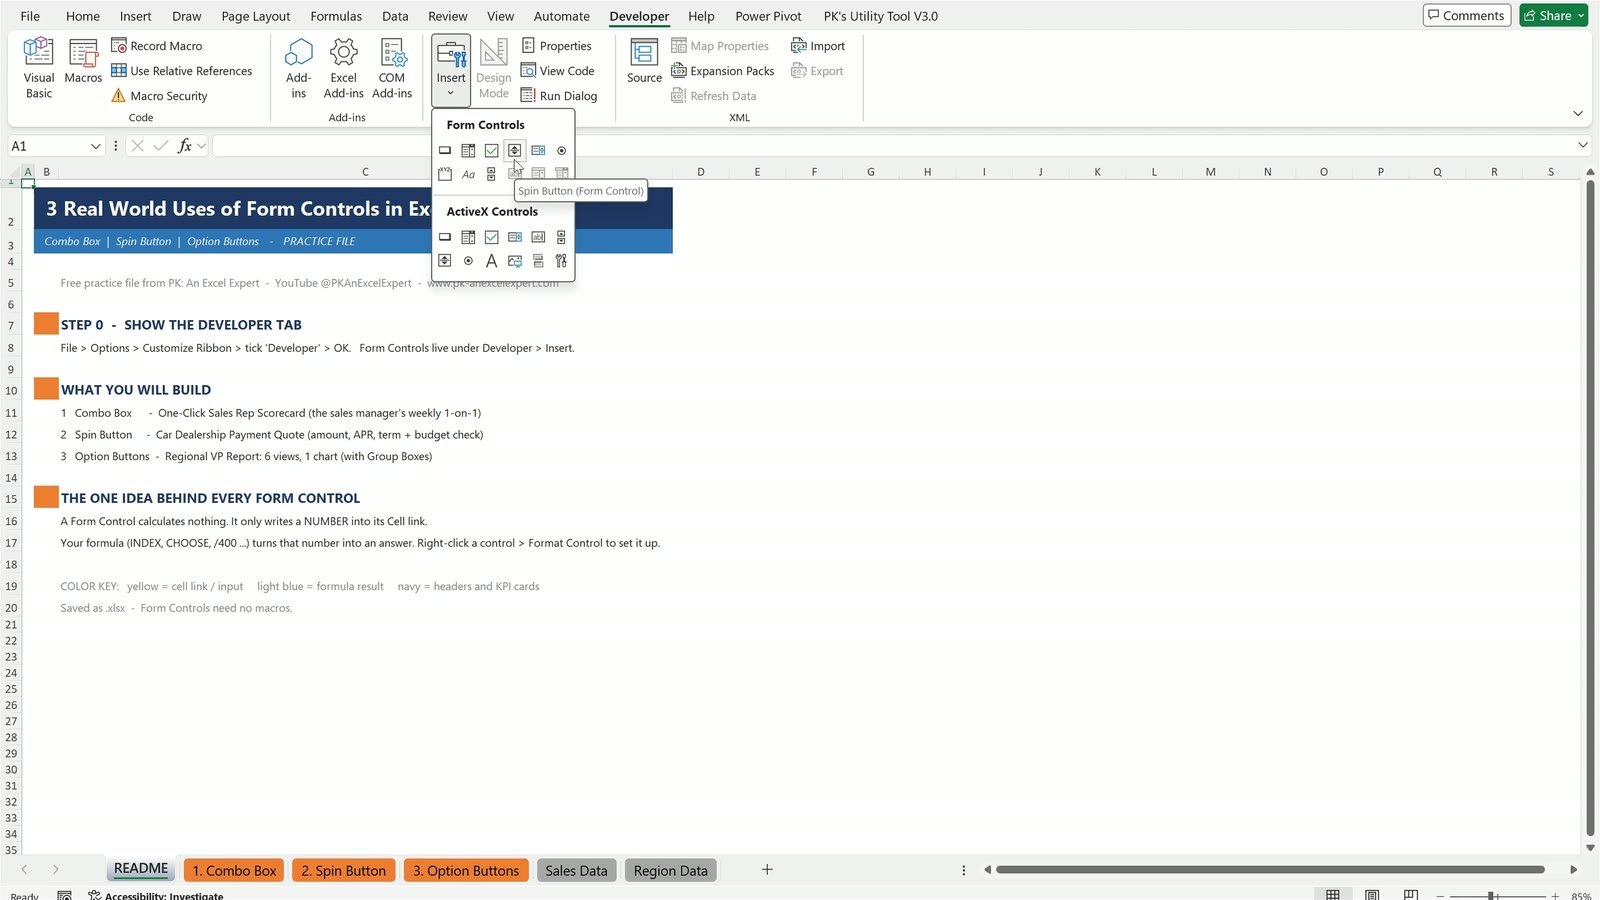
The one idea behind every form control: a control does not calculate anything. It only writes a number into one cell, called the cell link. Your formula reads that number, and the whole report reacts.
Use Case 1: One-Click Sales Rep Scorecard (Combo Box)
The business problem: every Monday a sales manager meets 12 sales reps and scrolls a table of monthly sales and annual targets to build the same scorecard by hand for each one-on-one.
Step 1: Draw the Combo Box
On the 1. Combo Box sheet, click Developer › Insert and pick the Combo Box (Form Control) – the second icon in the first row. Press and drag over cells C8:E8, next to Select Rep.
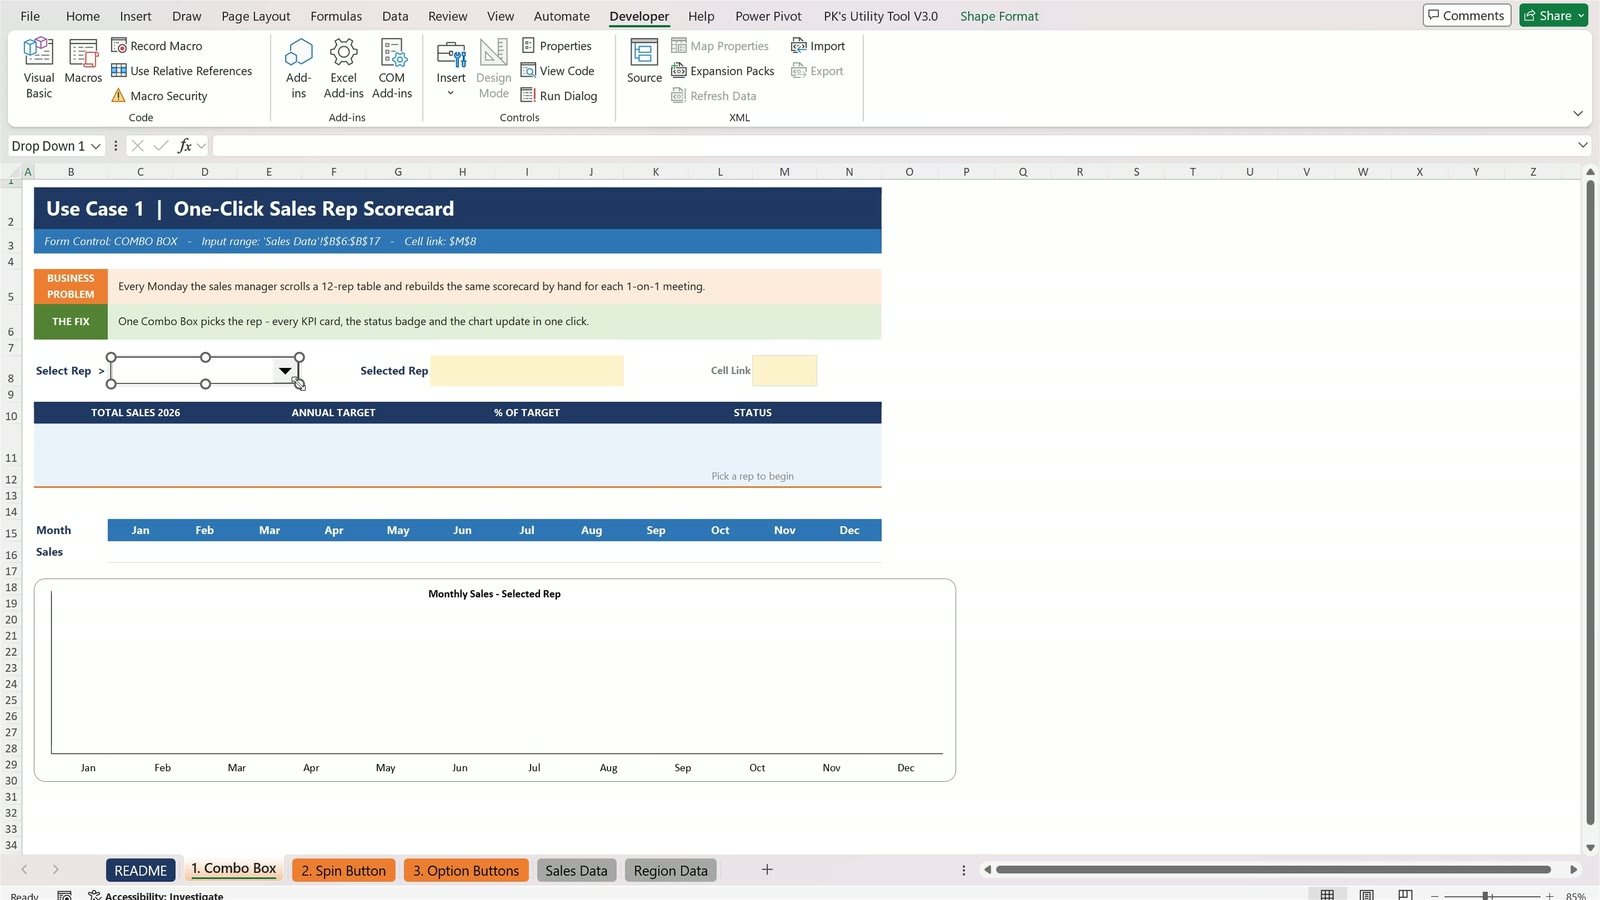
Step 2: Set the Input Range and Cell Link
Right-click the combo box and choose Format Control. On the Control tab enter:
- Input range:
'Sales Data'!$B$6:$B$17(the list of names) - Cell link:
$M$8(where the combo box writes its number) - Drop down lines:
12so every rep shows at once
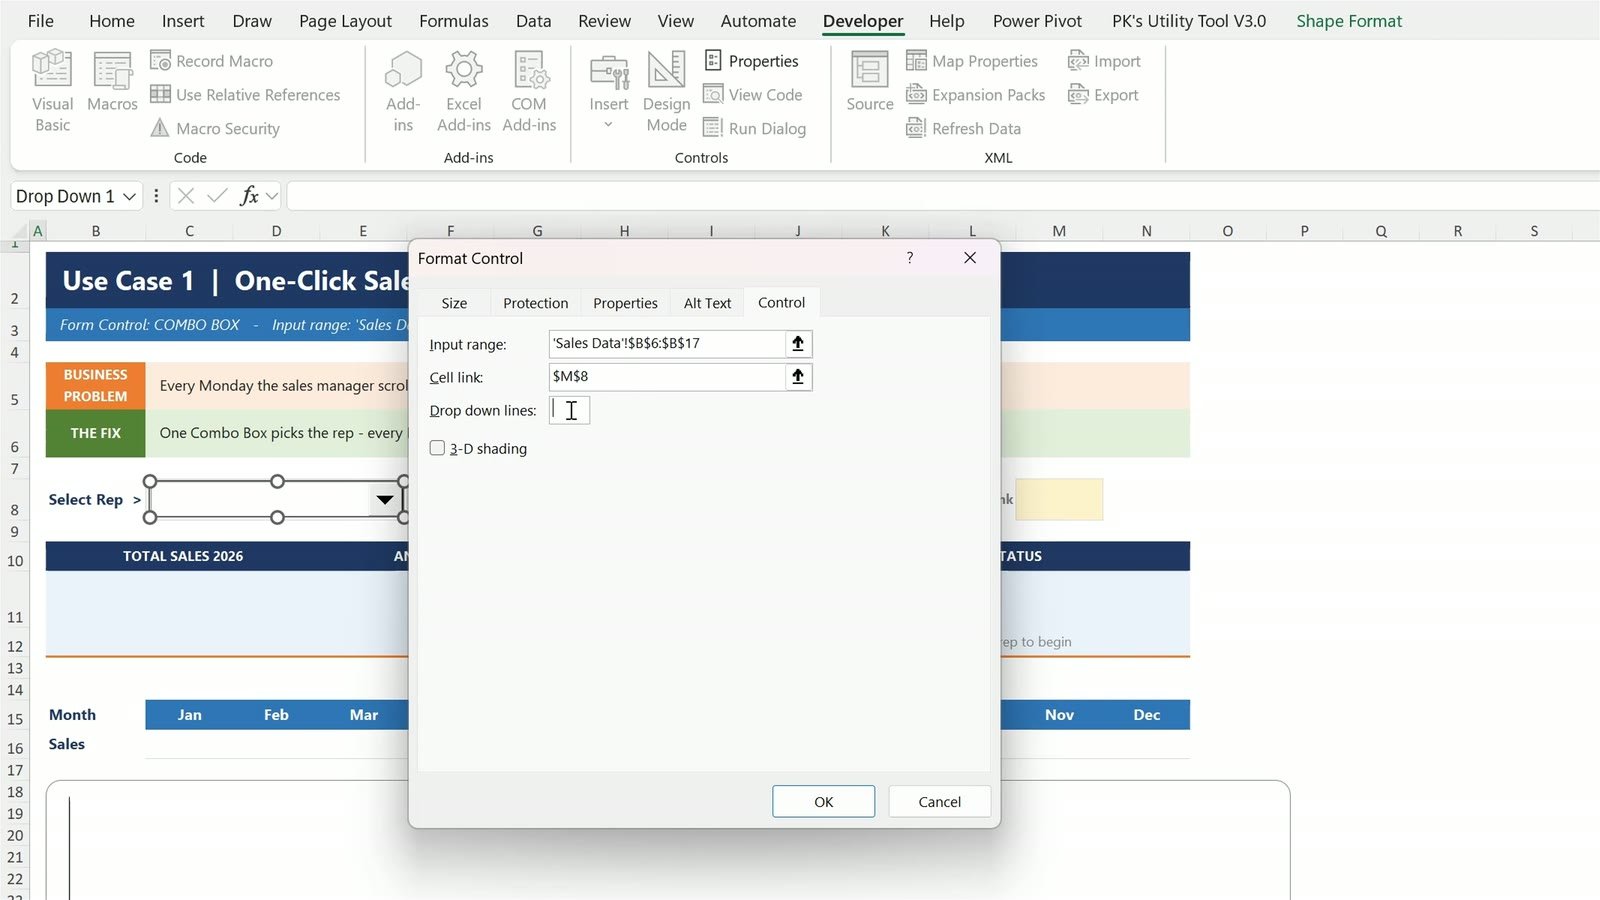
Step 3: Pick a Rep and Read the Cell Link
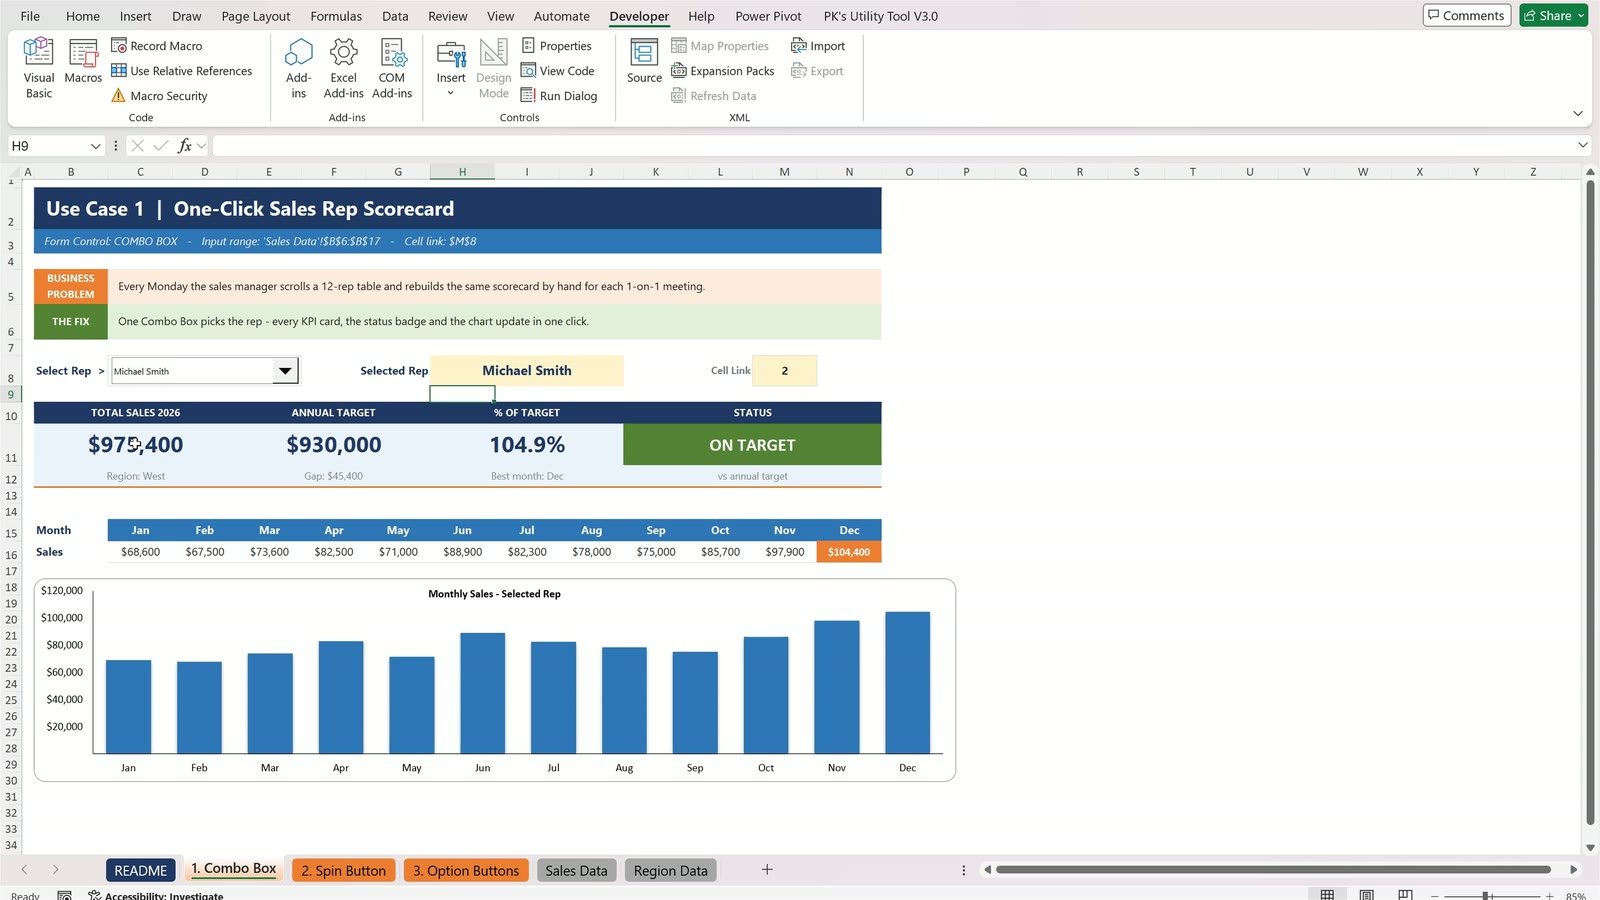
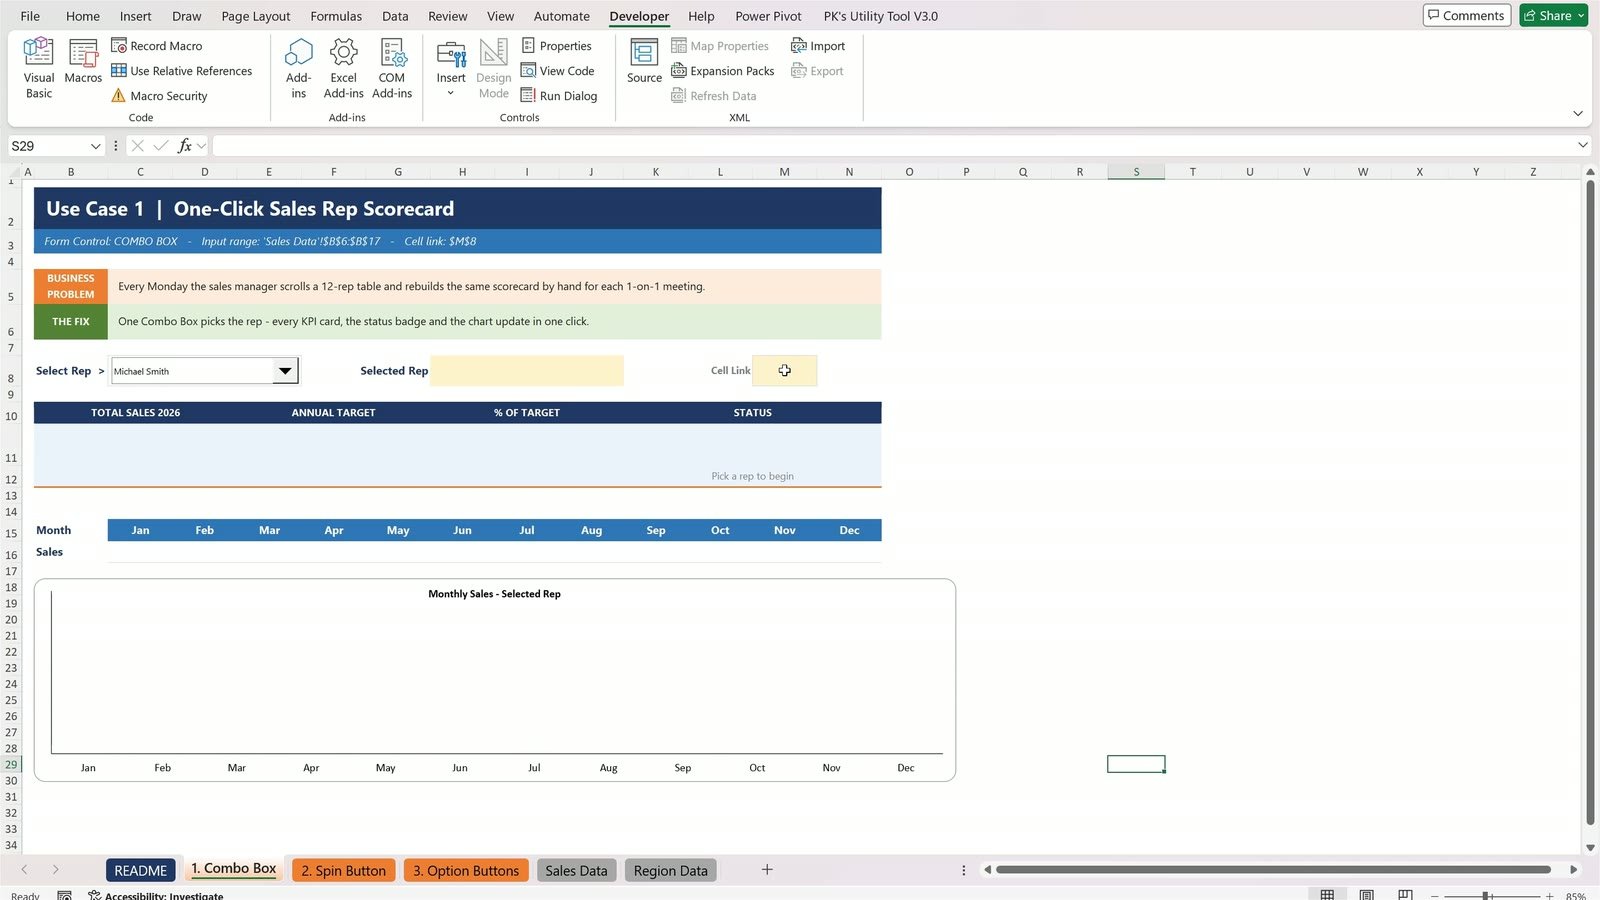
Click any cell to deselect the control, open the combo box and pick Michael Smith.
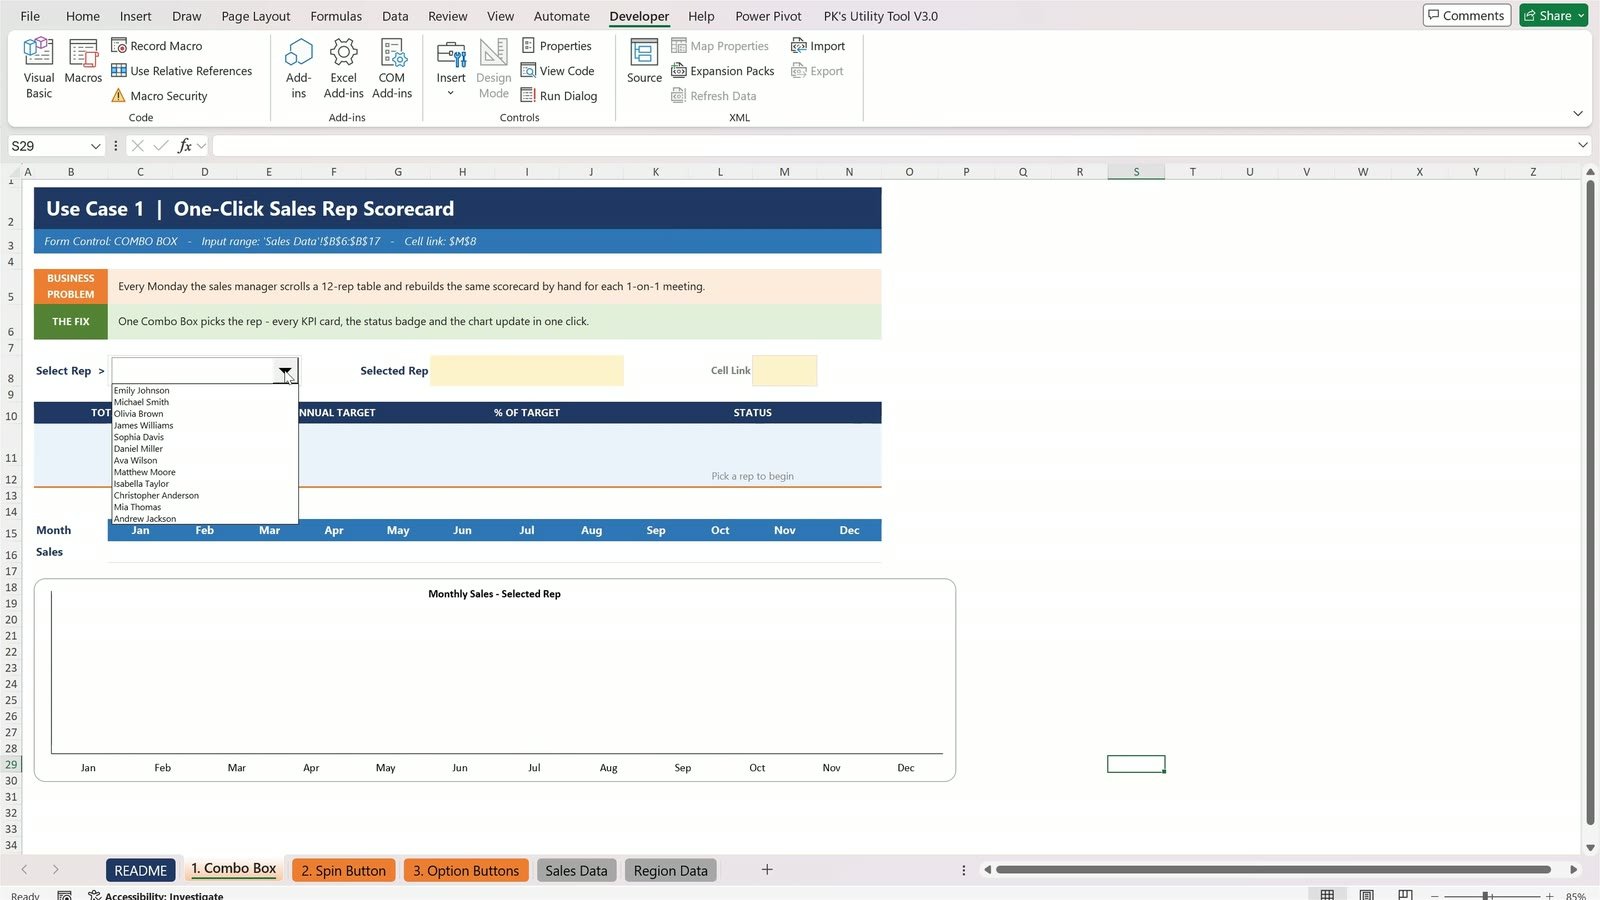
Look at M8: it shows 2, not the name. The combo box returns the position of the item – Michael is the second name in the list.
Step 4: Turn the Number Back into a Name with INDEX
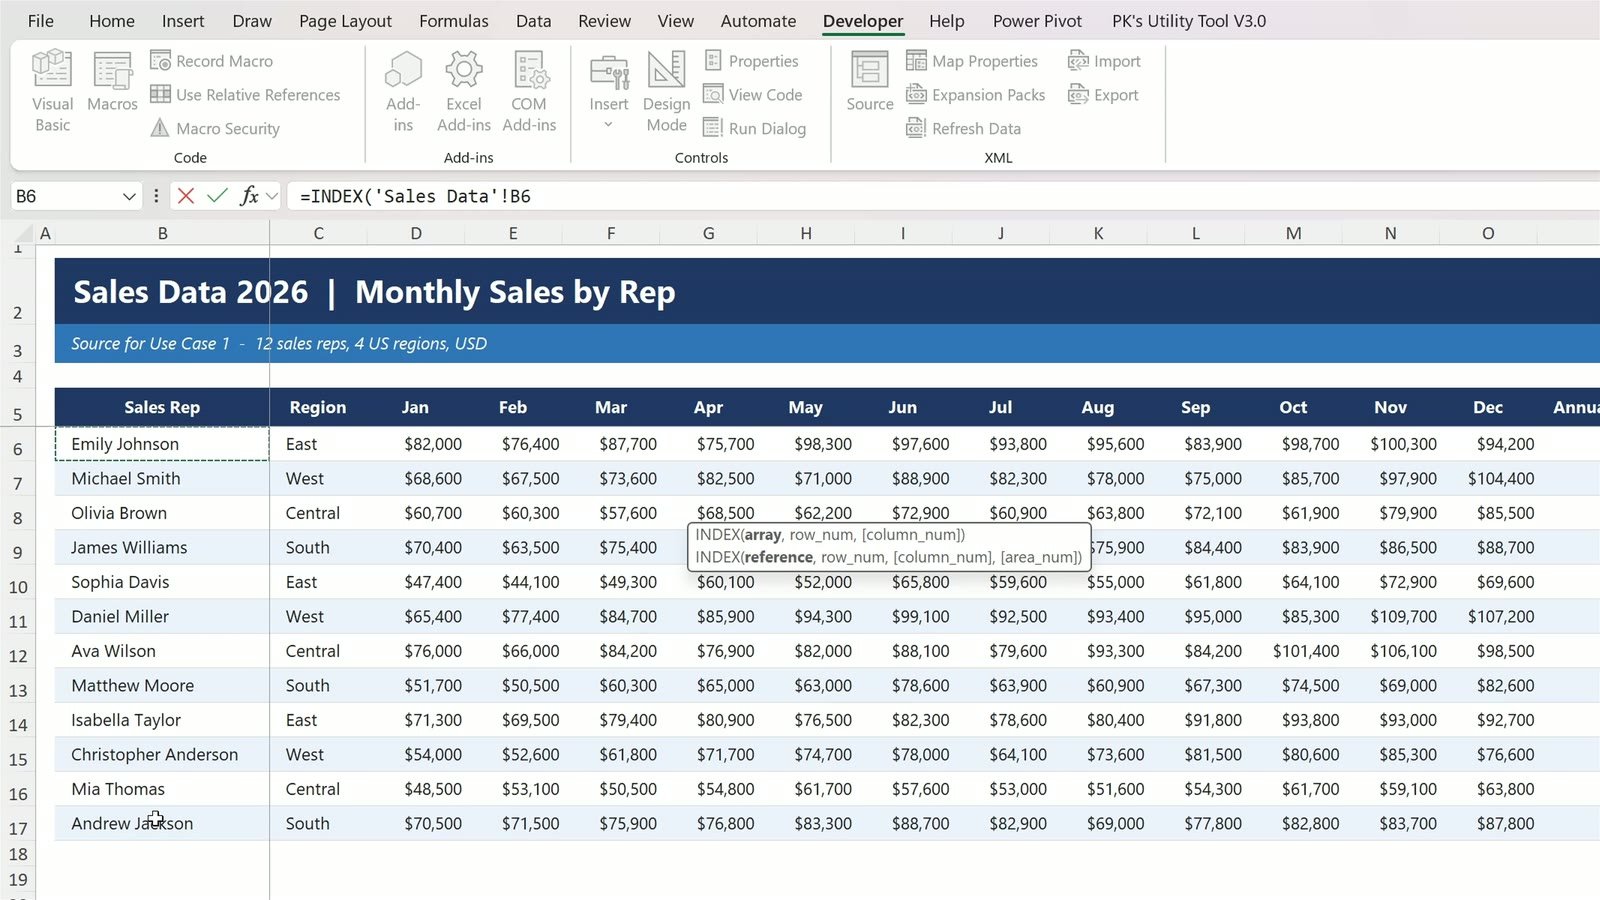
Click H8 (Selected Rep), type =INDEX(, click the Sales Data sheet, select B6:B17, type a comma and M8, close the bracket and press Enter:
=INDEX('Sales Data'!B6:B17,M8)
It returns Michael Smith. Every other formula on the sheet reads that name, so the scorecard fills in: $975,400 total sales against a $930,000 target, 104.9% of target, status ON TARGET in green, best month December, and a monthly chart.
Now pick Andrew Jackson, the last name in the list. One click and everything changes: 90.5% of target and the badge turns red – BEHIND TARGET.
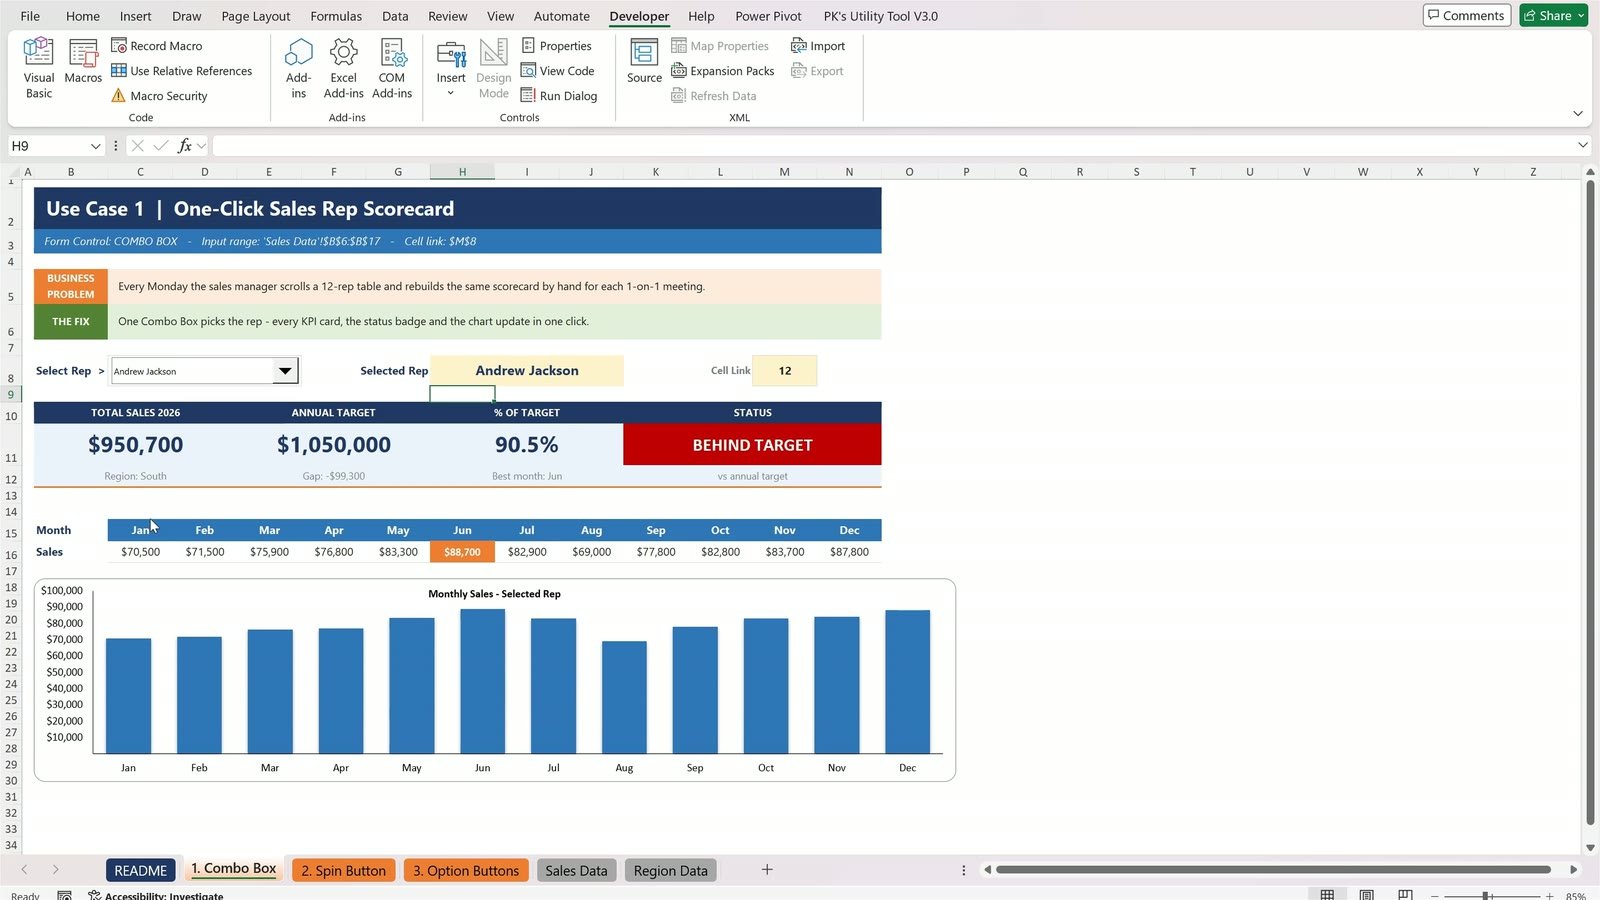
The Combo Box pattern: an input range for the list, a cell link for the number, and INDEX to turn the number into a name.
Use Case 2: Car Dealership Payment Quote (Spin Buttons)
The business problem: a customer asks “what if I finance a little less, or take 72 months?” and the salesperson retypes the numbers every time.
Step 5: Add a Spin Button for the Amount Financed
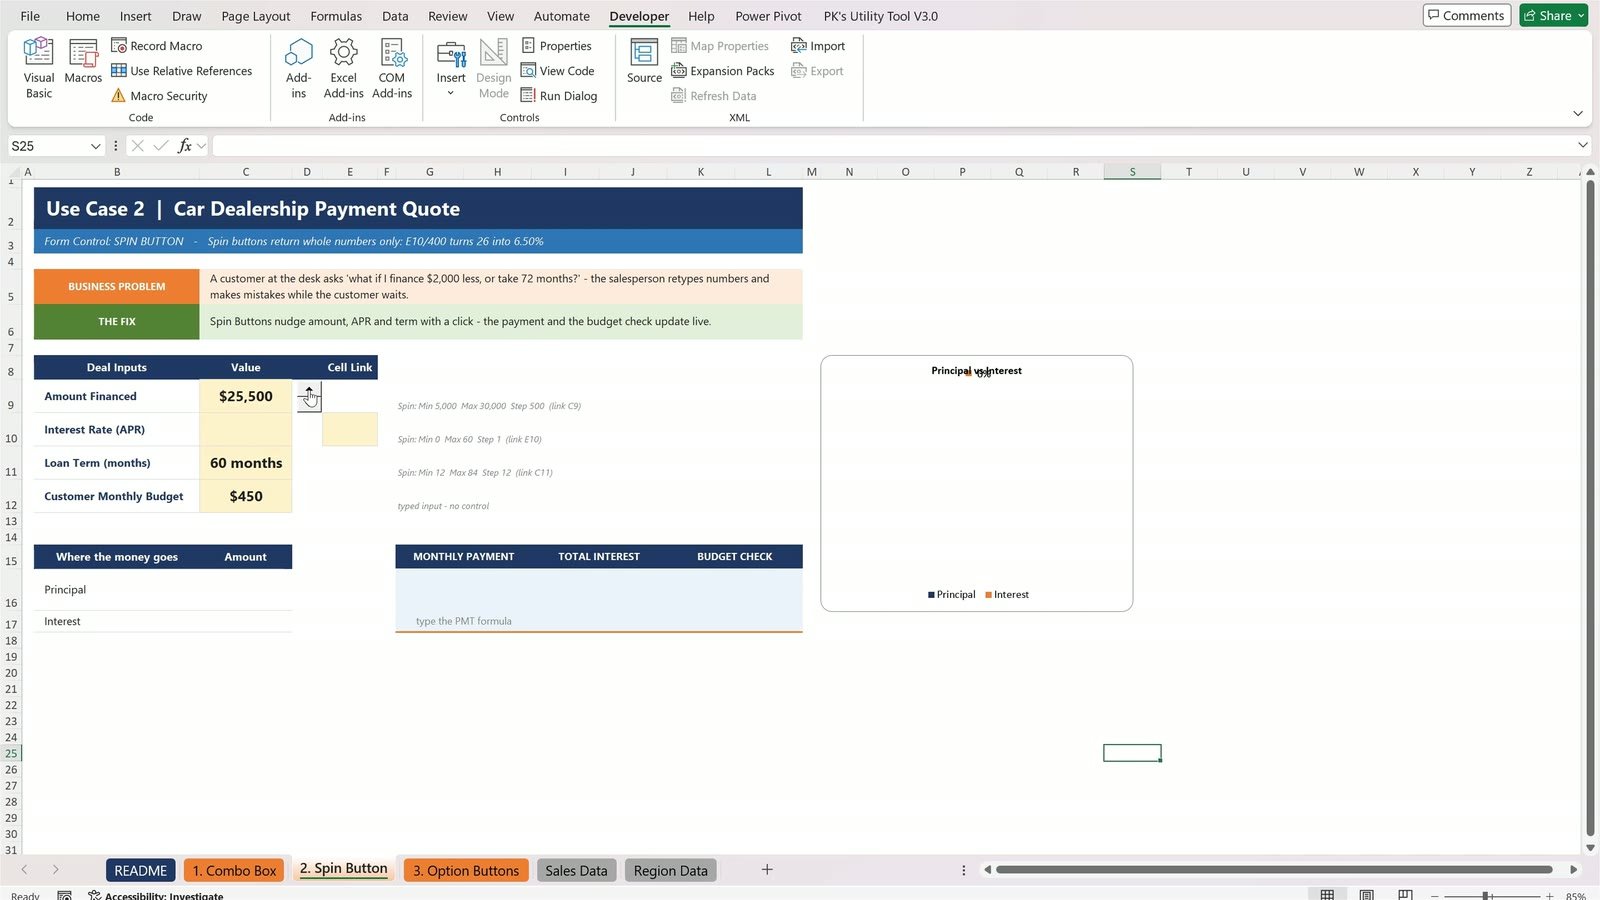
On the 2. Spin Button sheet, click Developer › Insert › Spin Button (the fourth icon) and draw a small button in column D next to Amount Financed. Right-click it › Format Control: Current value 25000, press Tab, Minimum 5000, Maximum 30000, Incremental change 500, Cell link $C$9.
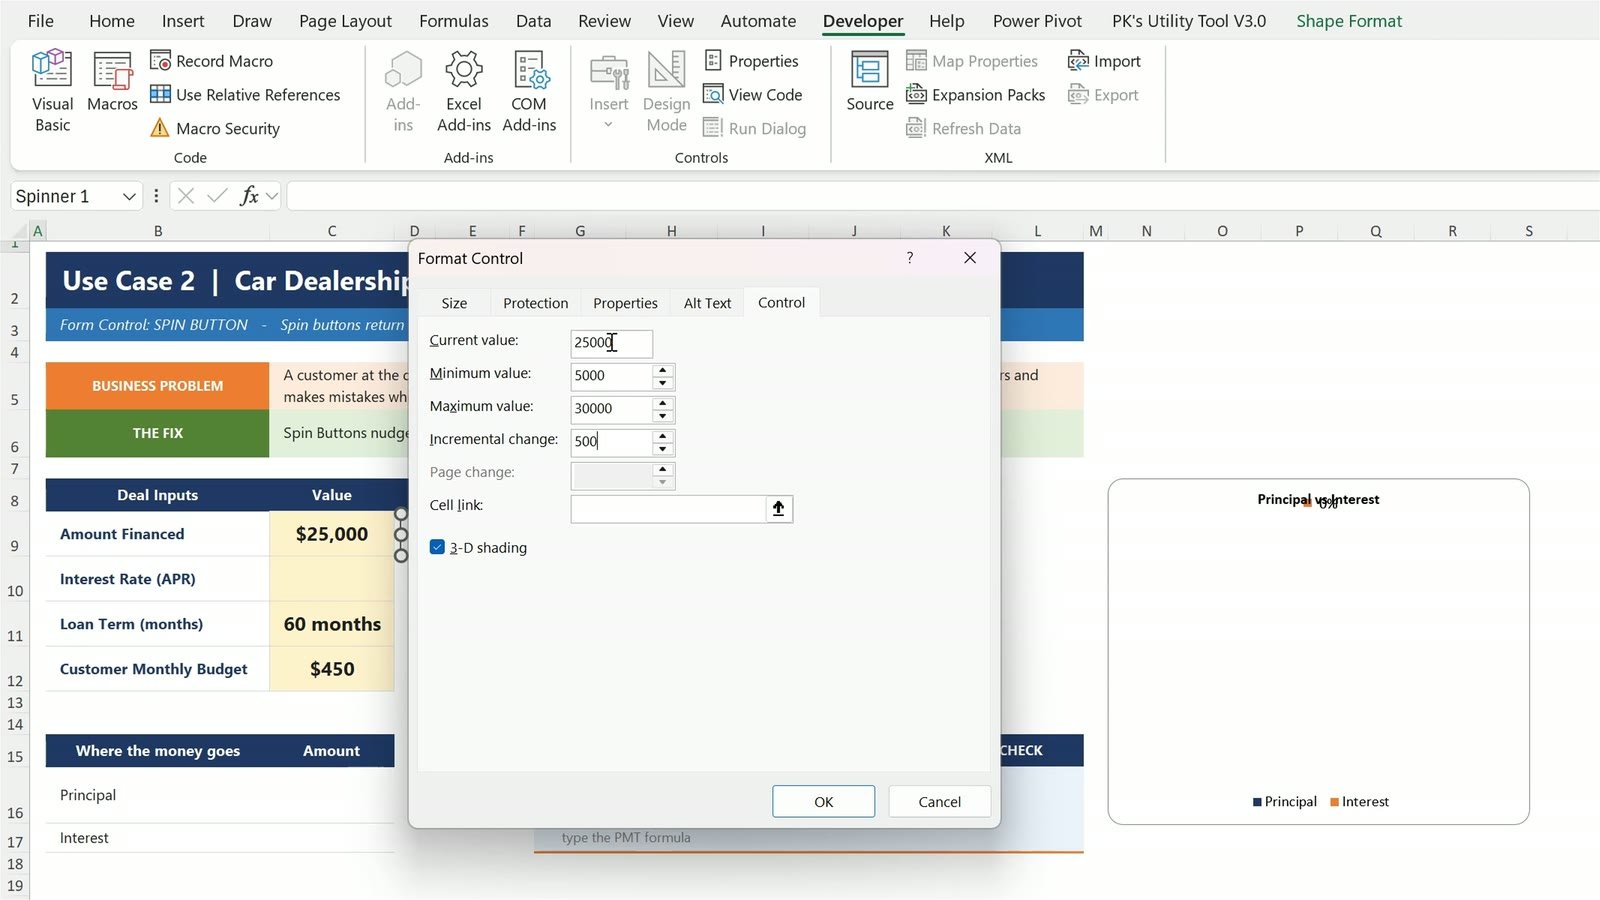
Every click on the arrows now moves the amount by $500.
Step 6: Add a Spin Button for the Loan Term
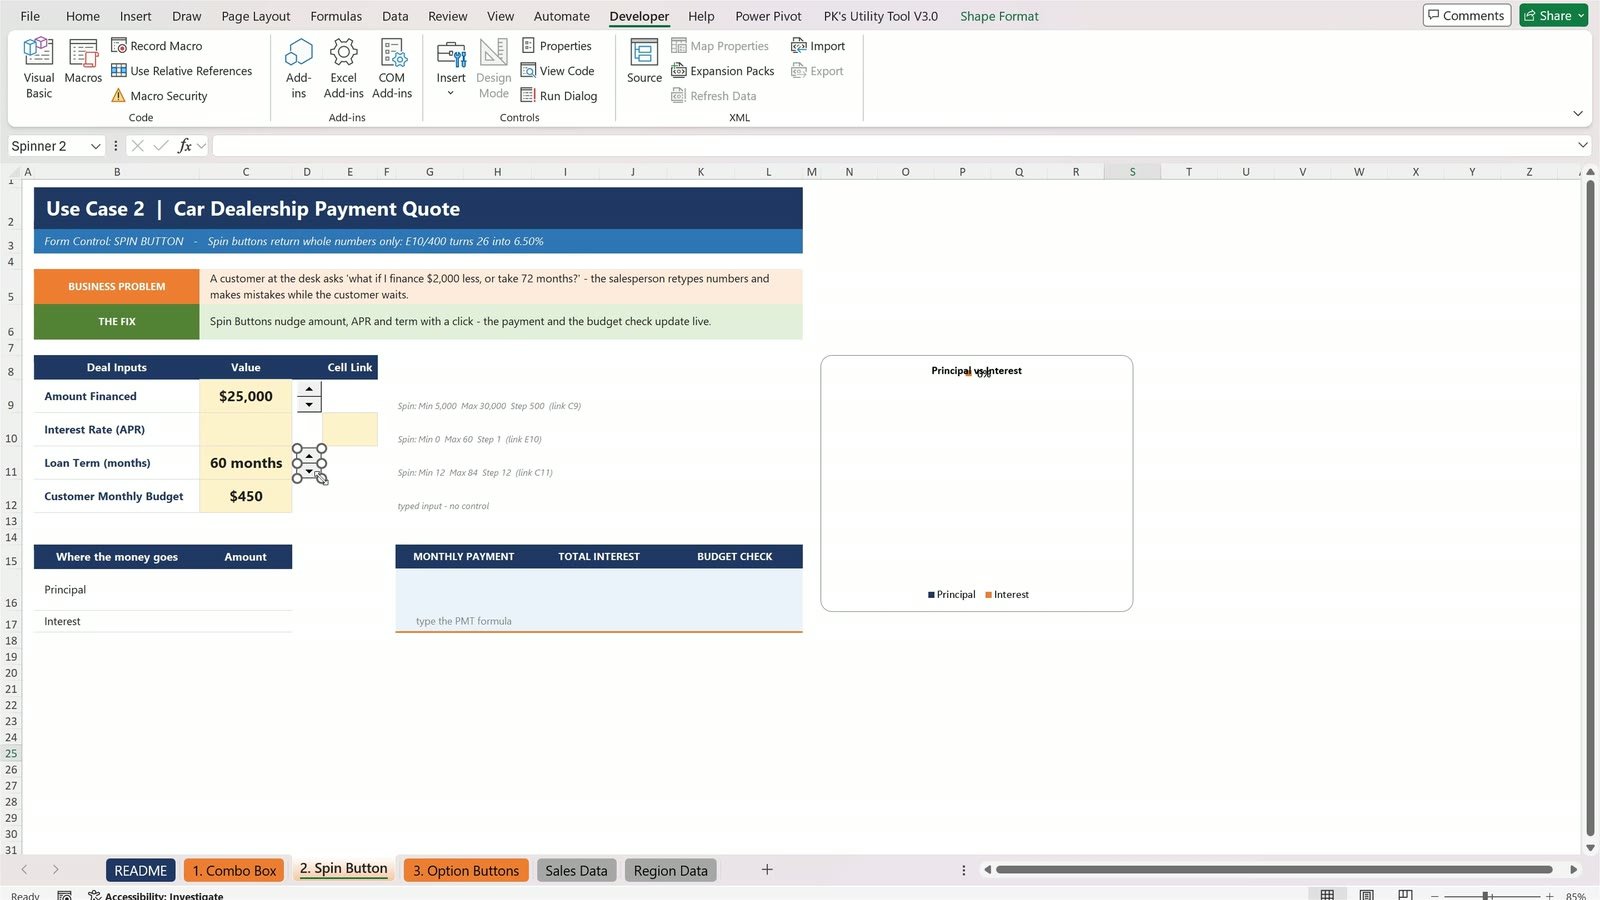
Draw another spin button next to Loan Term: Current value 60, Minimum 12, Maximum 84, Incremental change 12 (one year per click), Cell link $C$11.
Step 7: The Catch – Spin Buttons Only Return Whole Numbers
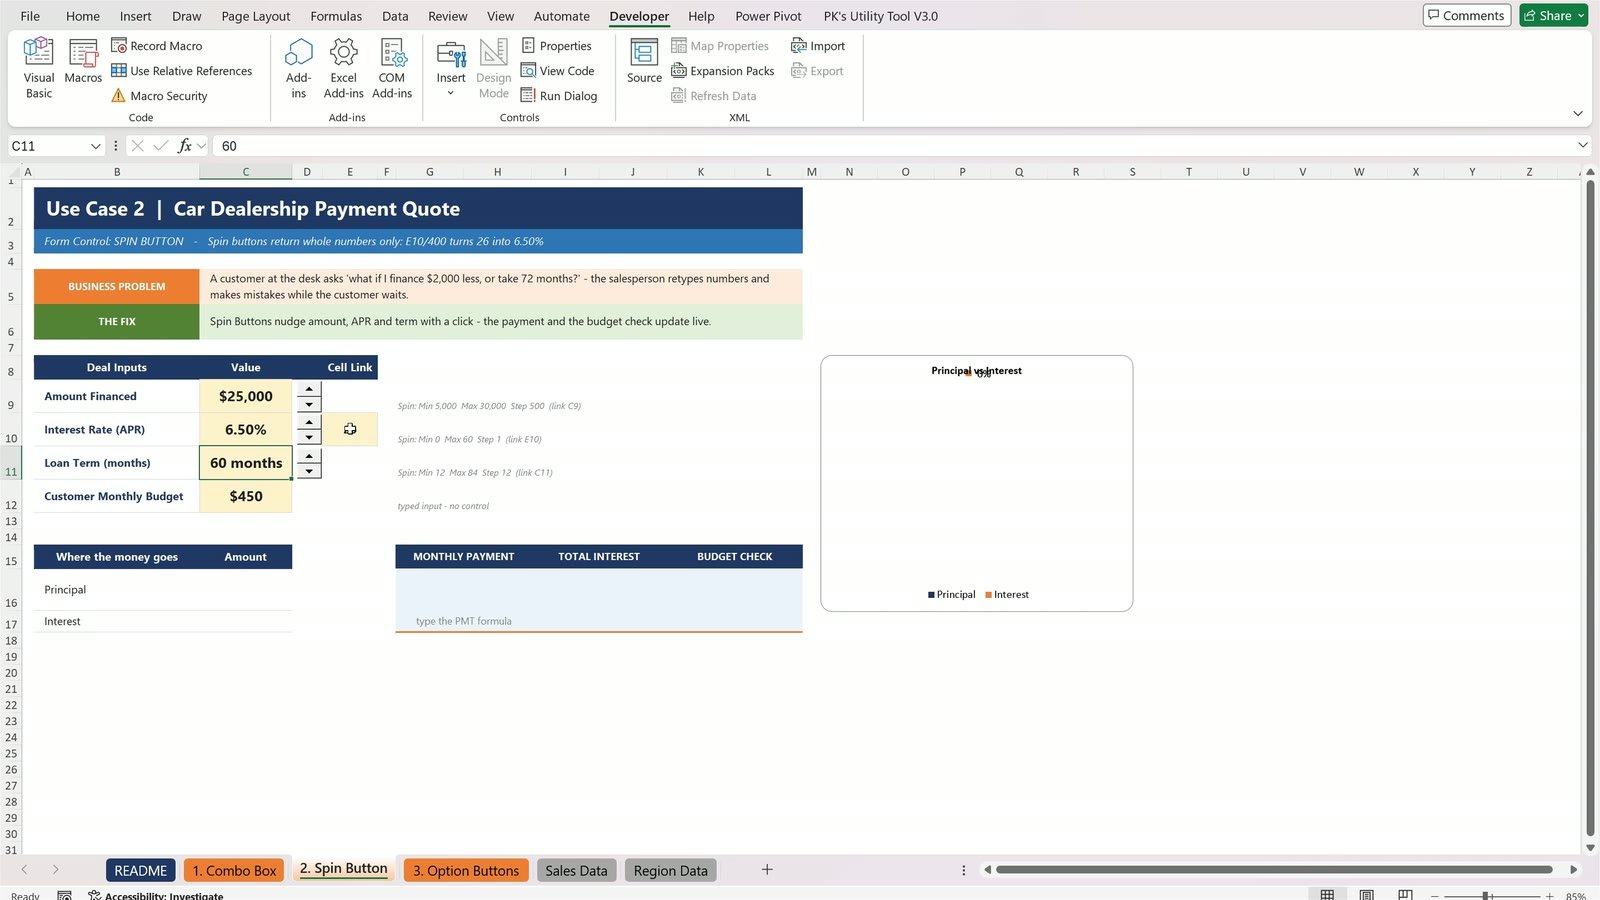
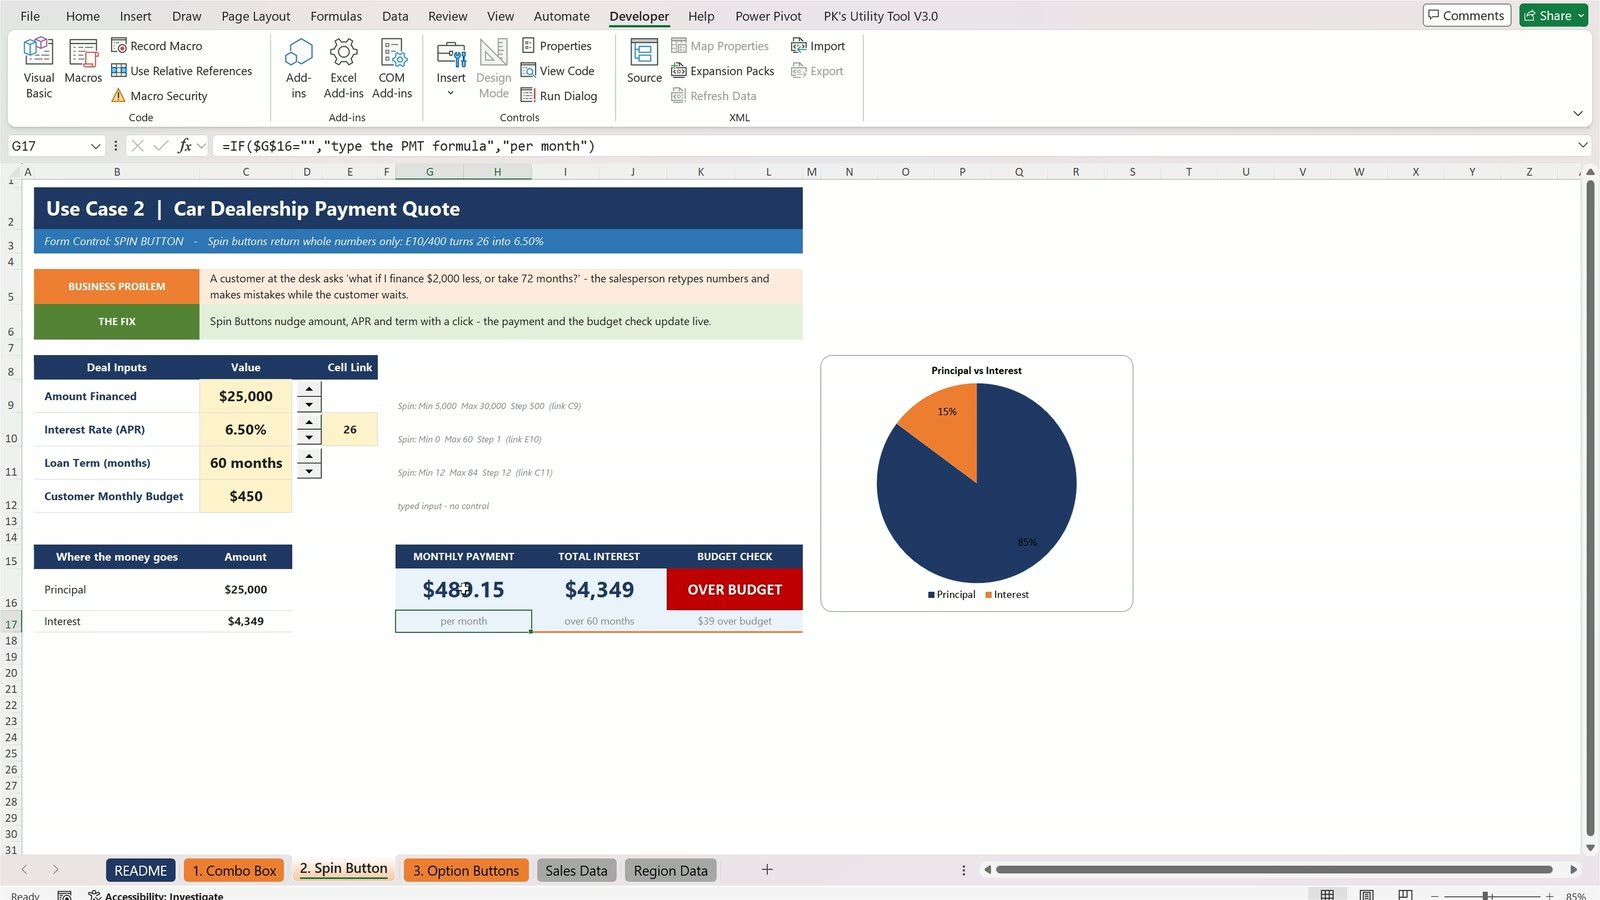
A spin button can never return 6.5%. Link it to a helper cell and divide. Draw a third spin button next to Interest Rate: Current value 26, Minimum 0, Maximum 60, Incremental change 1, Cell link $E$10. In C10 type:
=E10/400
26 / 400 = 6.50%, and every click now moves the rate by a quarter of a percent.
Step 8: Calculate the Monthly Payment with PMT
Click the Monthly Payment card and enter:
=PMT(C10/12,C11,-C9)
The rate is divided by 12 because the customer pays every month, C11 is the number of months and -C9 is the amount.
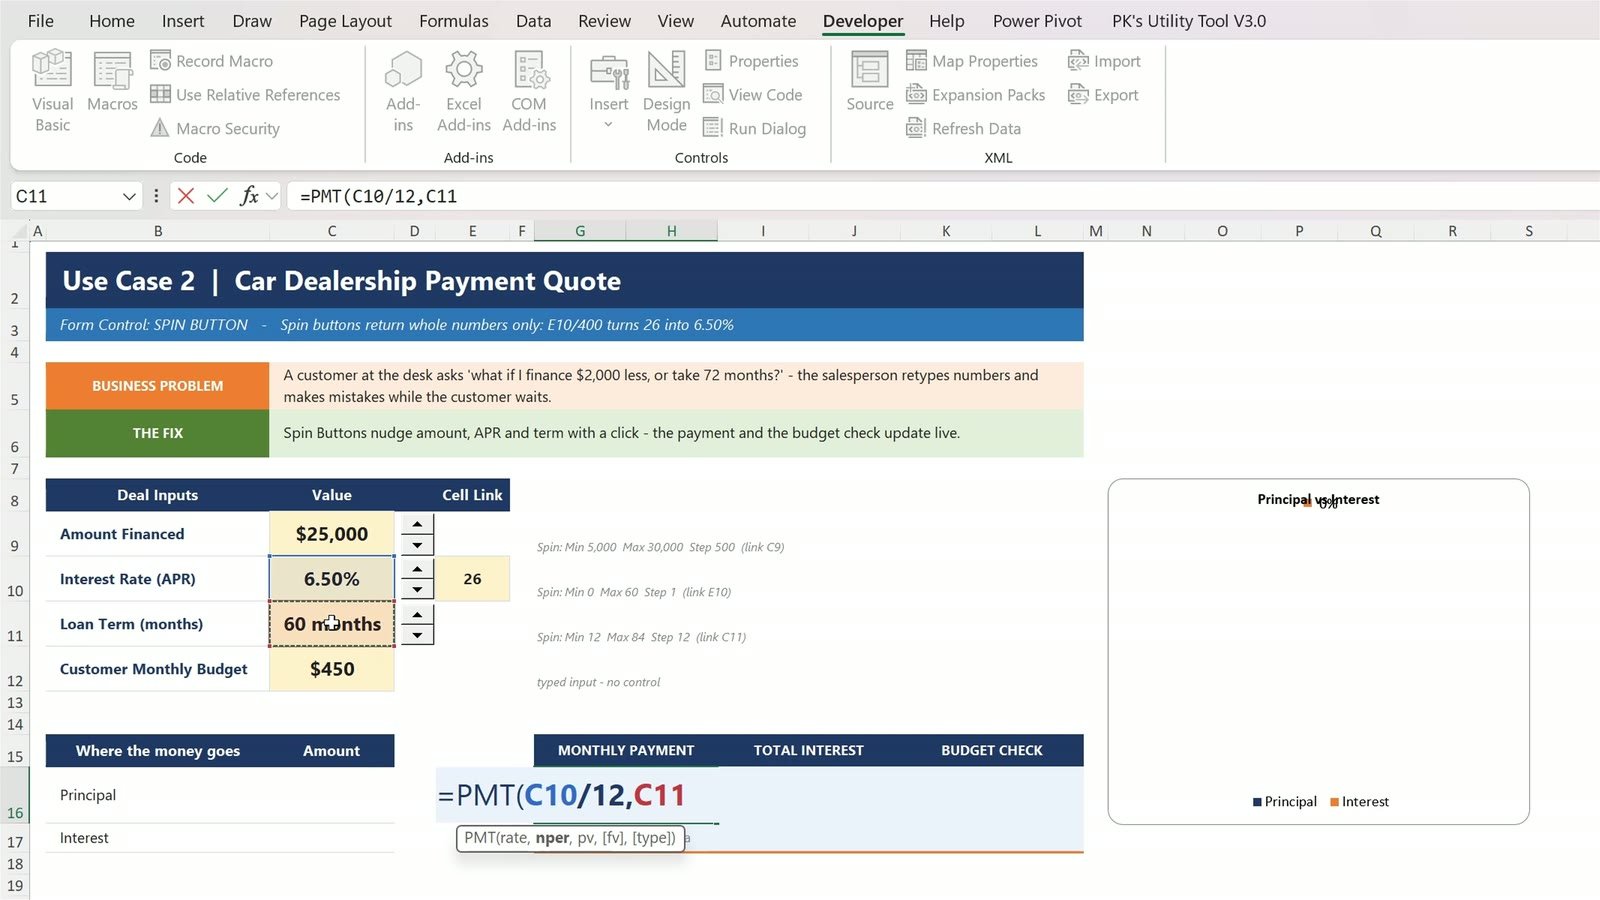
The result is $489.15 a month, but the customer’s budget is $450, so the budget check says OVER BUDGET in red.
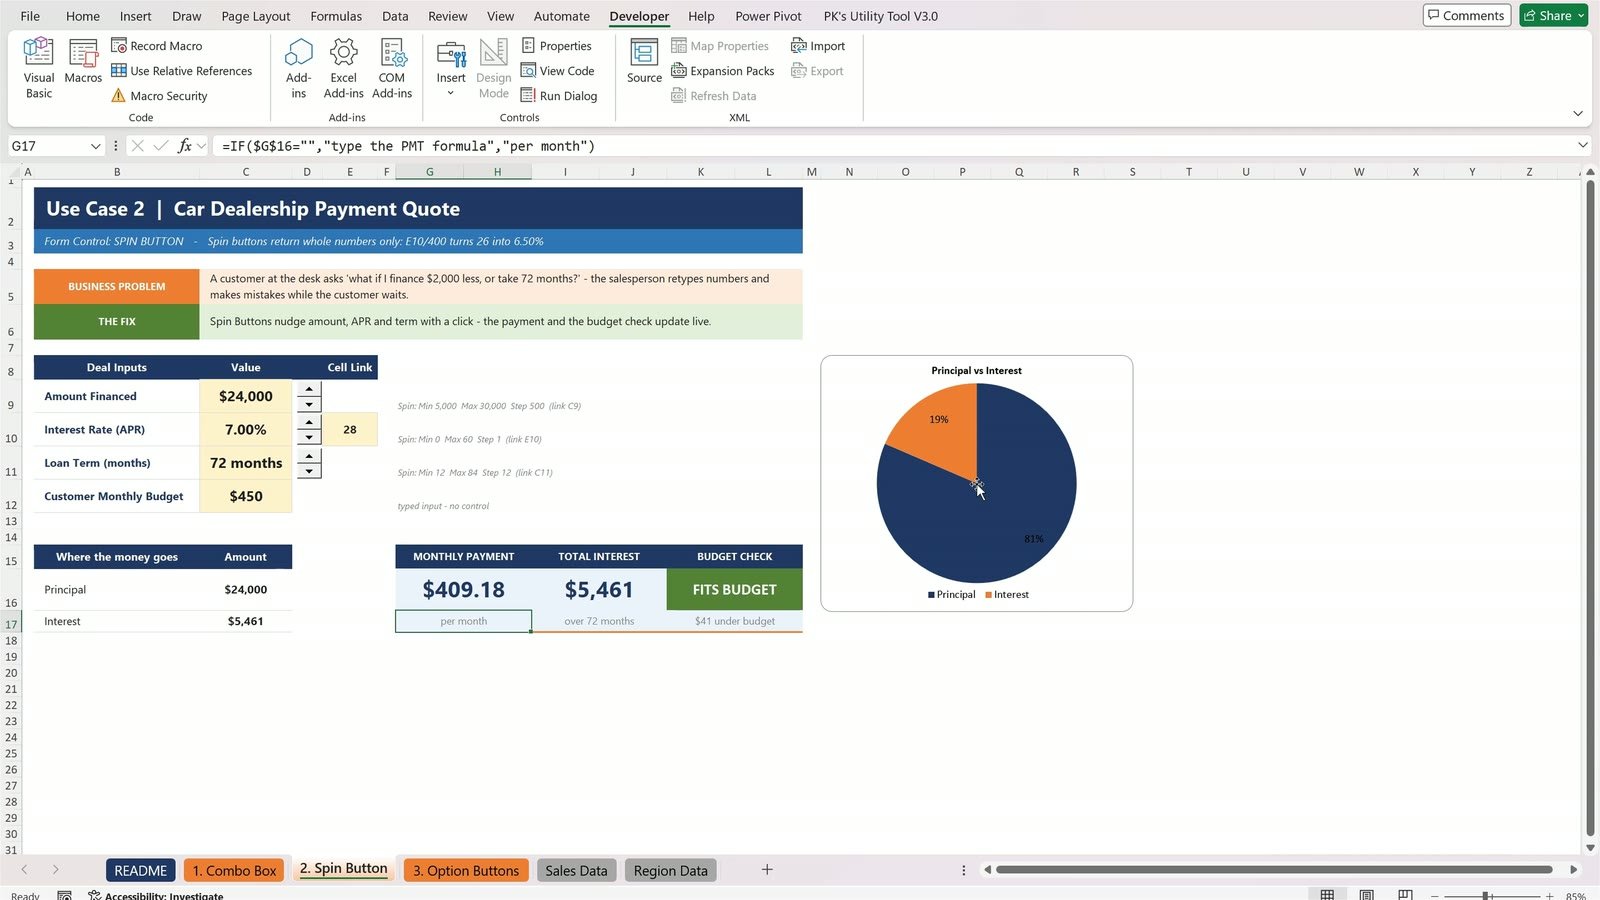
Click the loan term up one step to 72 months: the payment drops to about $420 and the badge turns green – FITS BUDGET. Try the rate and the amount; the quote and the principal-vs-interest pie chart update live.
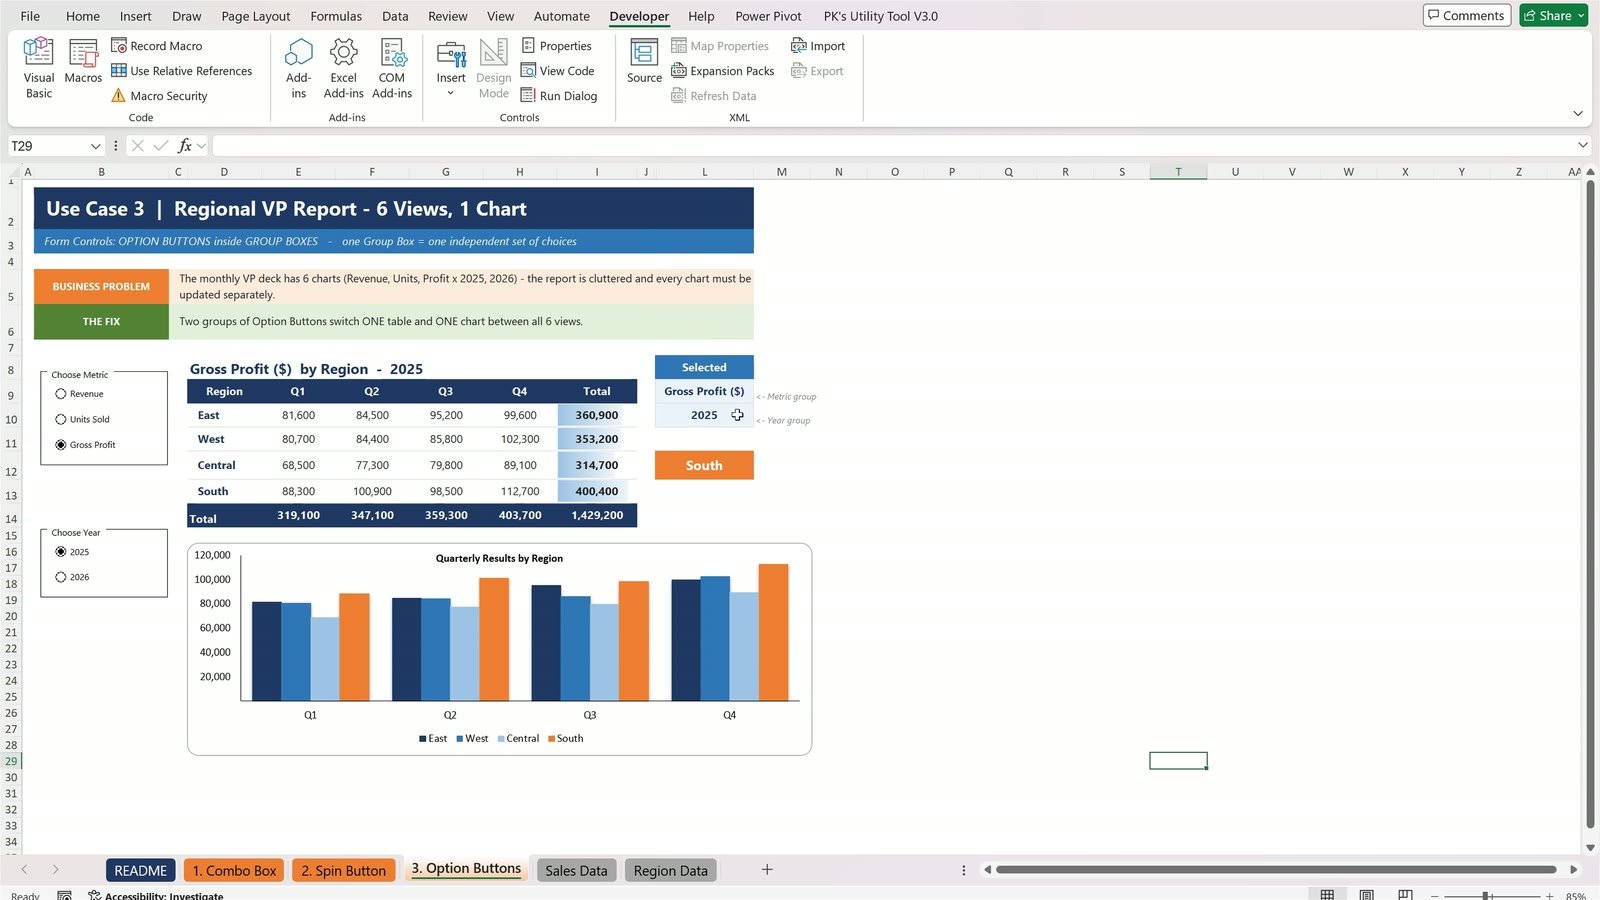
Use Case 3: Regional VP Report – 6 Views, 1 Chart (Option Buttons)
The business problem: every month the regional vice president gets six charts – Revenue, Units Sold and Gross Profit for two years. We turn all six into one table and one chart.
Step 9: Draw the Option Buttons
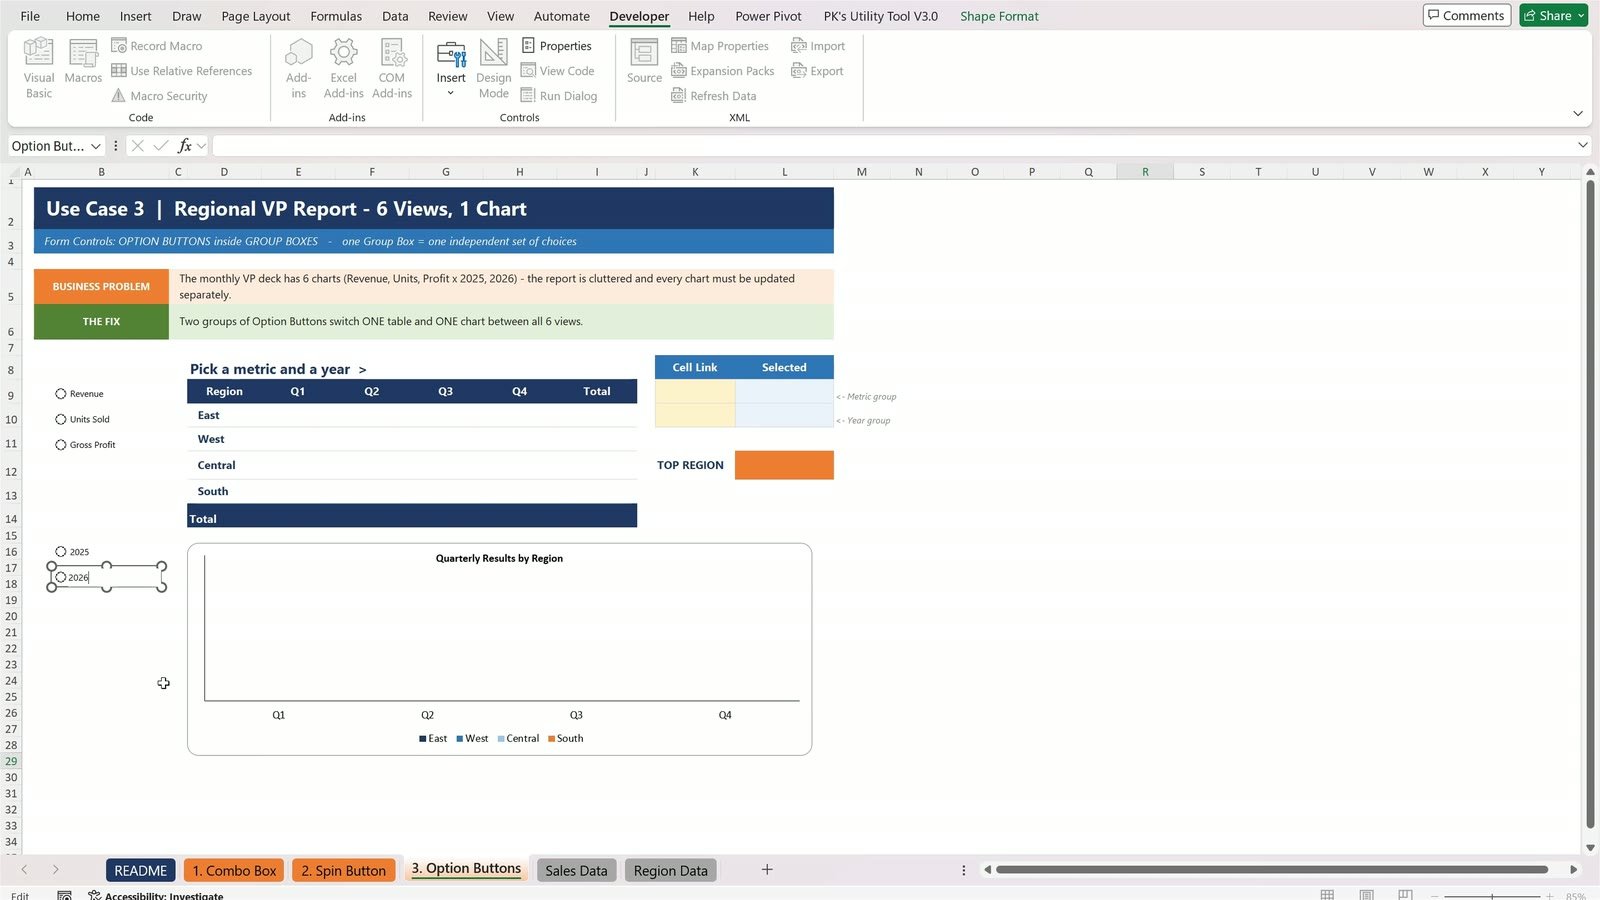
On the 3. Option Buttons sheet, click Developer › Insert › Option Button (the last icon in the first row) and draw it in column B. Right-click it › Edit Text, press Shift+End and type Revenue. Repeat for Units Sold and Gross Profit, then add two more lower down for 2025 and 2026.
Step 10: The Mistake Almost Everyone Makes
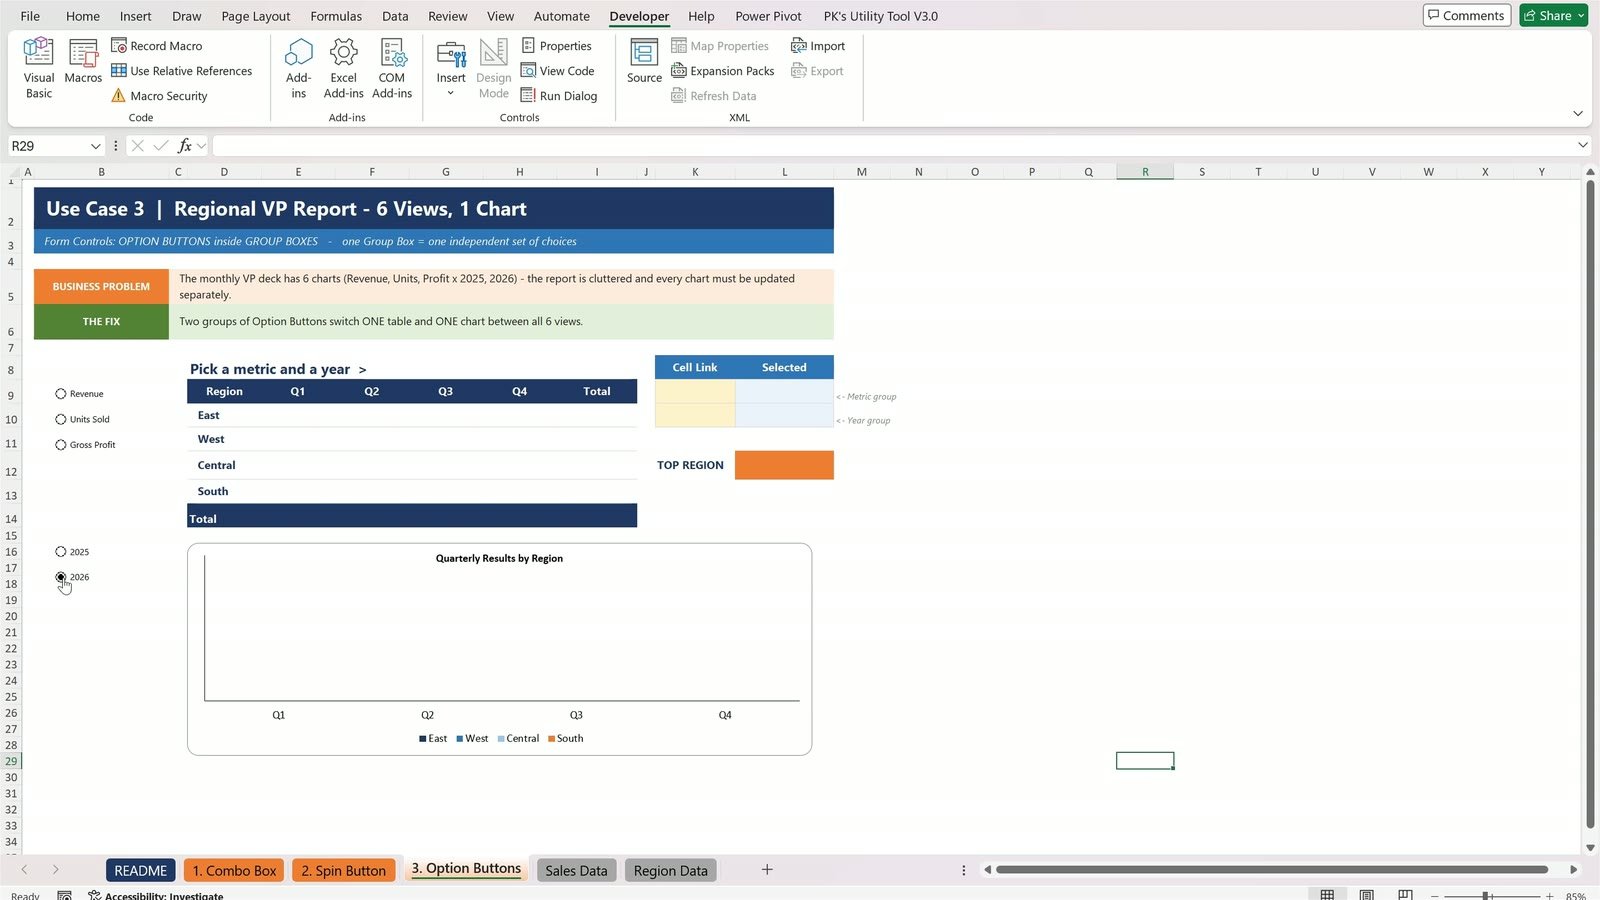
Click Revenue, then click 2026 – Revenue switches off. Without a Group Box, all five buttons act as one group, so only one of them can be selected.
Step 11: Fix It with Group Boxes
Click Developer › Insert › Group Box (first icon in the second row) and draw it around the three metric buttons. Right-click its title › Edit Text › Choose Metric. Draw a second group box around the two year buttons and call it Choose Year. Each box is now its own group.
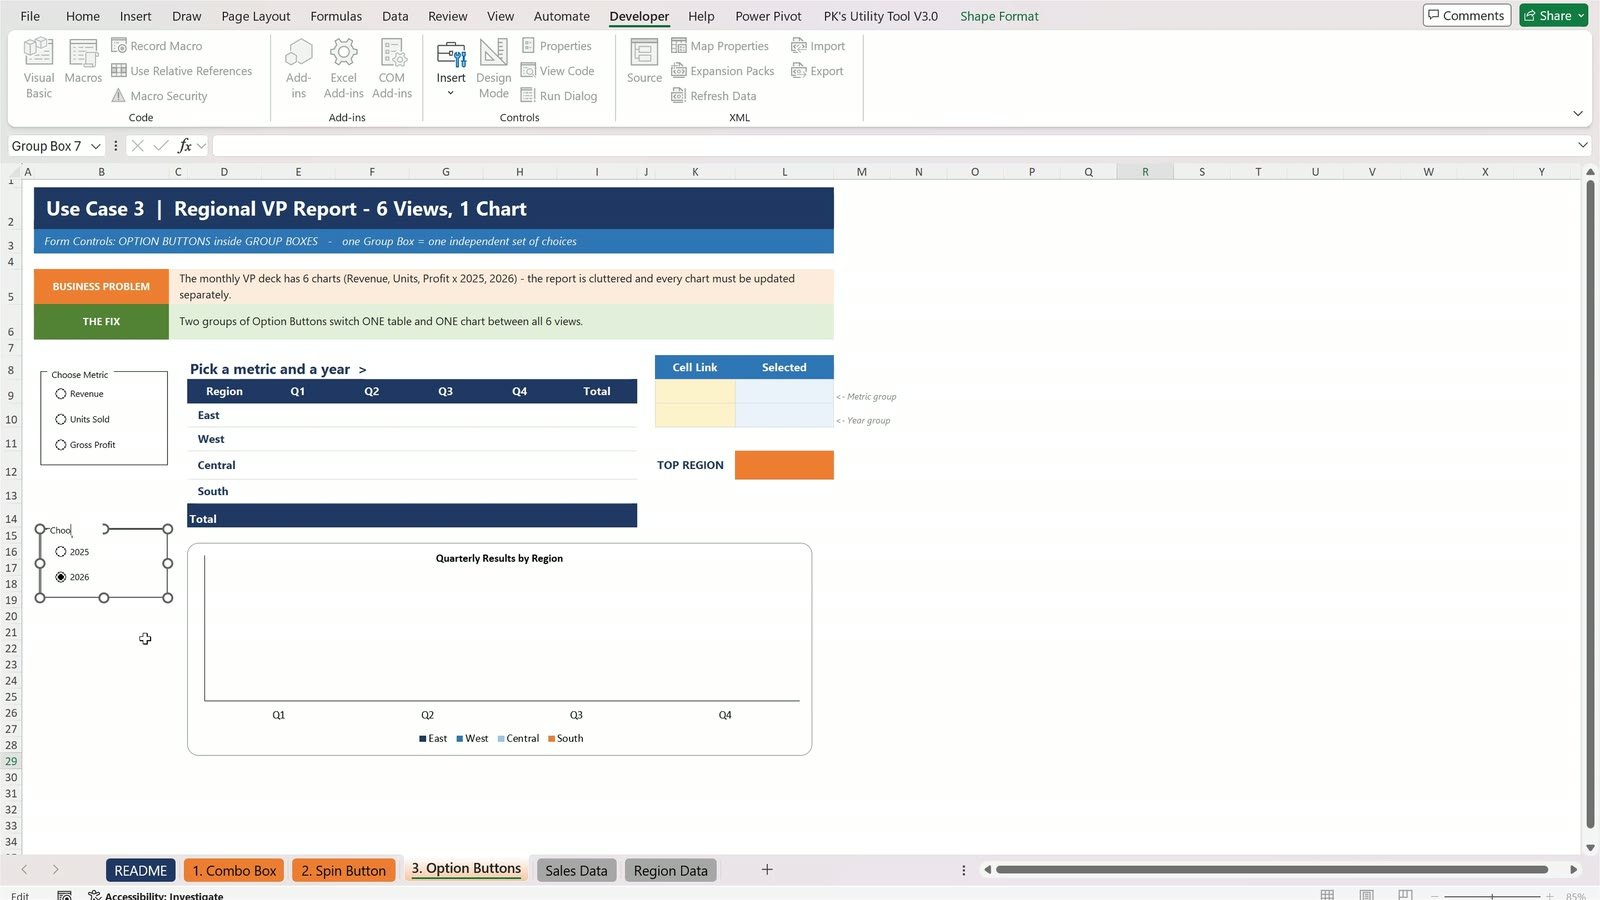
Step 12: Link the Groups and Turn the Numbers into Words with CHOOSE
Right-click Revenue › Format Control › Cell link $K$9 (one link covers the whole group). Right-click 2025 › Format Control › Cell link $K$10. Then enter:
=CHOOSE(K9,"Revenue ($)","Units Sold","Gross Profit ($)") in L9=CHOOSE(K10,2025,2026) in L10
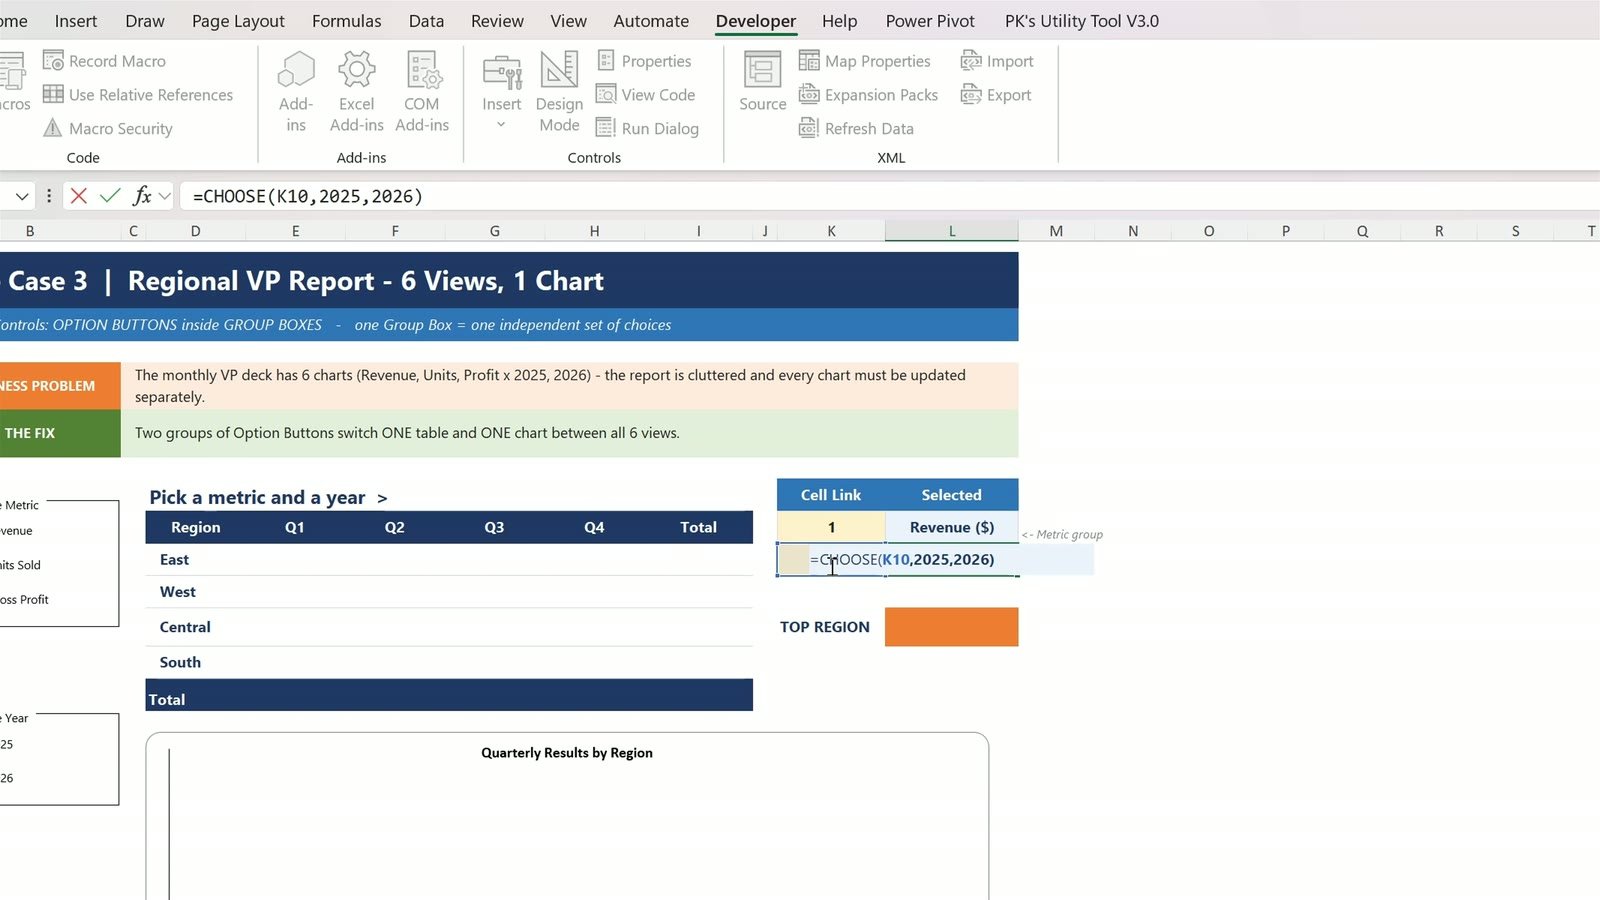
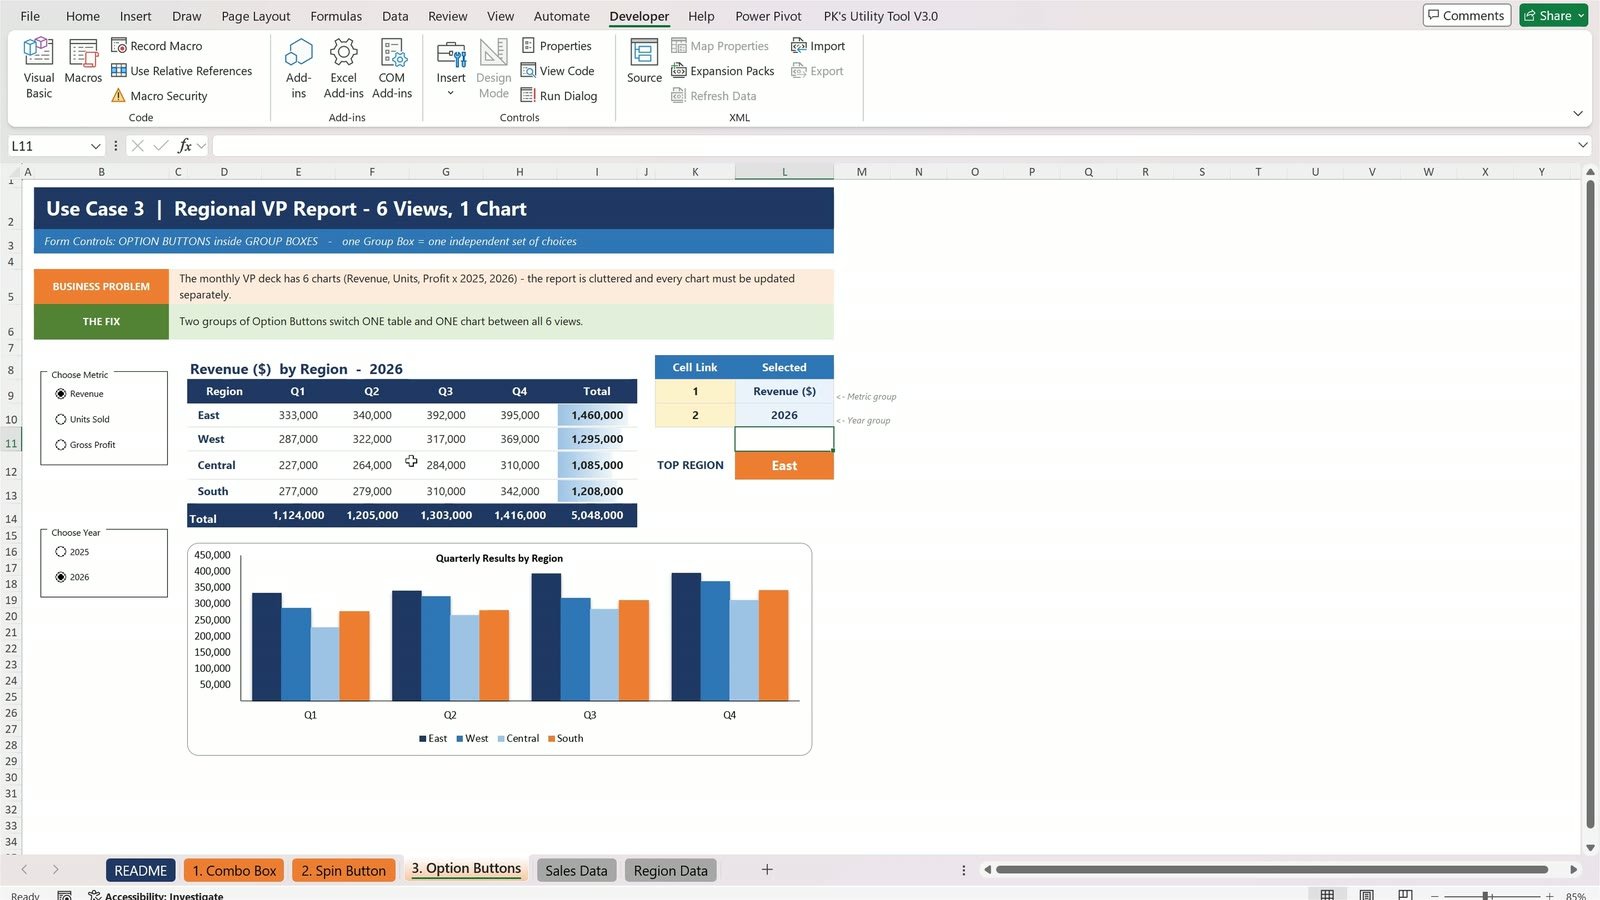
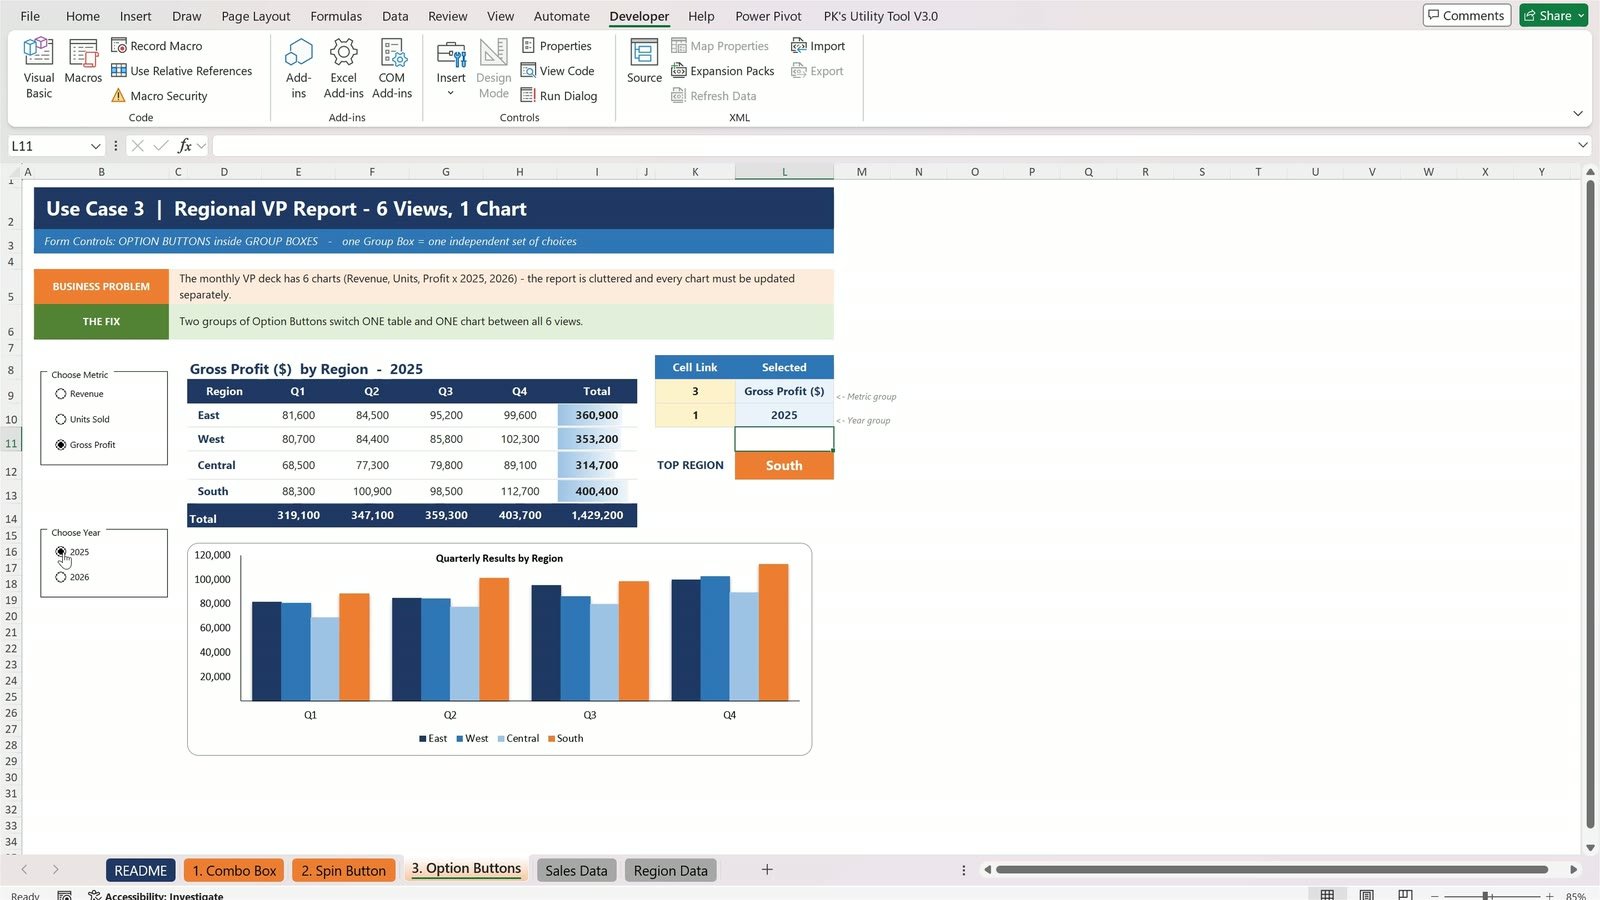
The SUMIFS table, the data bars, the TOP REGION badge and the chart read those two cells. Revenue 2026: East is the top region with $1,460,000 of $5,048,000. Click Units Sold and West takes the lead; click Gross Profit and South is on top. Click 2025 to go back a year – six views, one table, one chart.
Bonus: Hide the Cell Links
Your audience doesn’t need to see the helper cells. Right-click the column K header and choose Hide. The cell links are hidden but the buttons keep working. Protect the sheet (Review › Protect Sheet) and people can still click the controls, but they can’t break your formulas.
Combo Box vs Spin Button vs Option Buttons
| Feature | Combo Box | Spin Button | Option Buttons | Data Validation list |
|---|---|---|---|---|
| Best for | Picking one item from a long list | Nudging a number up or down | Picking one of a few choices | Typing-free entry in a cell |
| What the cell link holds | Position of the item (1, 2, 3…) | The current whole number | Number of the selected button | The item text itself |
| Formula to use | INDEX | Direct, or divide for decimals | CHOOSE or INDEX | Direct |
| Decimals | – | No – divide a helper cell | – | – |
| Needs a Group Box | No | No | Yes, for more than one set | No |
| Macros / VBA | None | None | None | None |
| Excel versions | Excel 2007 and later, Microsoft 365 | Excel 2007 and later, Microsoft 365 | Excel 2007 and later, Microsoft 365 | All versions |
Use a form control when the click should drive a whole report; use a data validation list when you only need clean data entry in one cell.
Tips and Best Practices
- ✅ Put every cell link in one clearly labelled helper area so the report is easy to audit.
- ✅ Use Tab to move between the fields of the Spin Button Format Control dialog – it selects the old value so you can simply type.
- ✅ Edit Text puts the cursor at the start of the caption – press Shift+End before typing.
- ✅ Draw Group Boxes around option buttons whenever a sheet has more than one set of choices.
- ✅ Guard dependent formulas with IF(…=””,””,…) so the report stays clean before a choice is made.
- ✅ Right-click a control (or Ctrl+click) to select it without triggering it.
Want to go further? See the interactive KPI cards in Garden Centers KPI Dashboard in Excel, the form-based entry in Banquet Booking Register Data Entry System in Excel, and our Power Query tutorial Merge Queries in Power Query in Excel. Microsoft’s overview of Form controls and ActiveX controls lists every control type.
Short on time? Browse ready-made Excel Dashboard Templates and Excel KPI Dashboards on NextGenTemplates.
Frequently Asked Questions
What are form controls in Excel?
Form controls are clickable objects such as combo boxes, spin buttons, option buttons, check boxes and list boxes that you insert from Developer › Insert. Each one writes a number into a linked cell, and formulas that read that cell make the sheet interactive without any VBA.
Do Excel form controls need macros or VBA?
No. Form controls work in a normal .xlsx workbook. They only change the value of their cell link; your worksheet formulas do the rest. You only need VBA if you want a control to run a macro.
Why does my combo box return a number instead of the name?
A Form Control combo box always returns the position of the selected item in its input range. Use INDEX with the same range and the cell link, for example =INDEX(‘Sales Data’!B6:B17,M8), to turn the position back into the name.
How do I get decimals from a spin button?
Spin buttons only return whole numbers between 0 and 30,000. Link the spin button to a helper cell and divide it in another cell – for example =E10/400 turns 26 into 6.50% and moves the rate by 0.25% per click.
Why can I only select one option button when I have two sets?
Option buttons on the same sheet belong to one group unless you put them inside a Group Box. Draw a Group Box around each set, then give each group its own cell link.
What is the difference between Form Controls and ActiveX Controls?
Form Controls are simpler, work without code and behave the same on most Excel versions. ActiveX Controls have more formatting and event options but need VBA and are not supported on Excel for Mac. For interactive reports, Form Controls are usually the better choice.
How do I hide the cell links behind form controls?
Put the cell links in one column and hide it (right-click the column header › Hide), or place them on a separate sheet. The controls keep working, and you can protect the sheet so users can click the controls but not edit the formulas.
Download the Free Practice File
Practice every step with the same data used in this tutorial. The download includes a start file with all three use cases ready for the controls and a completed solution workbook with every control already working.
⬇️ Download Practice + Solution Files
Practice file + solution workbook · .zip · Excel 2007 or later
About the Author
Written by PK, Microsoft Certified Professional with over 16 years of cross-industry experience in Excel, VBA, Power Query and Power BI, and the creator of the PK: An Excel Expert YouTube channel with 300K+ subscribers. Every tutorial comes with a practice file and a step-by-step video.
Conclusion
Three form controls, one idea: the control writes a number and your formula does the rest. A Combo Box picks one item from a list, a Spin Button nudges a number up and down, and Option Buttons in Group Boxes pick one choice per group. Add them to your own reports and your users will click instead of type.
🎥 Watch more tutorials on our YouTube channel: Youtube.com/@PK-AnExcelExpert
📅 Last updated: September 2026