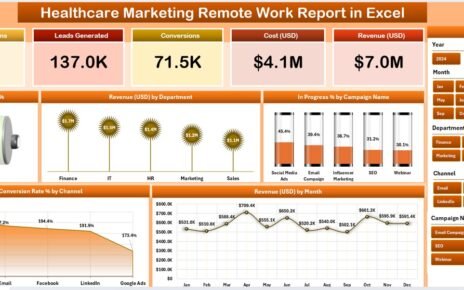
The healthcare industry is transforming rapidly, and marketing teams must keep pace with digital trends while ensuring accuracy, efficiency, and
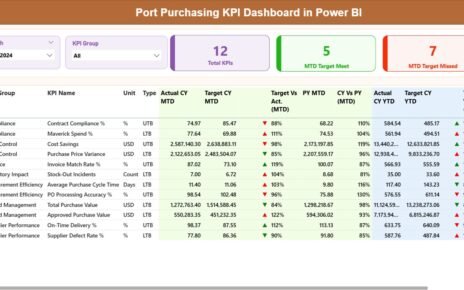
Managing purchasing operations in a port environment requires speed, accuracy, and full visibility. Since ports handle high-volume procurement activities, multiple
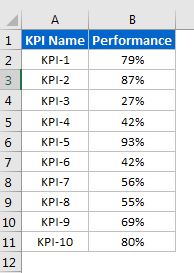
Digital transformation is pivotal in today's fast-evolving business landscape. To effectively manage and track the performance of digital transformation initiatives,