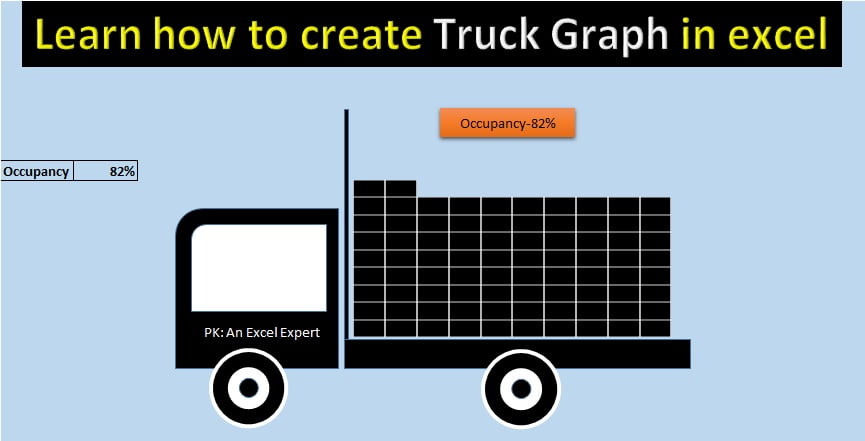
Excel is a powerful tool for creating a wide range of charts and infographics. including Truck Graph to show Occupancy or workload. In this blog post, we will look at the benefits of using Excel to create a Truck Graph in Excel. We will also walk you through the steps involved in creating one.
One of the main benefits of using Excel to create a Truck Graph to show Occupancy or workload in Excel is that it is a straightforward process. You can create it quickly and easily. This is because Excel built-in features and tools make it easy to create charts and visualizations. Additionally, Excel provides several different options for customizing the look and feel of your chart. You can make it look exactly the way you want.
To add a truck load infographic to your chart, you can create the truck infographic in Excel itself.
Truck Graph in Excel
Infographics, a visual representation of information, serve as a gateway for comprehending complex subjects in an effortless manner. Excel, a tool with a wealth of chart-making options and features. It simplifies the task of creating captivating infographics. One of the most favored chart styles for infographics is the Stacked Bar Chart.
Click to buy Truck Graph in Excel
Excel Shapes: Elevating Your Charts to the Next Level
Excel shapes are graphical elements that you can add to your charts to enhance their aesthetic appeal and emphasize crucial data points. Shapes in Excel can be as simple as lines and circles or more elaborate shapes like stars and arrows.
Adding a shape to your chart in Excel is easy, simply click the “Insert” tab on the ribbon, select the “Shapes” option, and then choose the desired shape. Once you’ve added the shape, you can use the formatting options to change its color, size, and position.
The use of shapes in Excel charts serves to draw attention to specific data points in your chart. For instance, you could add an arrow pointing towards a data point that’s either exceptionally high or low, highlighting its significance. Furthermore, shapes can also be utilized to add annotations to your chart, making it easier to interpret and understand the data.
Pictures: Adding Visual Appeal to Your Excel Charts
Excel charts can be further augmented by adding pictures to them. Pictures in Excel can range from simple images such as logos or icons to more complex images such as maps or diagrams.
Adding a picture to your chart in Excel is just as effortless as adding a shape, simply click the “Insert” tab on the ribbon, select the “Picture” option, and then choose the image you desire to add. Once you’ve added the picture, you can use the formatting options to modify its size, position, and appearance.
The use of pictures in Excel charts can enhance their visual appeal and emphasize crucial data points. For instance, you could add a company logo to the chart to give it a branded look, or you could add a map to display the location of the data. Additionally, pictures can also be used to add annotations to your chart, clarifying the data and making it easier to understand.
Step by step guide to learn how to create Truck chart in Excel
Unlock the secrets to constructing a visually striking truck shape with Excel shapes and generate a thorough occupancy chart effortlessly by checking out the video below. Immerse yourself in a world of data representation possibilities with Excel’s diverse array of shapes, ready at your fingertips to elevate your charts to the next level. Don’t miss the opportunity to streamline your data analysis process and make your charts stand out!
Visit our YouTube channel to learn step-by-step video tutorials
Watch our step by step video tutorial
Click to buy Truck Graph in Excel