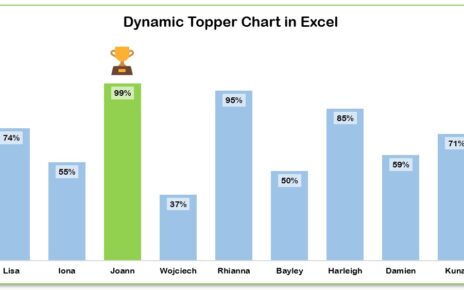
I. Introduction a. Explanation of what a dynamically highlight topper student chart is: A dynamically highlight topper student chart is
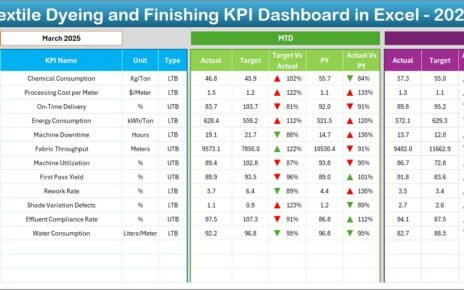
The textile industry operates in a highly competitive environment where efficiency, quality, cost control, and delivery timelines determine success. Especially
Climate change is one of the most pressing challenges of our time. Organizations and governments worldwide are striving to monitor