Office Key Access Request Tracker in Excel — Overview Managing office keys sounds simple — until 12 different people share
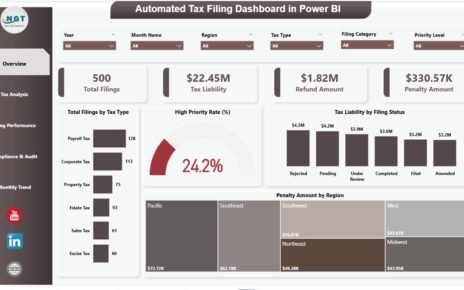
In today’s data-driven financial environment, managing tax filings has become more complex and time-sensitive. Businesses, accountants, and tax professionals deal
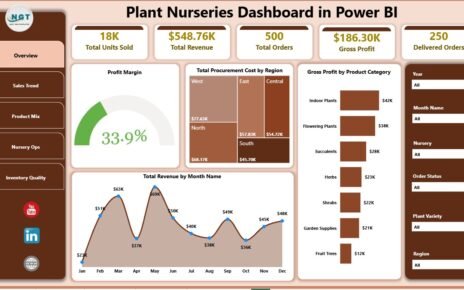
Plant nurseries create more data than many owners expect: units sold, order count, revenue, gross profit, procurement cost, product categories,