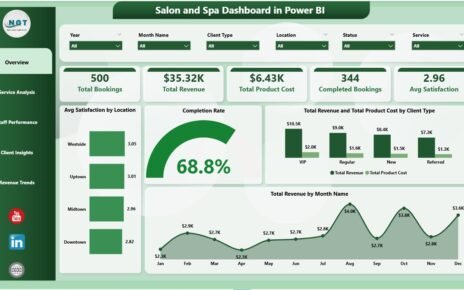
Salon and Spa Dashboard in Power BI is a ready-to-use analytics template designed for salon owners, spa managers, and beauty
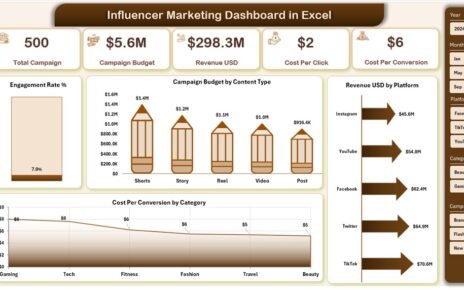
Influencer marketing has changed digital marketing completely. Brands no longer depend only on traditional ads. Instead, they collaborate with creators
A well-maintained home is not just about aesthetics; it’s about ensuring the longevity and functionality of your property. One of