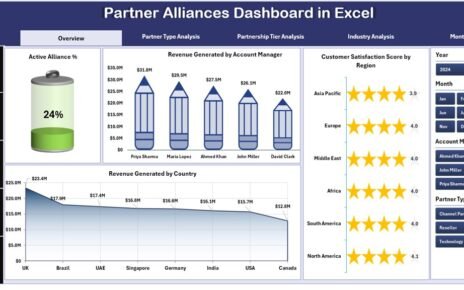
Home>Blogs>Power Point Visualization>Data-Driven Gantt Chart in PowerPoint with Conditional Formatting>Gantt Chart in PPT -1
Gantt Chart in PPT -1
07
Sep 2022
195Comments Off on Gantt Chart in PPT -1
PK
Meet PK, the founder of PK-AnExcelExpert.com! With over 15 years of experience in Data Visualization, Excel Automation, and dashboard creation. PK is a Microsoft Certified Professional who has a passion for all things in Excel. PK loves to explore new and innovative ways to use Excel and is always eager to share his knowledge with others. With an eye for detail and a commitment to excellence, PK has become a go-to expert in the world of Excel. Whether you're looking to create stunning visualizations or streamline your workflow with automation, PK has the skills and expertise to help you succeed. Join the many satisfied clients who have benefited from PK's services and see how he can take your Excel skills to the next level!
https://www.pk-anexcelexpert.com
Related Articles
Team Management KPI Dashboard in Power BI
Team performance plays a critical role in the success of any organization. Whether you manage a small group or a
Veterinary Services Dashboard in Excel
Managing a veterinary clinic involves much more than treating animals. Every day, clinics handle appointments, services, medications, billing, customer satisfaction,
Document Management KPI Dashboard in Power BI
In today’s digital landscape, managing documents effectively is more than a basic necessity—it's a strategic function. That’s why organizations are


