Dynamic Step Chart-8
28
May 2018
3560
PK
Meet PK, the founder of PK-AnExcelExpert.com! With over 15 years of experience in Data Visualization, Excel Automation, and dashboard creation. PK is a Microsoft Certified Professional who has a passion for all things in Excel. PK loves to explore new and innovative ways to use Excel and is always eager to share his knowledge with others. With an eye for detail and a commitment to excellence, PK has become a go-to expert in the world of Excel. Whether you're looking to create stunning visualizations or streamline your workflow with automation, PK has the skills and expertise to help you succeed. Join the many satisfied clients who have benefited from PK's services and see how he can take your Excel skills to the next level!
https://www.pk-anexcelexpert.com
Related Articles
Graphic Design KPI Dashboard in Power BI
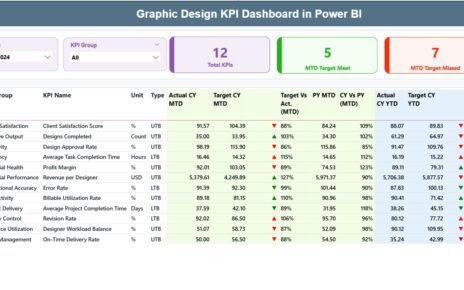
Graphic design teams handle many activities at the same time. They work on branding, advertising, social media, UI/UX assets, packaging,
Nonprofit Organizations Report in Excel
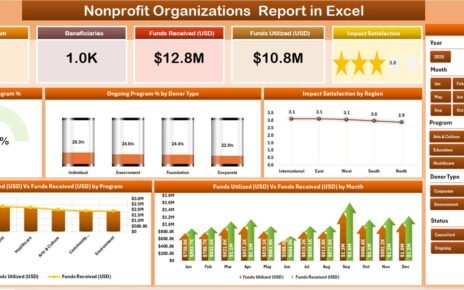
The Nonprofit Organizations Report in Excel tracks 5 headline KPIs across 4 sheets, with 5 interactive charts and dual slicers
Translation & Localization Dashboard in Power BI
The translation and localization industry grows rapidly. Global companies expand into new markets, user expectations increase every year, and project


