Firearms manufacturing demands accuracy, discipline, and strict compliance. Production must stay efficient. Quality must remain consistent. Safety must stay controlled. Therefore, manufacturers need clear performance visibility at all times.
However, many production facilities still rely on scattered Excel sheets. As a result, managers struggle to track targets. They miss performance gaps. They cannot compare current performance with previous year efficiently.
So, how can firearms manufacturers monitor production, quality, compliance, and financial KPIs in one interactive system?
The solution is simple.
You need a Firearms Manufacturing KPI Dashboard in Power BI.
In this comprehensive guide, you will learn:
-
What Firearms Manufacturing KPI Dashboard in Power BI is
-
Why manufacturing KPI tracking is essential
-
Detailed explanation of all 3 dashboard pages
-
Excel data structure required for setup
-
Important KPIs for firearms manufacturing
-
Advantages of Firearms Manufacturing KPI Dashboard in Power BI
-
Best Practices for Firearms Manufacturing KPI Dashboard
-
Frequently Asked Questions with Answers
Let’s explore everything step by step.
Click to Purchases Firearms Manufacturing KPI Dashboard in Power BI
What Is Firearms Manufacturing KPI Dashboard in Power BI?
Firearms Manufacturing KPI Dashboard in Power BI is a ready-to-use interactive performance monitoring solution designed for firearms production companies.
It connects with an Excel data source. Therefore, you can update numbers easily while Power BI handles the analysis and visualization.
This dashboard helps you:
-
Track MTD (Month-to-Date) performance
-
Monitor YTD (Year-to-Date) progress
-
Compare Actual vs Target
-
Analyze Current Year vs Previous Year
-
Identify target achievement instantly
Because Power BI provides dynamic visuals and slicers, managers can filter data quickly and gain insights instantly.
Why Do Firearms Manufacturers Need KPI Dashboards?
Firearms production includes:
-
Strict quality control processes
-
Regulatory compliance tracking
-
Cost management
-
Production planning
-
Inventory control
Without a structured KPI system:
-
Quality defects increase
-
Compliance risks rise
-
Production efficiency declines
-
Decision-making slows
However, when you implement a Power BI dashboard:
-
You improve operational visibility
-
You reduce risk
-
You enhance accountability
-
You support strategic planning
Therefore, KPI dashboards become essential for controlled manufacturing environments.
Click to Purchases Firearms Manufacturing KPI Dashboard in Power BI
Key Features of Firearms Manufacturing KPI Dashboard in Power BI
This dashboard contains 3 well-designed pages inside the Power BI Desktop file.
Let’s examine each page.
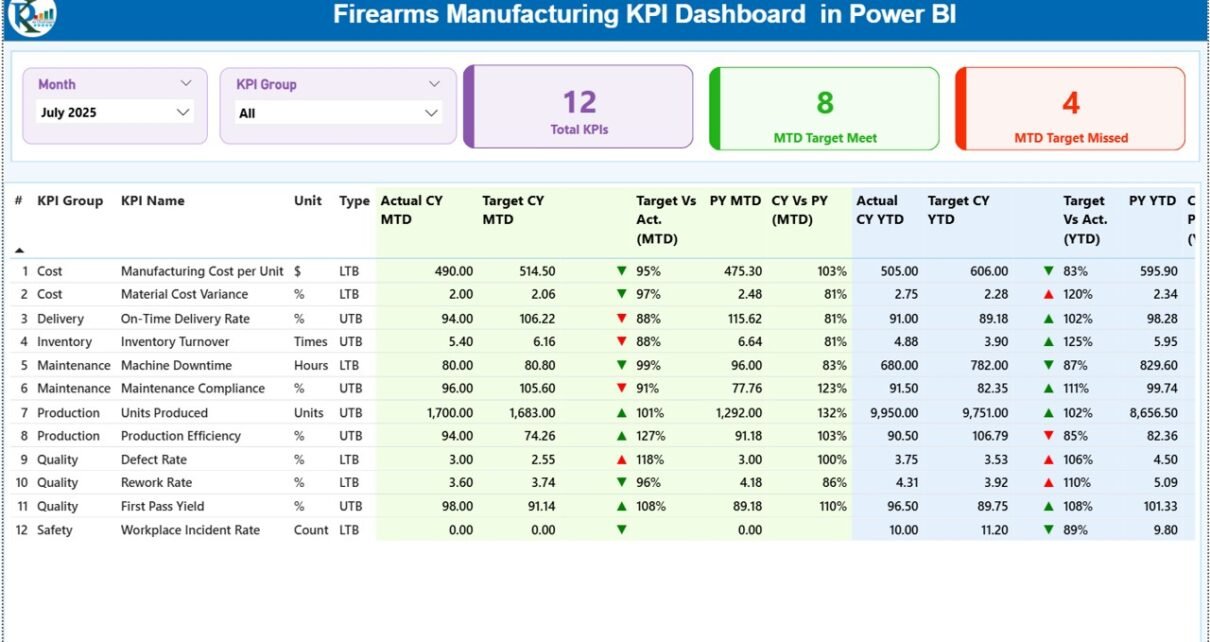
1️⃣ Summary Page – Central Performance View

The Summary Page acts as the control center of the dashboard.
Top Section – Slicers
At the top, you will find:
-
Month Slicer
-
KPI Group Slicer
These slicers allow you to filter performance by specific month or category.
Therefore, you can focus on production KPIs, quality KPIs, or financial KPIs easily.
KPI Cards
Below the slicers, you will see 3 key performance cards:
-
Total KPI Count
-
MTD Target Meet Count
-
MTD Target Missed Count
These cards instantly show overall performance status.
As a result, management can identify performance gaps immediately.
Detailed KPI Performance Table
Below the cards, the dashboard displays a comprehensive KPI table.
This table includes:
KPI Number
Sequence number of KPI.
KPI Group
Category of KPI such as Production, Quality, Safety, Financial.
KPI Name
Specific KPI title.
Unit
Measurement unit such as %, Units, Currency.
Type (LTB / UTB)
-
LTB → Lower the Better (e.g., Defect Rate)
-
UTB → Upper the Better (e.g., Production Output)
MTD Performance Columns
Actual CY MTD
Current Year Month-to-Date actual value.
Target CY MTD
Target value for MTD.
MTD Icon (▲ / ▼)
Green ▲ indicates good performance.
Red ▼ indicates target missed.
Target Vs Actual (MTD)
Formula used:
This percentage shows performance ratio clearly.
PY MTD
Previous Year Month-to-Date value.
CY Vs PY (MTD)
Formula used:
This comparison shows growth trend.
YTD Performance Columns
The dashboard also displays:
-
Actual CY YTD
-
Target CY YTD
-
YTD Icon
-
Target Vs Actual (YTD)
-
PY YTD
-
CY Vs PY (YTD)
Therefore, managers analyze both short-term and long-term performance together.
Click to Purchases Firearms Manufacturing KPI Dashboard in Power BI
2️⃣ KPI Trend Page – Visual Performance Analysis

The KPI Trend page provides graphical comparison.
On the left side, you can select KPI Name using slicer.
This page shows:
-
MTD Combo Chart
-
YTD Combo Chart
Each chart compares:
-
Current Year Actual
-
Target
-
Previous Year Actual
Because of these visuals, managers can:
-
Detect seasonal trends
-
Identify performance drops
-
Compare targets with historical data
Therefore, performance analysis becomes easier and faster.
3️⃣ KPI Definition Page – Drill-Through Page

This page remains hidden but accessible via drill-through from Summary Page.
When you drill through a KPI, you can view:
-
KPI Formula
-
KPI Definition
-
KPI Group
-
Unit
-
KPI Type
This feature ensures transparency in KPI calculations.
To return, click the back button at the top left corner.
Excel Data Structure – Data Source Setup
The dashboard uses an Excel file as data source.
This file contains 3 worksheets.
1️⃣ Input_Actual Sheet
You must enter:
-
KPI Name
-
Month (First date of month)
-
MTD Value
-
YTD Value
Example:
| KPI Name | Month | MTD | YTD |
|---|---|---|---|
| Units Produced | 01-Jan-2024 | 5000 | 5000 |
2️⃣ Input_Target Sheet
Here, enter:
-
KPI Name
-
Month (First date of month)
-
Target MTD
-
Target YTD
3️⃣ KPI Definition Sheet
Fill:
-
KPI Number
-
KPI Group
-
KPI Name
-
Unit
-
Formula
-
Definition
-
Type (LTB or UTB)
Because the system relies on structured data, consistent formatting is important.
Click to Purchases Firearms Manufacturing KPI Dashboard in Power BI
Important KPIs in Firearms Manufacturing
Let’s review essential KPIs.
Production KPIs
-
Units Produced
-
Production Efficiency %
-
Machine Utilization %
-
On-Time Production Rate
Quality KPIs
-
Defect Rate
-
Rework Percentage
-
Inspection Pass Rate
-
Customer Complaint Rate
Safety & Compliance KPIs
-
Safety Incident Count
-
Compliance Audit Score
-
Regulatory Violation Count
Financial KPIs
-
Cost per Unit
-
Production Cost Variance
-
Gross Profit Margin
Tracking these KPIs ensures stable operations and regulatory compliance.
Click to Purchases Firearms Manufacturing KPI Dashboard in Power BI
Advantages of Firearms Manufacturing KPI Dashboard in Power BI
Now let’s explore key benefits.
1️⃣ Real-Time Data Visualization
Interactive charts improve clarity.
2️⃣ Dynamic Filtering
Slicers allow flexible data analysis.
3️⃣ Instant Performance Status
Icons quickly show target achievement.
4️⃣ Year-over-Year Comparison
CY vs PY calculations improve strategic planning.
5️⃣ Drill-Through Transparency
Users understand KPI logic clearly.
6️⃣ Excel Integration
Easy data update without modifying dashboard.
7️⃣ Improved Compliance Monitoring
Better tracking reduces regulatory risk.
Best Practices for Firearms Manufacturing KPI Dashboard
Follow these best practices to maximize benefits.
1️⃣ Use First Date of Month
Maintain consistent date format.
2️⃣ Update Data Monthly
Ensure regular data entry.
3️⃣ Validate KPI Type
Assign LTB and UTB properly.
4️⃣ Review Trend Charts
Monitor fluctuations regularly.
5️⃣ Keep KPI Definitions Clear
Write simple formulas and definitions.
6️⃣ Audit Data Accuracy
Verify numbers before refresh.
7️⃣ Focus on Critical KPIs
Avoid overloading dashboard.
How Does This Dashboard Improve Decision-Making?
This dashboard transforms raw production data into actionable insights.
Instead of reviewing lengthy reports:
-
Managers see performance instantly
-
Supervisors detect inefficiencies
-
Compliance teams monitor risks
-
Finance teams track cost control
Therefore, decisions become faster and more informed.
Conclusion
Firearms manufacturing requires high precision, strict compliance, and strong operational control. However, without structured KPI monitoring, performance gaps remain hidden.
The Firearms Manufacturing KPI Dashboard in Power BI provides:
-
MTD and YTD tracking
-
Target vs Actual comparison
-
Year-over-Year analysis
-
Interactive visual charts
-
Drill-through KPI definitions
Because it combines Excel flexibility with Power BI visualization power, it delivers complete manufacturing performance control.
If you want to enhance efficiency, improve compliance, and strengthen operational monitoring, this Power BI dashboard offers a powerful solution.
Click to Purchases Firearms Manufacturing KPI Dashboard in Power BI
Frequently Asked Questions (FAQs)
1️⃣ What is Firearms Manufacturing KPI Dashboard in Power BI?
It is an interactive dashboard that tracks production, quality, safety, and financial KPIs using Power BI.
2️⃣ Can I update data through Excel?
Yes. You can update the connected Excel file and refresh Power BI.
3️⃣ What does LTB and UTB mean?
LTB means Lower the Better.
UTB means Upper the Better.
4️⃣ Can I add new KPIs?
Yes. Add them in the KPI Definition sheet and update Excel data.
5️⃣ Does it support year-over-year comparison?
Yes. It calculates CY vs PY for MTD and YTD automatically.
6️⃣ Is this dashboard suitable for small manufacturing units?
Yes. Both small and large firearms manufacturers can use it.
7️⃣ Do I need advanced Power BI skills?
No. Basic knowledge is sufficient to refresh and use the dashboard.
Click to Purchases Firearms Manufacturing KPI Dashboard in Power BI
Visit our YouTube channel to learn step-by-step video tutorials