Managing a luxury brand demands far more than aesthetic perfection and premium pricing. It’s about balancing quality, exclusivity, customer satisfaction,
In today’s fast-changing business environment, both Finance and HR teams play a critical role in driving customer experience. Companies no
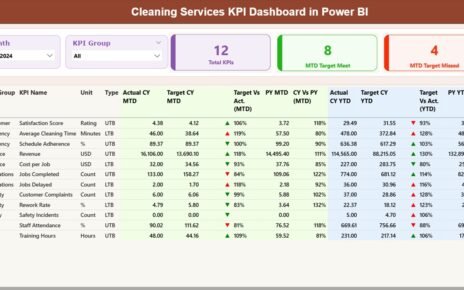
Cleaning companies work in a fast and demanding environment. Every day, teams try to complete scheduled tasks, meet client standards,