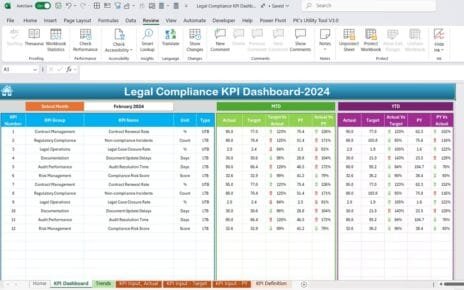
Creating an effective Legal Compliance KPI Dashboard in Excel can streamline your organization's legal compliance monitoring and reporting processes. This
The Audit Preparation Calendar in Excel organizes audit events across 5 interactive worksheets with 3 calendar views, VBA-powered event forms,
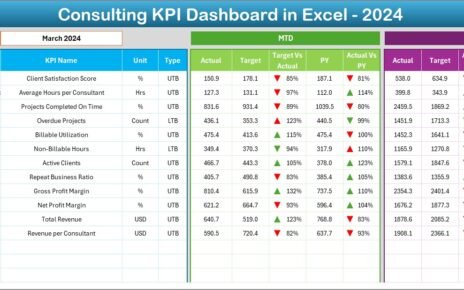
In today’s consulting industry, information moves fast and clients expect measurable results. Successful consulting firms rely on Key Performance Indicators