Salon and Spa Dashboard in Power BI is a ready-to-use analytics template designed for salon owners, spa managers, and beauty business professionals who need a powerful way to track revenue, monitor therapist performance, analyze client behavior, and visualize service trends. This Power BI Dashboard template includes 5 interactive analysis pages that cover every critical dimension of salon and spa operations — from high-level KPI summaries to deep-dive revenue trend analysis. Built with clean visuals, interactive slicers, and dynamic charts, this dashboard transforms raw booking and revenue data into actionable business intelligence.
📌 Click here to Purchase Salon and Spa Dashboard in Power BI
Key Features of Salon and Spa Dashboard in Power BI
The Salon and Spa Dashboard in Power BI is packed with features that make salon analytics effortless. Here are the highlights:
- 5 Dedicated Dashboard Pages — Overview, Service Analysis, Staff Performance, Client Insights, and Revenue Trends
- 5 Core KPI Cards — Total Bookings, Total Revenue, Total Product Cost, Completed Bookings, and Average Satisfaction displayed on the Overview page
- Multi-Location Comparison — Charts that break down satisfaction scores and revenue by salon location
- Top 5 Therapist Rankings — Identify your best-performing staff by revenue, bookings, and tips
- Client Segmentation — Analyze bookings and revenue by client type and booking source
- Revenue Trend Analysis — Monthly tracking of revenue vs. product costs with payment method insights
- Interactive Slicers — Filter every chart by date, location, service category, client type, and more
- Plug-and-Play Design — Open the .pbix file in Power BI Desktop, replace the sample data, and your dashboard is ready
Whether you run a boutique day spa or a multi-location salon chain, this dashboard gives you complete visibility into your business performance. You can also explore the Salon and Spa Dashboard in Excel if you prefer working in spreadsheets, or check out the Beauty Salons Dashboard in Power BI for an alternative beauty industry analytics solution.
Dashboard Pages Explained
1 – Overview Page
The Overview page serves as your salon’s command center. At the top, five KPI cards display Total Bookings, Total Revenue, Total Product Cost, Completed Bookings, and Avg Satisfaction, giving you an instant health check of your business. Below the cards, interactive charts provide deeper analysis: Avg Satisfaction by Location helps you compare client experience across branches, a Completion Rate visual shows what percentage of bookings were fulfilled, Total Revenue and Total Product Cost by Client Type reveals which customer segments are most profitable, and Total Revenue by Month Name tracks your income patterns over time. Dynamic slicers allow you to filter the entire page by date range, location, service type, and other key dimensions.
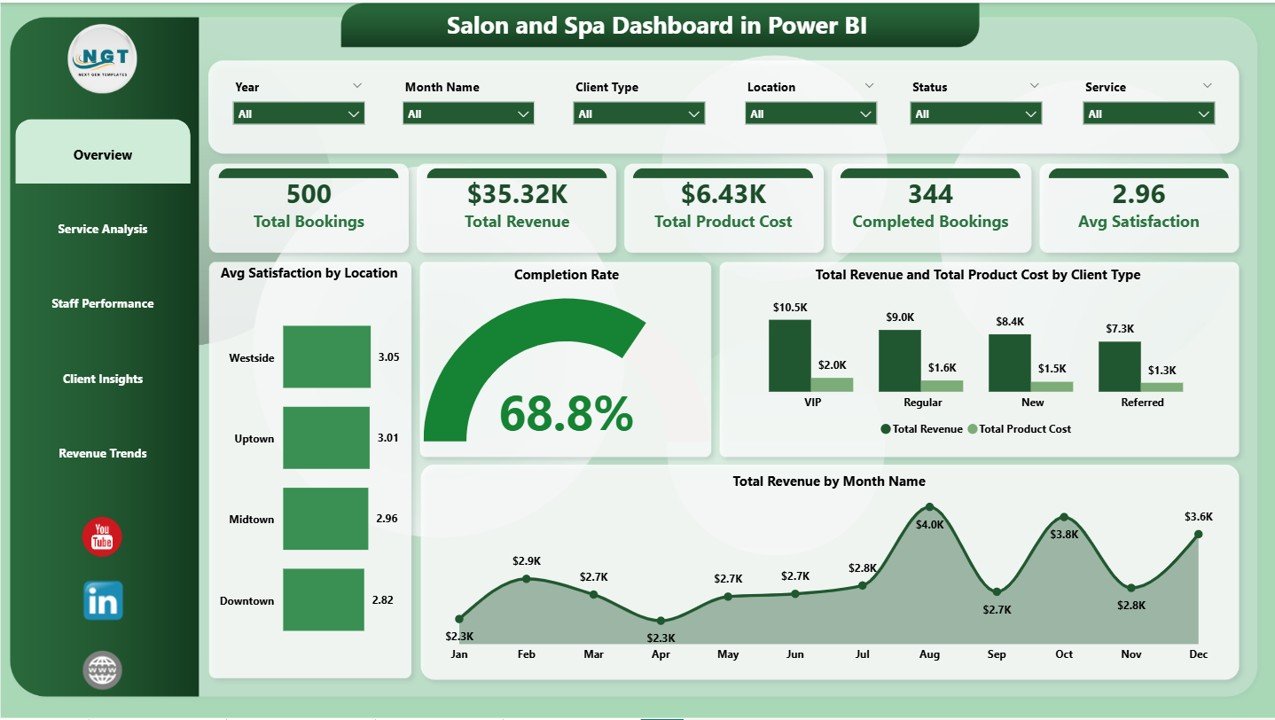
Salon and Spa Dashboard in Power BI
2 – Service Analysis
The Service Analysis page lets you drill into the performance of individual service categories. Total Revenue and Total Product Cost by Service Category shows which services are most profitable after accounting for product costs. Avg Satisfaction by Service Category highlights which treatments receive the best client feedback. Total Revenue by Client Type breaks down how different customer groups contribute to each service’s revenue. Together, these visuals help salon managers decide where to invest in training, marketing, and pricing adjustments.

Service Analysis
3 – Staff Performance
The Staff Performance page focuses on your team’s productivity and earnings. Total Revenue by Top Five Therapist ranks your highest-earning staff members, while Total Bookings by Top Five Therapist shows who handles the most appointments. Total Tips by Top Five Therapist reveals which therapists receive the most appreciation from clients. This page is invaluable for performance reviews, commission calculations, incentive programs, and identifying training opportunities for underperforming team members.
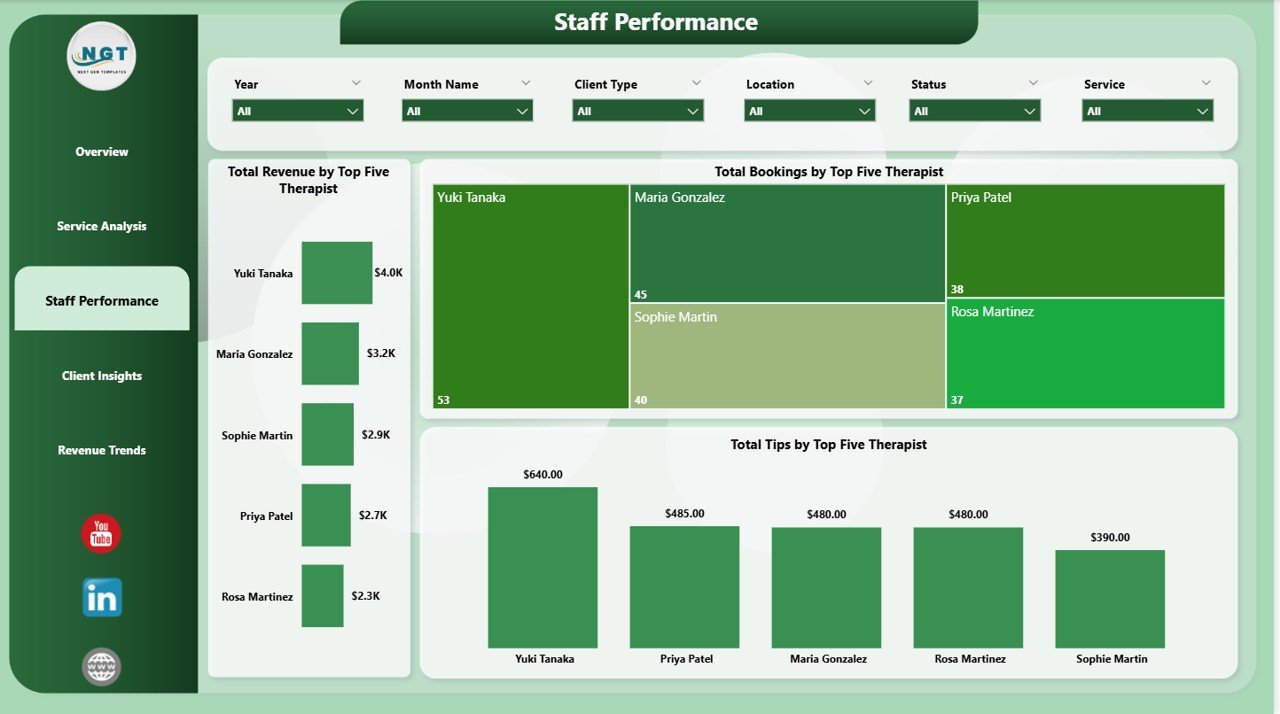
Staff Performance
4 – Client Insights
Understanding your clients is essential for growing a salon business. The Client Insights page provides Avg Satisfaction by Client Type to compare how satisfied different client categories are, Total Bookings by Booking Source to understand which marketing channels drive the most appointments, and Total Revenue by Booking Source to see which acquisition channels are most valuable in dollar terms. Use these insights to allocate marketing budgets and improve client retention strategies.
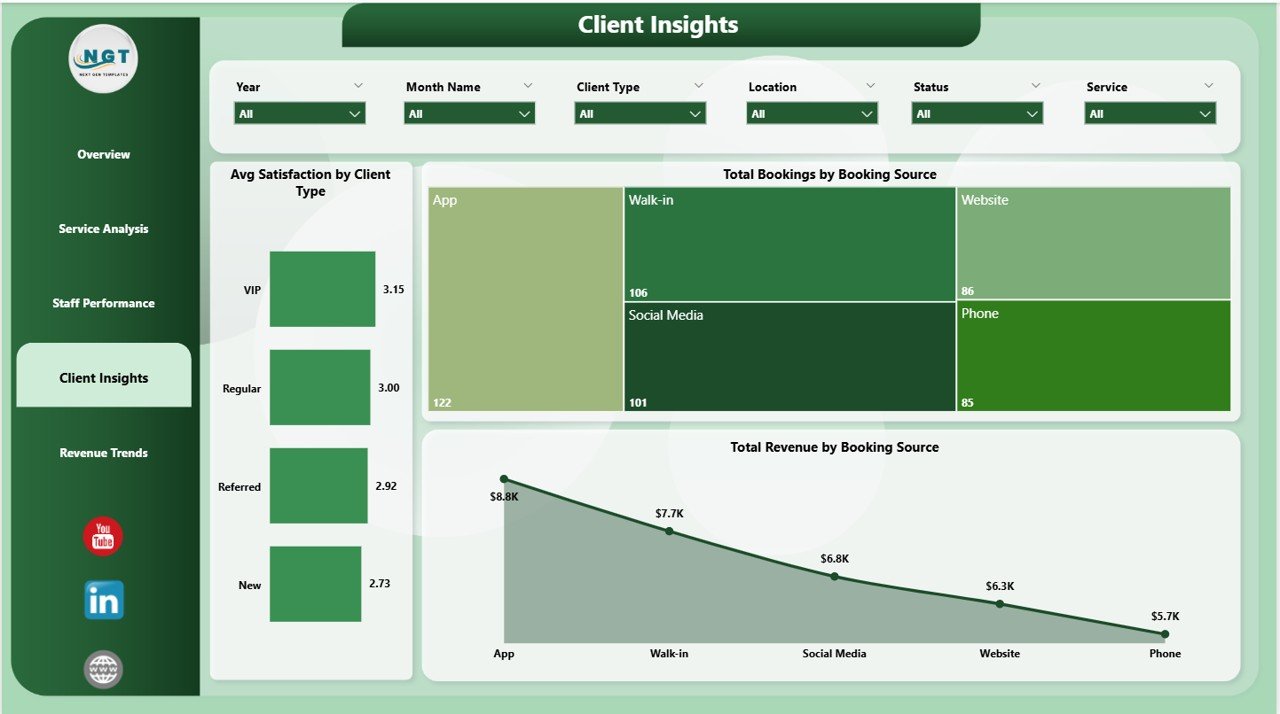
Client Insights
5 – Revenue Trends
The Revenue Trends page delivers the financial big picture. Total Revenue by Payment Method shows whether clients prefer cash, credit cards, or digital wallets. Total Revenue by Location compares earnings across your salon branches. Total Revenue and Total Product Cost by Month Name visualizes your monthly profitability and cost trends, helping you identify seasonal peaks and plan inventory accordingly. This page is perfect for quarterly reviews and financial forecasting.
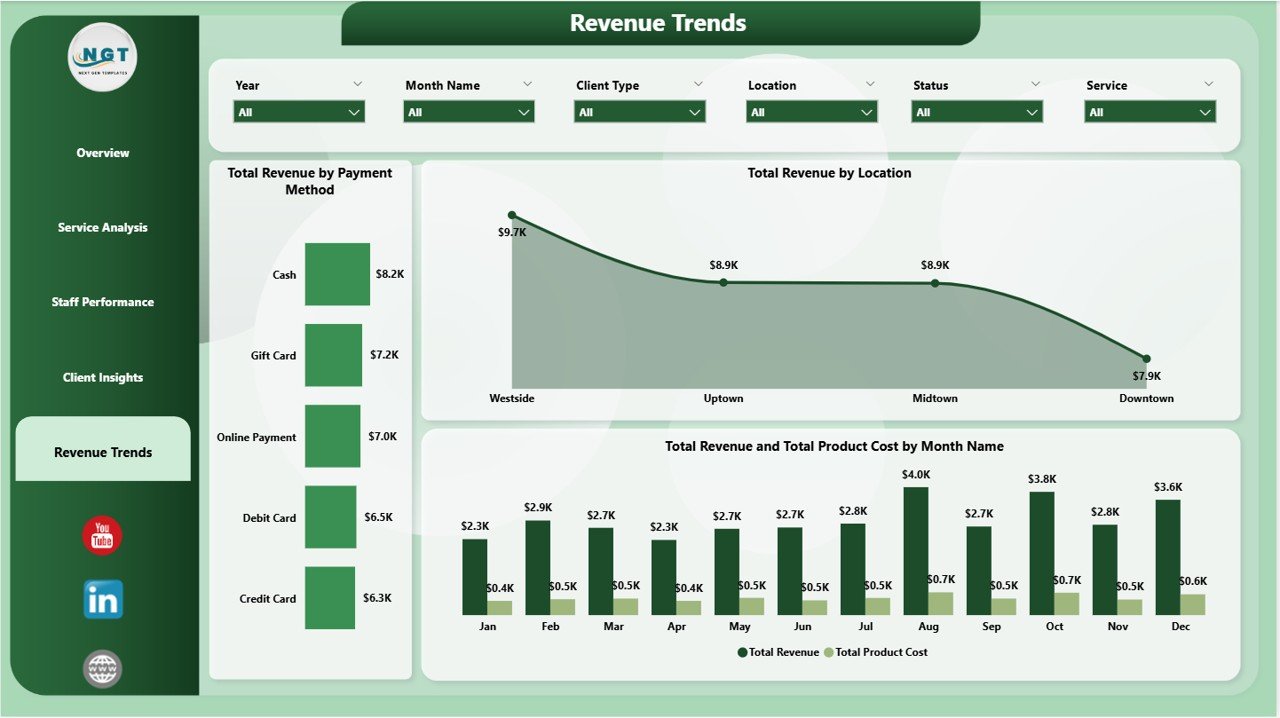
Revenue Trends
Advantages of Salon and Spa Dashboard in Power BI
- Comprehensive Coverage — Five dedicated pages cover revenue, services, staff, clients, and financial trends in a single report
- Real-Time Filtering — Slicers and cross-filters let you explore data from any angle instantly
- Staff Accountability — Top 5 therapist rankings make performance transparent and fair
- Multi-Location Support — Built-in location-level analysis for salon chains and franchise owners
- Zero Coding Required — Simply replace sample data with your own; all visuals auto-update
- Professional Presentation — Clean, modern design suitable for management meetings, investor presentations, and internal reviews
Opportunities for Improvement
- Add appointment-level detail with time-slot utilization analysis to optimize scheduling
- Include a customer loyalty or retention page tracking repeat visit frequency
- Integrate with online booking APIs (like Fresha, Vagaro, or Booksy) for automated data refresh
- Add product inventory tracking alongside product cost analysis
- Include forecasting visuals using Power BI’s built-in time-series analytics for revenue prediction
Best Practices for Using This Dashboard
- Update data weekly — Import your latest booking and revenue data every week for timely insights
- Use slicers strategically — Filter by specific date ranges, locations, or service categories to answer targeted business questions
- Share via Power BI Service — Publish the report to your Power BI workspace so your team can access it from any browser
- Combine with Excel exports — Export filtered data to Excel for custom analysis or presentations
- Review Staff Performance monthly — Use the Top 5 rankings as a basis for performance conversations and incentive distribution
- Monitor booking sources — Track which channels (walk-ins, website, social media, referrals) bring the highest-value clients
For more Power BI techniques, visit Microsoft Power BI Documentation for official tutorials and best practices.
Explore Relevant Templates
- Salon and Spa Dashboard in Excel — The Excel version of this beauty business analytics dashboard
- Beauty Salons Dashboard in Power BI — An alternative Power BI dashboard for the beauty industry
- Beauty Salons Dashboard in Excel — Excel-based salon performance tracking and reporting
- Salon and Spa Dashboard in Excel — Blog Post — Detailed walkthrough of the Excel version
Frequently Asked Questions
What is the best Power BI dashboard for a salon or spa business?
The Salon and Spa Dashboard in Power BI is one of the best options available. It includes 5 interactive pages covering revenue tracking, service analysis, staff performance, client insights, and revenue trends — all in a single .pbix file that works out of the box with Power BI Desktop.
How many KPIs does this salon dashboard track?
The dashboard tracks 5 core KPIs on its Overview page: Total Bookings, Total Revenue, Total Product Cost, Completed Bookings, and Average Satisfaction. Additional metrics are analyzed across the other four pages through detailed charts and rankings.
Can I connect this dashboard to my salon booking software?
Yes. Power BI supports connections to hundreds of data sources including Excel files, CSV exports, SQL databases, and online APIs. If your booking software (such as Fresha, Vagaro, or Booksy) supports data export, you can connect it to this dashboard for automated or semi-automated data refresh.
Do I need to pay for Power BI to use this template?
No. You can use this dashboard with Power BI Desktop, which is completely free to download from Microsoft. You only need a paid Power BI Pro or Premium license if you want to publish and share the report online with your team through the Power BI Service.
How do I track salon revenue in Power BI?
This Salon and Spa Dashboard in Power BI makes revenue tracking simple. The Overview page shows Total Revenue as a KPI card, the Revenue Trends page breaks down revenue by payment method, location, and month, and the Service Analysis page compares revenue across service categories. Simply replace the sample data with your salon’s actual transaction records and all revenue visuals update automatically.
Is there an Excel version of this salon dashboard?
Yes. NextGenTemplates offers a Salon and Spa Dashboard in Excel that provides similar analytics in a spreadsheet-based format with pivot tables and interactive charts.
Conclusion
The Salon and Spa Dashboard in Power BI is a must-have analytics tool for any beauty business looking to make data-driven decisions. With 5 comprehensive dashboard pages tracking everything from booking volumes and revenue trends to staff productivity and client satisfaction, this template eliminates the guesswork from salon management. Download it today, connect your data, and start uncovering insights that drive growth for your salon or spa business.
📌 Click here to Purchase Salon and Spa Dashboard in Power BI
🎥 Visit our YouTube channel for step-by-step Power BI tutorials:
👉 Youtube.com/@PK-AnExcelExpert